. 2022 Oct 5;42(40):7594-7614.
doi: 10.1523/JNEUROSCI.2048-20.2022. Epub 2022 Aug 26.

Attractor-like Dynamics in the Subicular Complex

Affiliations

Attractor-like Dynamics in the Subicular Complex

Apoorv Sharma et al. J Neurosci. .

Abstract

Distinct computations are performed at multiple brain regions during the encoding of spatial environments. Neural representations in the hippocampal, entorhinal, and head direction (HD) networks during spatial navigation have been clearly documented, while the representational properties of the subicular complex (SC) are relatively underexplored, although it has extensive anatomic connections with various brain regions involved in spatial information processing. We simultaneously recorded single units from different subregions of the SC in male rats while they ran clockwise on a centrally placed textured circular track (four different textures, each covering a quadrant), surrounded by six distal cues. The neural activity was monitored in standard sessions by maintaining the same configuration between the cues, while in cue manipulation sessions, the distal and local cues were either rotated in opposite directions to create a mismatch between them or the distal cues were removed. We report a highly coherent neural representation of the environment and a robust coupling between the HD cells and the spatial cells in the SC, strikingly different from previous reports of coupling between cells from co-recorded sites. Neural representations were (1) originally governed by the distal cues under local-distal cue-conflict conditions, (2) controlled by the local cues in the absence of distal cues, and (3) governed by the cues that are perceived to be stable. We propose that such attractor-like dynamics in the SC might play a critical role in the orientation of spatial representations, thus providing a "reference map" of the environment for further processing by other networks.SIGNIFICANCE STATEMENT The subicular complex (SC) receives major inputs from the entorhinal cortex and the hippocampus, and head direction (HD) information directly from the HD system. Using cue-conflict experiments, we studied the hierarchical representation of the local and distal cues in the SC to understand its role in the cognitive map, and report a highly coherent neural representation with robust coupling between the HD cells and the spatial cells in different subregions of the SC exhibiting attractor-like dynamics unaffected by the cue manipulations, strikingly different from previous reports of coupling between cells from co-recorded sites. This unique feature may allow the SC to function as a single computational unit during the representation of space, which may serve as a reference map of the environment.

Keywords: attractor dynamics; head direction cell; neural representation; place cell; spatial navigation; subicular complex.


Figures

Figure 1.
Figure 1.
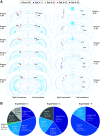
Recording sites in the SC and experimental details. A, Schematic representation of the extent of in vivo neurophysiological recordings from different subregions of the SC. Tetrode locations of individual rats are color-coded and shown in the right hemisphere, while the details of different subregions of the SC are mentioned in the left hemisphere (adapted from Paxinos and Watson, 2007). B, Pie charts represent details of simultaneous recordings from different subregions of the SC (days and sessions) in different rats and experiments.
Figure 2.
Figure 2.
Representative examples of tetrode tracks in the SC. A–C, Representative examples of Nissl-stained coronal sections of the rat brain show tetrode tracks (indicated by arrow) in the SUB (A), the PrS (B), and the PaS (C) regions of the SC. The boundaries of different subregions of the SC at corresponding plates from the rat brain atlas (adapted from Paxinos and Watson, 2007) are shown below. Scale bar, 1 mm.
Figure 3.
Figure 3.
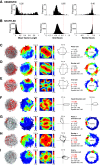
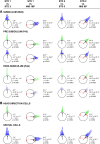
Identification of cell types in the SC. A, B, Distribution of the mean vector length, the grid score, and the border score values of all the cells recorded (observed) from different regions of the SC on the circular platform and distribution of these values after random shuffling of spike sequence (shuffled). Red line indicates threshold values (99th percentile of the shuffled data). C–I, Representative examples each for different types of cells recorded from the SC region. Each row shows the trajectory of the rat (gray lines) superimposed with the spikes (red dots), firing rate map, spatial autocorrelogram, firing rate as a function of head direction, followed by their mean vector length (r), grid score (g), border score (b), directional information score (Dir info), and spatial information score (Spatial info) values based on the recordings on the circular platform. Scores in red represent above the threshold value. Corresponding firing rate maps or HD tuning curves of these cells recorded on the circular track session are shown at the end, along with peak firing rate. The rate maps are color coded (red represents >90% of the peak firing rate; blue represents no firing), and the successive decrements in peak firing rates are shown with intervening colors of the spectrum.
Figure 4.
Figure 4.
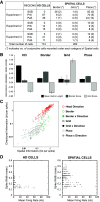
Description of the cells recorded from the SC. A, Table represents the number of cells recorded in each experiment from different subregions of the SC. *Number of conjunctive cells (border × direction, grid × direction, and place × direction) recorded under each category of spatial cells. B, Bar graphs represent the average mean vector lengths, border scores, and grid scores (mean ± SEM) of different cell types in the SC (based on the recordings from the platform session). C, Scatter plot in log-log scale represents the distribution of different cell types based on their directional information score and spatial information score. Red, green, black, and gray open circles represent HD cells, border cells, grid cells, and place cells, respectively. Green, black, and gray filled circles represent border × direction cells, grid × direction cells, and place × direction cells, respectively. D, Scatter plot comparing the mean firing rate versus spike width of all the HD cells and the spatial cells from the SC recorded on the circular platform.
Figure 5.
Figure 5.
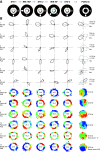
Local–distal cue-conflict experiment. A, Schematic representation of the Local–distal cue-conflict experimental paradigm. B, Representative examples of the HD cells and the spatial cells recorded on textured circular track from different rats across STD and MIS sessions within 1 d. The axes for the HD cells (1-6) are scaled for their maximum firing rates (112.6, 85.5, 17.0, 164.8, 22.4, and 17.2 Hz, respectively). The numbers inside the firing rate maps indicate the peak firing rate in Hz. The rate maps are color coded, as described in Figure 3. Each day, on completion of track sessions, a circular platform was placed on the track and the neural activity was recorded. HD cell tuning curve (superimposed with directional occupancy in gray for circular platform session) and firing rate map of the spatial cell are shown for each example cell. Values indicate the peak firing rate, Rayleigh's mean vector length (r), peak occupancy in seconds for HD cells, and peak firing rate for spatial cells. The grid and border score are mentioned for the grid cell (cell 11) and border cell (cell 12), respectively.
Figure 6.
Figure 6.
Distal-cue-controlled highly coherent representation in the SC. A, The amount of rotation of preferred firing direction of the HD cells (green triangle) and firing fields of the spatial cells (blue circle) recorded from different subregions of the SC between STD sessions and between STD versus MIS sessions, represented around the circle (triangle/circle; open = 1 cell, filled = 2 cells). B, The amount of rotation of preferred firing direction of the HD cells and firing fields of the spatial cells, from all subregions of the SC combined (triangle/circle, open = 1 cell, filled = 3 cells). The direction of the arrow inside the circle represents the mean angle of rotation of the population, and the length of the arrow is inversely proportional to the variance of the distribution around the mean angle. Red lines indicate the rotation angle of the local (L) and distal (D) cues in MIS sessions. Values next to each plot indicate the angle of the mean vector, 95% CI, length of the mean vector (r), and corresponding significance level (p).
Figure 7.
Figure 7.
Ensemble coherence in the SC. A, Histogram represents the number of cells (HD and spatial cells, all subregions of the SC) in each of the ensemble recordings. B, Averaged angle of the mean vector (mean ± SD) calculated for each of the ensemble recordings, showing the change in preferred firing direction/firing fields of cells between STD sessions and between STD versus MIS sessions. C, Averaged length of the mean vector (mean ± SD) calculated for each of the ensemble recordings across STD versus STD and STD versus MIS comparisons.
Figure 8.
Figure 8.
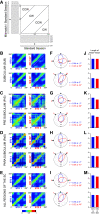
Population response in the SC. A, Schematic representation of population correlation analysis for STD versus STD and STD versus MIS sessions. B–E, Correlation matrices from population firing rate vectors at each location on the track between STD versus STD and STD versus MIS sessions, created separately for the cells recorded from SUB (B), PrS (C), PaS (D), and by pooling all the cells recorded from different regions of the SC (E). The central diagonal is indicated by a dashed white line in STD versus MIS matrices. Correlation matrices are color coded between 0 and 1 (Pearson's r values) to show the gradation from the lowest correlation value 0 (blue) to the highest correlation value 1 (brown), and a single color bar is shown for all the correlation matrices at the bottom. F–I, The population activity between STD versus STD sessions (blue) and STD versus MIS sessions (red) are represented as polar plots (created from 2D spatial correlation matrices). The values next to the polar plot indicate the angle of peak correlation (r) in the case of SUB (F), PrS (G), PaS (H), and all subregions of the SC combined (I). J–M, Length of the mean vector in STD versus STD sessions (blue) and STD versus MIS sessions (red) for each of the corresponding polar plot shown in F–I.
Figure 9.
Figure 9.
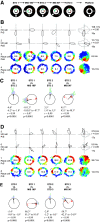
Local-cue-control of the SC representations in the absence of the distal cues. A, B, Schematic representation of the Local cue rotation in the absence of the distal cue experimental paradigm. C, D, Representative examples of the HD cell (cells 1-3 and 7-9) and the spatial cell (cells 4-6 and 10-12) response to rotations of the local cue in the absence of the distal cues in one session (C) or all five sessions (D) within a day. The axes for the HD cells are scaled for their maximum firing rates (cells 1-3 and 7-9; 121.7, 60.9, 17.1, 112.1, 24.9, and 11.8 Hz, respectively). The numbers inside the firing rate maps indicate peak firing rates in Hz. The rate maps are color coded as described in Figure 3. Each day, on completion of track sessions, a circular platform was placed on the track and the neural activity was recorded. HD cell tuning curve (superimposed with directional occupancy in gray for circular platform session) and firing rate map of the spatial cell are shown for each example cell. Values indicate the peak firing rate, Rayleigh's mean vector length (r), peak occupancy in seconds for HD cells, and peak firing rate for spatial cells. E, F, The amount of rotation of the preferred firing direction or firing field of all the cells (green triangles represent HD cells; blue circles represent spatial cells) recorded from different subregions of the SC between STD sessions and between STD versus Cue manipulation sessions in the absence of the distal cues in one session (E) or all five sessions (F) within a day, represented around the circle. The direction and length of the arrow inside the circle are as described in Figure 6. Red line indicates the rotation amount of the local cues (L). G, Amount of rotation of preferred firing direction of one HD cell (from PrS) and firing fields of six spatial cells (from SUB) recorded as an ensemble on 1 d (Rat 06, d 04). E–G, Values below each plot indicate the angle of the mean vector, 95% CI, length of the mean vector (r), and corresponding significance level (p).
Figure 10.
Figure 10.
The SC representations are governed by the cues that are perceived to be stable. A, Schematic representation of the Local–distal cue-conflict post distal cue-removal experimental paradigm. B, D, Representative examples of the HD cell (cells 1, 2, 5, and 6) and the spatial cell (cells 3, 4, 7, and 8) recorded across three STD sessions interleaved with two MIS sessions within a day. The axes for the HD cells are scaled for their maximum firing rates (cells 1, 2, 5, and 6; 135.2, 21.7, 50.1, and 20.5 Hz, respectively). The numbers inside the firing rate maps indicate peak firing rates in Hz. The rate maps are color coded as described in Figure 3. Each day, on completion of track sessions, a circular platform was placed on the track and the neural activity was recorded. HD cell tuning curve (superimposed with directional occupancy in gray for circular platform session) and firing rate map of the spatial cell are shown for each example cell. Values indicate the peak firing rate, Rayleigh's mean vector length (r), peak occupancy in seconds for HD cells, and peak firing rate for spatial cells. C, E, The amount of rotation of the preferred firing direction or firing field of all the cells (green triangles represent HD cells; blue circles represent spatial cells) recorded from different subregions of the SC between STD sessions and STD versus MIS sessions, represented around the circle. The direction and length of the arrow inside the circle are as described in Figure 6. Red lines indicate the rotation amounts of the local cues (L) and distal cues (D) in MIS sessions. Values below each plot (C,E) indicate the angle of the mean vector, 95% CI, length of the mean vector (r), and corresponding significance level (p). Sessions in which the preferred firing directions or firing fields of cells recorded in an ensemble rotated CCW in MIS 180° and CW in MIS 90° (B,C) or CW in MIS 180° and CCW in MIS 90° (D,E) were grouped separately and analyzed. C, 28 HD cells (PrS-17 and PaS-11) and 21 spatial cells (SUB-10, PrS-4 and PaS-7) in MIS 180° session; 25 HD cells (PrS-14 and PaS-11) and 11 spatial cells (SUB-2, PrS-2 and PaS-7) in MIS 90° session. E, 4 HD cells (PrS) and 8 spatial cells (SUB-4 and PrS-4) in MIS 180° session; 6 HD cells (PrS) and 13 spatial cells (SUB-8 and PrS-5) in MIS 90° session.
Figure 11.
Figure 11.
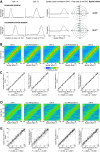
Attractor-like dynamics in the SC. A, Illustration represents the calculation of spatial offset between the co-recorded cell pair (e.g., cells A and B) in different sessions on the circular track. B, D, SXC matrices of co-recorded HD–HD cell pairs (310 cell pairs) (A) and HD–spatial cell pairs (640 cell pairs) (C) across three STD and two Cue manipulation sessions (all three experiments), sorted based on their ascending peak correlation angle values in STD 1 session. C, E, Scatter plots represent the correlation between the mean direction of SXCs of HD–HD cell pairs (B) and HD–spatial cell pairs (D) in STD versus STD and STD versus Cue manipulation sessions. The r2 values and the significance level (p) are mentioned below the scatter plots for each comparison.

Similar articles

Cited by

References

    1. Amaral DG, Witter MP (1989) The three-dimensional organization of the hippocampal formation: a review of anatomical data. Neuroscience 31:571–591. 10.1016/0306-4522(89)90424-7 - DOI - PubMed
    1. Barnes CA, McNaughton BL, Mizumori SJ, Leonard BW, Lin LH (1990) Comparison of spatial and temporal characteristics of neuronal activity in sequential stages of hippocampal processing. Prog Brain Res 83:287–300. 10.1016/s0079-6123(08)61257-1 - DOI - PubMed
    1. Bassett JP, Wills TJ, Cacucci F (2018) Self-organized attractor dynamics in the developing head direction circuit. Curr Biol 28:609–615.e3. 10.1016/j.cub.2018.01.010 - DOI - PMC - PubMed
    1. Berens P (2009) CircStat: a MATLAB Toolbox for circular statistics. J Stat Softw 31:1–21.
    1. Boccara CN, Sargolini F, Thoresen VH, Solstad T, Witter MP, Moser EI, Moser MB (2010) Grid cells in pre- and parasubiculum. Nat Neurosci 13:987–994. 10.1038/nn.2602 - DOI - PubMed

Publication types

LinkOut - more resources