. 2022 Aug 26;13(1):5016.
doi: 10.1038/s41467-022-32628-y.

The protein arginine methyltransferase PRMT9 attenuates MAVS activation through arginine methylation

Affiliations

The protein arginine methyltransferase PRMT9 attenuates MAVS activation through arginine methylation

Xuemei Bai et al. Nat Commun. .

Erratum in

Abstract

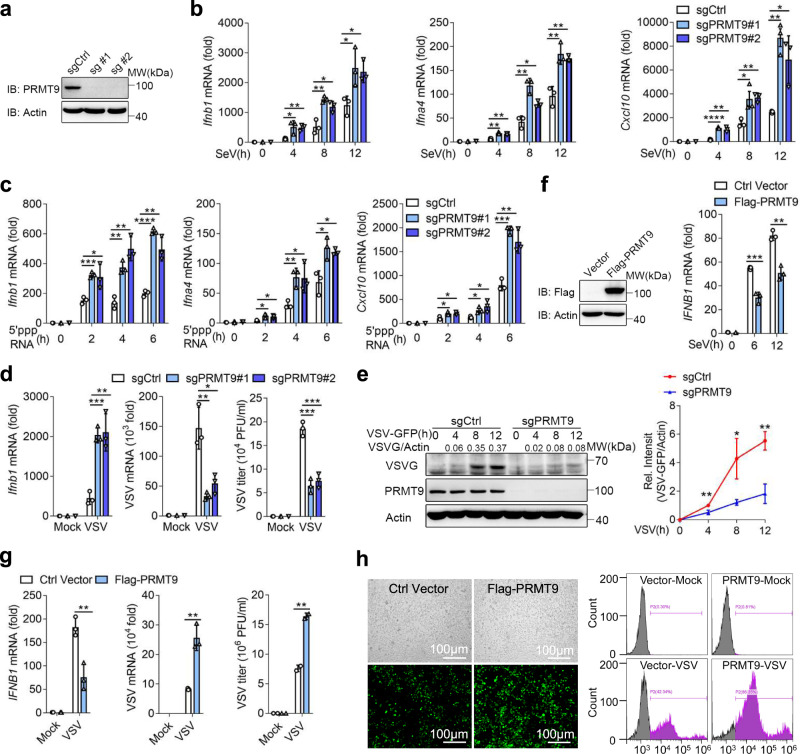
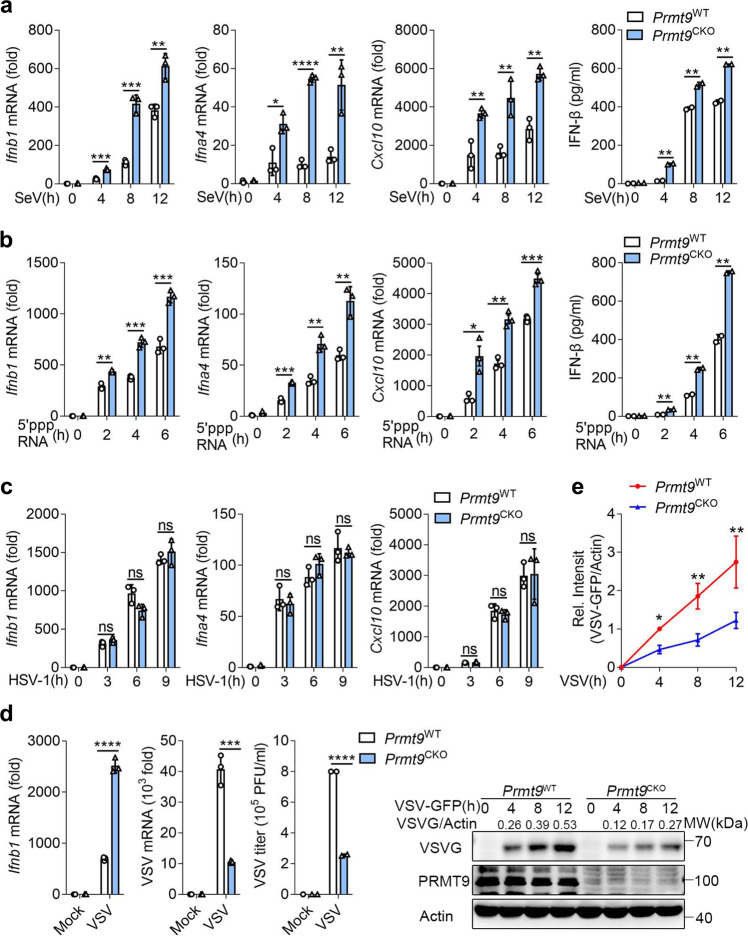
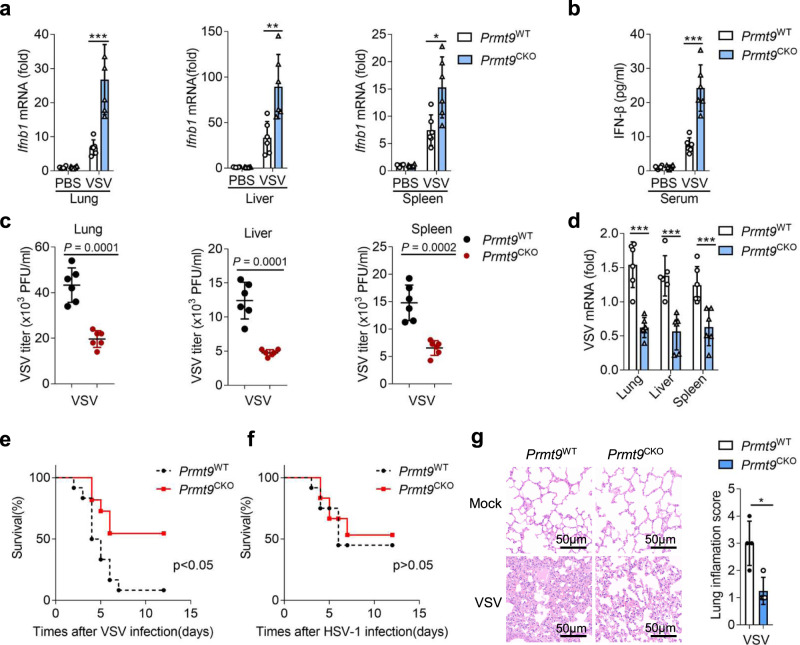
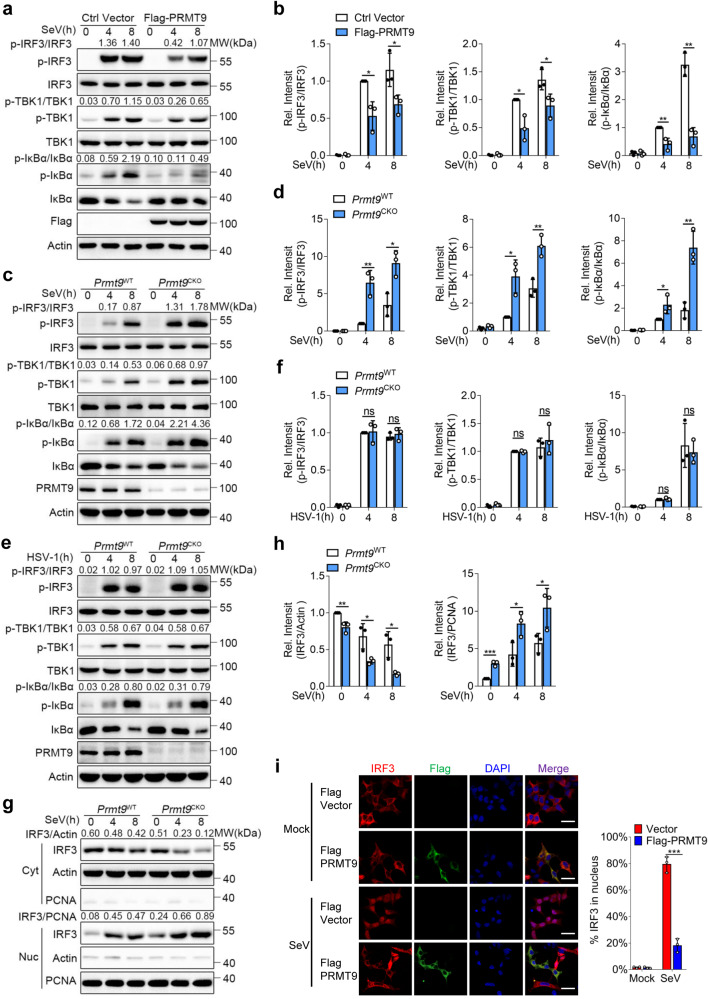
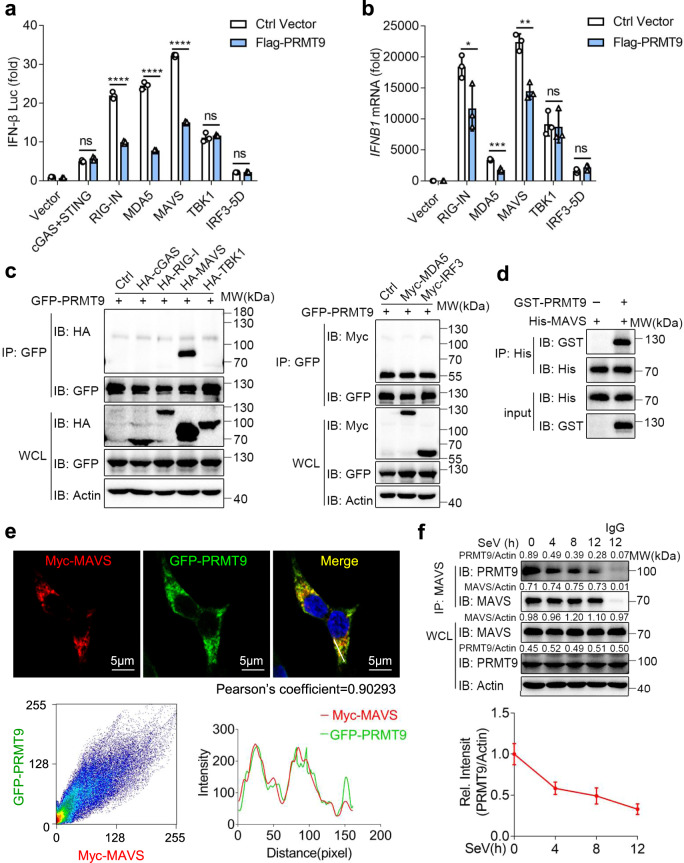
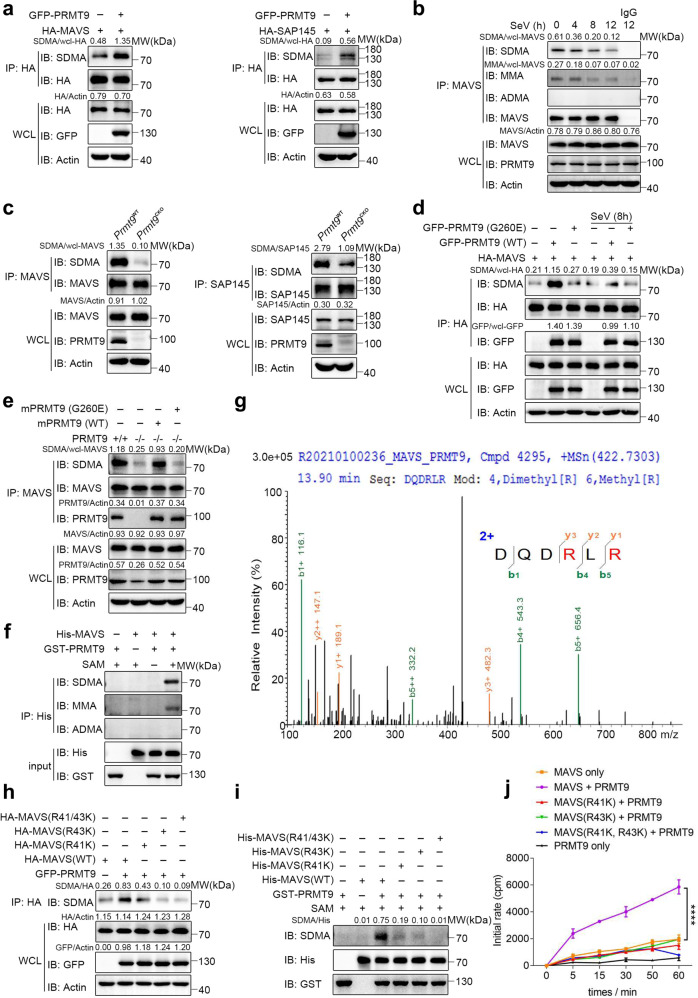
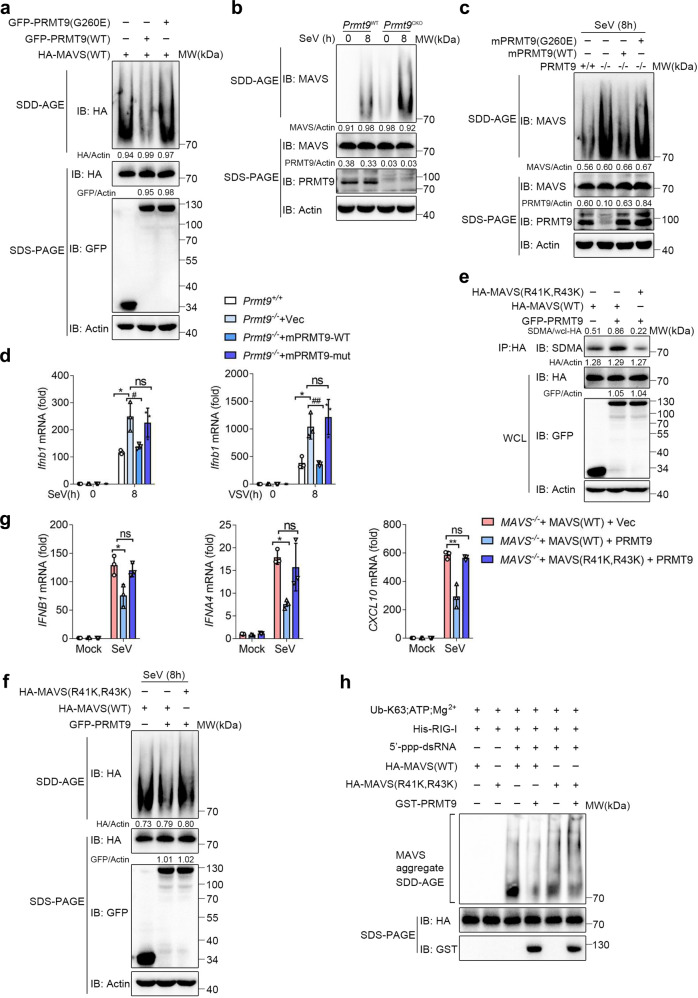
The signaling adaptor MAVS forms prion-like aggregates to activate the innate antiviral immune response after viral infection. However, spontaneous aggregation of MAVS can lead to autoimmune diseases. The molecular mechanism that prevents MAVS from spontaneous aggregation in resting cells has been enigmatic. Here we report that protein arginine methyltransferase 9 targets MAVS directly and catalyzes the arginine methylation of MAVS at the Arg41 and Arg43. In the resting state, this modification inhibits MAVS aggregation and autoactivation of MAVS. Upon virus infection, PRMT9 dissociates from the mitochondria, leading to the aggregation and activation of MAVS. Our study implicates a form of post-translational modification on MAVS, which can keep MAVS inactive in physiological conditions to maintain innate immune homeostasis.


Conflict of interest statement

The authors declare no competing interests.

Figures

Fig. 1
Fig. 1. PRMT9 negatively regulates RLRs-induced IFN-β production.
a Immunoblot analysis of PRMT9 in Prmt9-knockout RAW264.7 cell lines. b, c qRT-PCR analysis the expression of Ifnb1, Ifna4 or Cxcl10 mRNA in Prmt9-knockout cells with SeV infection or stimulated with 5′-pppRNA (mean ± SD, two-tailed student’s t test was performed, for b, Ifnb1: *p = 0.0351, **p = 0.0049, **p = 0.0032, *p = 0.0160, *p = 0.0385, *p = 0.0149 in sequence; Ifna4: **p = 0.0020, **p = 0.0029, **p = 0.0026, *p = 0.0104, **p = 0.0067, **p = 0.0030 in sequence; Cxcl10: ****P < 0.0001, **p = 0.0024, *p = 0.0380, **p = 0.0019; **p = 0.0012, *p = 0.0192 in sequence. For c, Ifnb1: ***p = 0.0006, *p  = 0.0341, **p = 0.0023, **p = 0.0022, ****P < 0.0001, **p = 0.0033 in sequence; Ifna4: *p = 0.0155, *p = 0.0175, **p = 0.0081, *p = 0.0382, *p = 0.0199, *p = 0.0117 in sequence; Cxcl10: *P = 0.0246, *p = 0.0195, *p = 0.0212, *p = 0.0332, ***p = 0.0002, **p = 0.0043 in sequence; n = 3 independent experiments). d qRT-PCR analysis of Ifnb1 (left), VSV mRNA (middle) and plaque assay of VSV titers (right) in Prmt9-knockout RAW264.7 cells infected with VSV (MOI (multiplicity of infection), 0.1), and (e) Immunoblot analysis of VSV glycoprotein (VSV-G) in lysates of RAW264.7 cell lines infected with VSV for 0-12 h. For the densitometric analysis (right), VSV bands were normalized with individual actin, line graphs were presented relative to the second lane (mean ± SD, two-tailed student’s t-test was performed, for d, Ifnb1: ***p = 0.0004, **p = 0.0044; VSV mRNA: **p = 0.0052, *p = 0.0144; VSV titier: ***p = 0.0006, 0.0009 in sequence. The data shown in e are from one representative experiment of at least 3 biological independent experiments, two-tailed student’s t-test was performed, for e, **p = 0.0062, *p = 0.0209, **p = 0.0024 in sequence). f Immunoblot analysis of Flag-PRMT9 (left) in contrl HEK293T cells and Flag-PRMT9-overexpressing HEK293T cells. qRT-PCR analysis of IFNB1 mRNA in HEK293T cells transfected for 24 h with those plasmids, followed by infection with SeV. g qRT-PCR analysis of IFNB1 mRNA (left) or VSV mRNA (middle), and plaque assay of VSV titers (right) in HEK293T cells transfected with control plasmid (Ctrl) or plasmid expressing Flag-PRMT9 for 24 h, followed by infection with VSV (mean ± SD, two-tailed student’s t-test was performed, for f, ***p = 0.0008, **p = 0.0016 in sequence; for g: **p = 0.0059, 0.0022, 0.0041 in sequence; n = 3 independent experiments). h Microscopy imaging (left) and Flow cytometry analysis (right) of the replication of GFP-VSV in HEK293T cells transfected with control plasmid (Ctrl) or plasmid expressing Flag-PRMT9 for 24 h, stimulated with VSV-GFP for 18 h, bars: 100 μm. The qRT-PCR results are presented relative to those of untreated wild-type cells or transfected with a Vector plasmid (Average of three replicates, bd, f, g). The data shown in a, e, f, and h are from one representative experiment of at least 3 biological independent experiments. Two-tailed Student’s t-test was performed, with *P < 0.05; **P < 0.01; ***P < 0.001; ****P < 0.0001 (bg).
Fig. 2
Fig. 2. PRMT9 deficiency in primary peritoneal macrophages enhances RLRs-triggered IFN-β signaling.
a, b ELISA quantification of IFN-β secretion and (ac) qRT-PCR analysis of Ifnb1, Ifna4, Cxcl10 mRNA in Prmt9CKO and Prmt9WT peritoneal macrophages infected with a SeV or b stimulated with 5′-pppRNA or infected with c HSV-1 (mean ± SD, two-tailed student’s t-test Prmt9CKO vs. Prmt9WT, for a, Ifnb1: ***p = 0.0002, ***p = 0.0004, **p = 0.0052 in sequence; Ifna4: *p = 0.0140, ****p < 0.0001, **p = 0.0088 in sequence; Cxcl10: **p = 0.0078, 0.0076, 0.0017 in sequence; IFN-β: **p = 0.0012, 0.0081, 0.0015 in sequence, n = 3 independent experiments. For b: Ifnb1: **p = 0.0011, ***p = 0.0003, ***p = 0.0008 in sequence; Ifna4: ***p = 0.0002, **p = 0.0020, **p = 0.0034 in sequence; Cxcl10: *p = 0.0139, **p = 0.0013, ***p = 0.0008 in sequence; IFN-β: **p = 0.0034, 0.0024, 0.0024 in sequence, n = 3 independent experiments). d qRT-PCR analysis of Ifnb1 (left), VSV mRNA (middle), plaque assay of VSV titers (right) and immunoblot analysis of VSV-G (far right) in Prmt9CKO and Prmt9WT peritoneal macrophages infected with VSV (MOI, 0.1) for 0–12 h (mean ± SD, two-tailed student’s t-test Prmt9CKO vs. Prmt9WT, ****p < 0.0001, ***p = 0.0005, ****p < 0.0001 in sequence, n = 3 independent experiments). e For the densitometric analysis (right), the values were normalized to actin (mean ± SD, two-tailed t-test Prmt9CKO vs. Prmt9WT, *p = 0.0248, **p = 0.0020, 0.0046 in sequence, n = 3 independent experiments). Line graphs were presented relative to the second lane. The qRT-PCR and ELISA results are presented relative to those of untreated wild-type cells (Average of three replicates, ad). *P < 0.05; **P < 0.01; ***P < 0.001; ****P < 0.0001; ns not significant (two-tailed Student’s t-test).
Fig. 3
Fig. 3. PRMT9 inhibits innate antiviral response in vivo.
ad Eight-week male Prmt9CKO and Prmt9WT mice were infected by tail vein injection with VSV (1.8 × 107 PFU per mouse) for 24 h (n = 6 mice per group). a qRT-PCR analysis of Ifnb1 mRNA in the lung (left, ***p = 0.0009), liver (middle, **p = 0.0059), and spleen (middle, *p = 0.0119). b ELISA analysis of IFN-β protein in serum, ***p = 0.0002. Plaque assay of VSV titers (c) and qRT-PCR analysis of VSV mRNA (d) in lung (left, ***p = 0.0001), liver (middle, ***p  = 0.0005) and spleen (right, ***p = 0.0028). e, f Survival of Prmt9CKO and Prmt9WT mice (n = 12 mice per group, 6–8 weeks old) after tail vein injection with VSV (1 × 108 PFU per mouse) or HSV-1 (1.5 × 108 PFU per mouse). e: *p = 0.0133, f: ns = 0.7923. g Hematoxylin-eosin staining of lung sections were presented, treated as in a (n = 6 mice per group). Scale bar, 50 μm. Inflammation scores of lung tissue sections described in g (*p = 0.0106). The qRT-PCR and ELISA results are presented relative to those of untreated wild-type tissue cells (a, b and d). Data are shown as mean ± SD (ag) and are representative of three independent experiments with similar results. *P < 0.05; **P < 0.01; ***P < 0.001 (two-tailed student’s t-test in ad, g or the log-rank Mantel-Cox test in e, f).
Fig. 4
Fig. 4. PRMT9 negatively regulates MAVS-mediated signaling.
a Immunoblot analysis of total and phosphorylated (p-) TBK1, total and phosphorylated (p-) IRF3, total and phosphorylated (p-) IκBα in lysates of HEK293T cells transfected with control vector or Flag-PRMT9 infected with SeV for 0–8 h. c, e Immunoblot analysis of total and p-TBK1, total and p-IRF3, total and p-IκBα in Prmt9CKO and Prmt9WT peritoneal macrophages cells, followed by infection with SeV or HSV-1 for 0-8 h. b, d and f Densitometric analysis of protein expression levels was quantitated by“ImageJ” software. Ratio: p-TBK1/TBK1, p-IRF3/IRF3 or p-IκBα/ IκBα, bar graphs are presented relative to the second lane. Data are represented as mean ± SD (two-tailed student’s t-test was performed, for b, left panel: *p = 0.0132, 0.0354 in sequence, middle panel: *p = 0.0232, 0.0278 in sequence, right panel: **p = 0.0082, 0.0010 in sequence; for d, left panel: **p = 0.0044, *p = 0.0126 in sequence, middle panel: *p = 0.0129, **p = 0.0061 in sequence, right panel: *p = 0.0486, **p = 0.0041 in sequence; n = 3 independent experiments). g Immunoblot analysis of IRF3 in cytoplasmic (Cyt) and nuclear (Nuc) in Prmt9CKO and Prmt9WT peritoneal macrophages cells infections with SeV for 0–8 h. h Densitometric analysis of protein expression levels, bands were normalized with individual actin or PCNA, bar graphs are presented relative to the lane 1. Data are represented as mean ± SD (two-tailed student’s t-test Prmt9WT vs. Prmt9CKO, left panel: **p = 0.0095, *p = 0.0297, 0.0176 in sequence, right panel: ***p = 0.0005, *p = 0.0341, 0.0476 in sequence; n = 3 independent experiments). i Confocal microscopic images of IRF3 (Red) in HEK293T cells transfected with control vector or Flag-PRMT9 (Green) infected with SeV for 0–8 h, Scale bar, 10 μm, ***p = 0.0008. *P < 0.05; **P < 0.01; ***P < 0.001; ns, not significant (two-tailed student’s t-test). Similar results were obtained from three independent experiments.
Fig. 5
Fig. 5. PRMT9 targets MAVS.
a Luciferase (Lucif) activity assays of IFN-β reporter in HEK293T cells transfected with expression plasmids for cGAS-STING, RIG-IN, MDA5, MAVS, TBK1, or IRF3-5D along with Flag-PRMT9 or control vector (Ctrl) for 24 h (mean ± SD, two-tailed student’s t-test Flag-PRMT9 vs. Ctrl Vector, ns = 0.0959, ****p < 0.0001, ****p < 0.0001, ****p < 0.0001, ns = 0.5018, ns = 0.5552 in sequence; n = 3 independent experiments). b qRT-PCR analysis of IFNB1 mRNA in HEK293T cells transfected with the indicated adaptors with Flag-PRMT9 or control vector (mean ± SD, two-tailed student’s t-test Flag-PRMT9 vs. Ctrl Vector, *p = 0.0446, ***p = 0.0008, **p = 0.0018, ns = 0.8231, ns = 0.1474 in sequence; n = 3 independent experiments). a, b Results are presented relative to those of untreated cells transfected with a Vector plasmid. c Co-IP analysis of the interaction between PRMT9 and adaptors in HEK293T cells cotransfected with GFP-PRMT9 and HA-cGAS, HA-RIG-I, HA-MAVS, HA-TBKI, Myc-MDA5 or Myc-IRF3 in HEK293T cells plasimds. d In vitro analysis of the interaction between PRMT9 and MAVS, using recombinant protein GST-PRMT9 and His-MAVS incubated in vitro. e Confocal analysis of the colocalization of Myc-MAVS (Red) and GFP-PRMT9 (Green) in HEK293T cells cotransfected for 24 h. Scale bars: 5 μm. Intensity profiles of each line was quantified by ImageJ software and drawn by GraphPad Prism 7.0. Myc-MAVS - GFP-PRMT9 colocalization was also quantified using Pearson’s correlation coefficient method and scatter map. f Co-IP analysis of the interaction between PRMT9 and MAVS in mouse peritoneal macrophages infected with SeV for 0–12 h. Densitometric analysis of protein expression levels, bands were normalized with individual actin, line graphs are presented relative to the first lane. *P < 0.05; **P < 0.01; ***P < 0.001; ns, not significant (Two-tailed Student’s t-test). Similar results were obtained from three independent experiments.
Fig. 6
Fig. 6. PRMT9 catalyzed the arginine methylation of MAVS on R41 and R43.
af Co-IP analysis of the methylation of MAVS. a In HEK293T cells cotransfected with GFP-PRMT9 and HA-MAVS or SAP145 (as positive control). b In peritoneal macrophages infected with SeV for 0–12 h, and c in Prmt9CKO and Prmt9WT peritoneal macrophages cells. d Co-IP analysis of the SDMA of MAVS in MAVS–/– HEK293T cells cotransfected with HA-MAVS and GFP-PRMT9 (WT) or PRMT9 (G260E) for 24 h, followed by infection with SeV for 8 h. e Co-IP analysis of the methylation of MAVS in Prmt9CKO and Prmt9WT peritoneal macrophages cells reconstituted with empty vector (− or Vec) or plasmids expressing GFP-tagged mouse PRMT9 (WT) or mouse PRMT9 (G260E). f PRMT9 methylates MAVS directly. The in vitro MAVS methylation assay was performed by using recombinant GST-PRMT9 and His-MAVS proteins in the presence of SAM or not. g Mass spectrometry profile of methylated MAVS-R41, R43 sites. h Co-IP analysis of of SDMA of MAVS in MAVS–/– HEK293T cells cotransfected with HA-MAVS (WT) or HA-MAVS (R41K), HA-MAVS (R43K), HA-MAVS (R41, 43K) in the presence of GFP-PRMT9 expression plasmids. i In vitro MAVS methylation assay using recombinant GST-PRMT9, His-MAVS and His-MAVS muntans proteins the presence of PRMT9 or not. j PRMT9 methylates MAVS at R41/43 in vitro. The scintillation counting assay was performed by using purifed GST-PRMT9, His-MAVS (WT), His-MAVS (R41K), His-MAVS (R43K), His-MAVS (R41K, R43K). Methyltransferase activity was monitored by the transfer of 3H-methyl (3H-Me) from S-[3H-Me] adenosylmethionine to recombinant protein substrates. After exposure at 30 °C for the indicated time, Reaction mixtures were spotted onto Whatman 3 mm cellulose filter paper discs for analyzing. The data are representive of three independent experiments with similar results (af, h, i) or are from three independent experiments (mean of triplicate assays j, ****P < 0.0001, two-way ANOVA).
Fig. 7
Fig. 7. PRMT9-mediated MAVS methylation inhibits MAVS aggregation and activation.
a SDD-AGE analysis (top) and SDS-PAGE (below) of the aggregation of MAVS in HEK293T cells cotransfected with HA-MAVS, GFP-PRMT9 and PRMT9 (G260E). b SDD-AGE and SDS-PAGE analysis of the aggregation of MAVS in Prmt9CKO and Prmt9WT peritoneal macrophages cells infected with SeV for 0–8 h. c SDD-AGE and SDS-PAGE analysis of the aggregation of MAVS in Prmt9CKO and Prmt9WT cells reconstituted with empty vector (− or Vec) or mPRMT9 (WT) or mPRMT9 (G260E) infected with SeV for 8 h. d qRT-PCR analysis of Ifnb1 mRNA in Prmt9CKO and Prmt9WT reconstituted with empty vector or mPRMT9 (WT) or mPRMT9 (G260E) infected with SeV or VSV for 8 h, mRNA results are presented relative to those of untreated cells transfected with a Vector plasmid (Average of three replicates), left panel: *P = 0.0130, #P = 0.0241, ns = 0.6343 in sequence; right panel: *P = 0.0105, ##P = 0.0070, ns = 0.4865 in sequence. e Co-IP analysis of SDMA of MAVS in MAVS–/– HEK293T cells cotransfected with HA-MAVS (WT) or HA-MAVS (R41K, R43K) in the presence of GFP-PRMT9 expression plasmid. f SDD-AGE and SDS-PAGE analysis of the aggregation of MAVS in MAVS–/– HEK293T cells transfected with HA-MAVS (WT) or HA-MAVS (R41K, R43K) in the presence of GFP-PRMT9 expression plasmid infected with SeV for 8 h. g qRT-PCR analysis of IFNB (*P = 0.0224, ns = 0.4906 in sequence), IFNA4 (***P = 0.0006, ns = 0.5296 in sequence) and CXCL10 (**P = 0.0043, ns = 0.3199 in sequence) mRNA treated as in f, mRNA results are presented as in d. h SDD-AGE and SDS-PAGE analysis of the aggregation of MAVS with the crude mitochondrial extracts prepared from MAVS–/– HEK293T cell after HA-MAVS and HA-MAVS (R41K, R43K) transfection, followed by incubation in the in vitro aggregation buffer with E1, 5’ppp RNA, GST-PRMT9 and ubiquitin. qRT-PCR data in d, g represent the mean ± SD (n = 3 independent experiments). The data shown in ac and eh are from one representative experiment of at least 3 biological independent experiments. *P < 0.05, **P < 0.01, #P < 0.05, ##P < 0.01, ns, not significant (Two-tailed Student’s t-test).

References

    1. Trinchieri G. Type I interferon: Friend or foe? J. Exp. Med. 2010;207:2053–2063. doi: 10.1084/jem.20101664. - DOI - PMC - PubMed
    1. McNab F, et al. Type I interferons in infectious disease. Nat. Rev. Immunol. 2015;15:87–103. doi: 10.1038/nri3787. - DOI - PMC - PubMed
    1. Smith PL, Lombardi G, Foster GR. Type I interferons and the innate immune response-more than just antiviral cytokines. Mol. Immunol. 2005;42:869–877. doi: 10.1016/j.molimm.2004.11.008. - DOI - PubMed
    1. Yoneyama M, et al. Shared and unique functions of the DExD/H-box helicases RIG-I, MDA5, and LGP2 in antiviral innate immunity. J. Immunol. 2005;175:2851–2858. doi: 10.4049/jimmunol.175.5.2851. - DOI - PubMed
    1. Yoneyama M, et al. The RNA helicase RIG-I has an essential function in double-stranded RNA-induced innate antiviral responses. Nat. Immunol. 2004;5:730–737. doi: 10.1038/ni1087. - DOI - PubMed

Publication types

MeSH terms

Substances