. 2022 Aug 26;13(1):5034.
doi: 10.1038/s41467-022-32568-7.

AMPK deficiency in smooth muscles causes persistent pulmonary hypertension of the new-born and premature death

Affiliations

AMPK deficiency in smooth muscles causes persistent pulmonary hypertension of the new-born and premature death

Javier Moral-Sanz et al. Nat Commun. .

Abstract

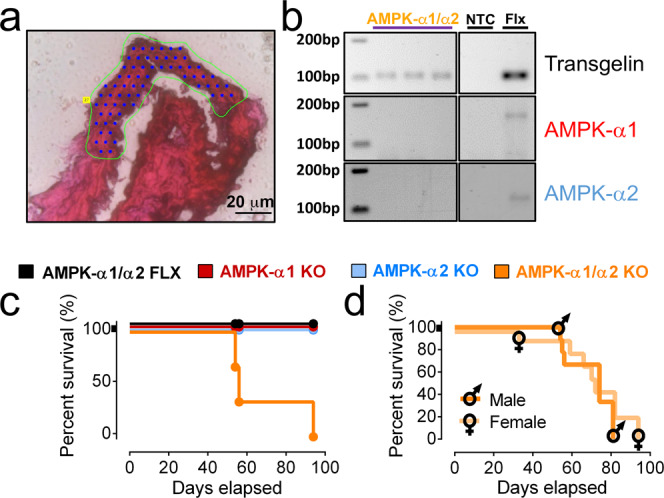
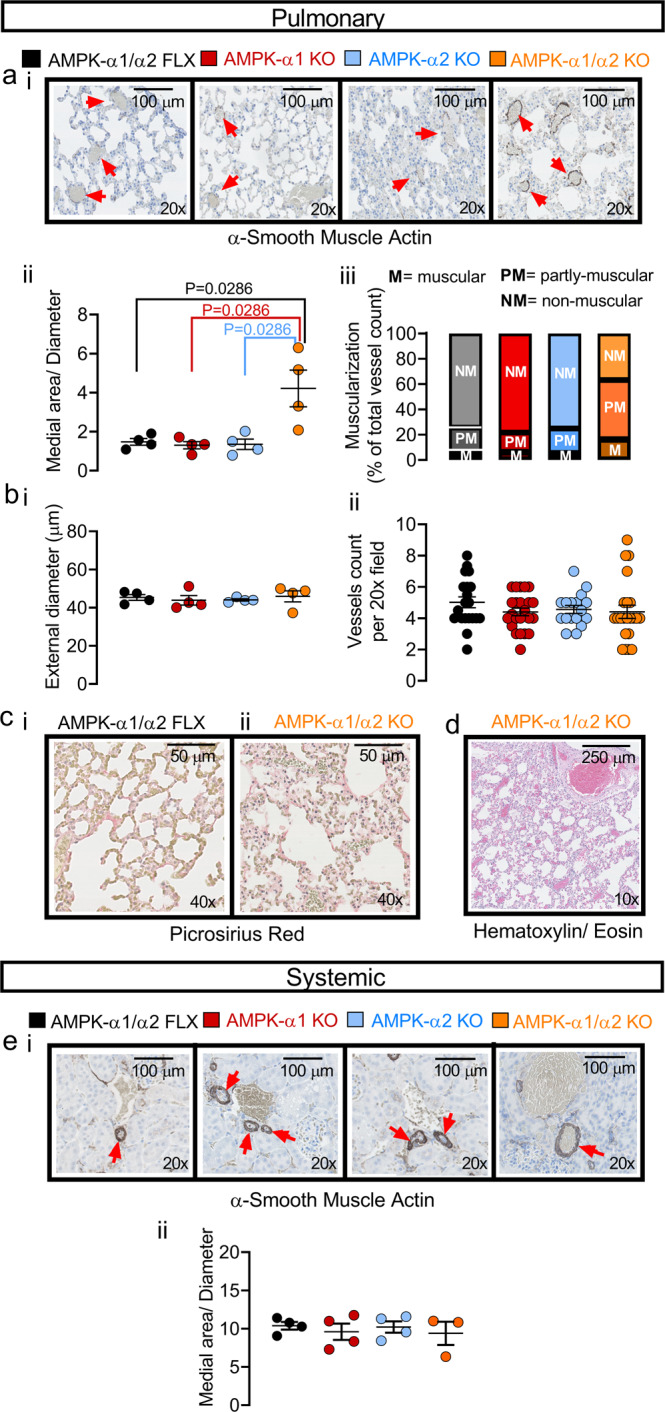
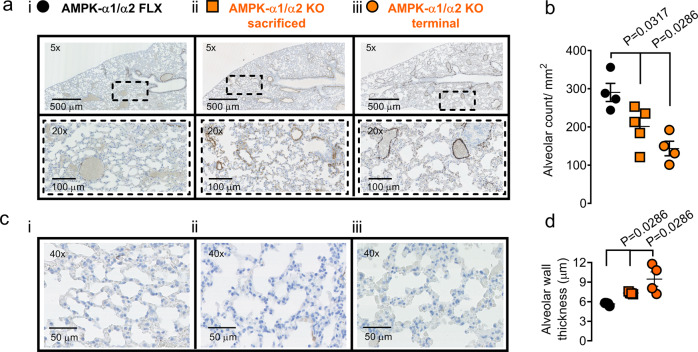
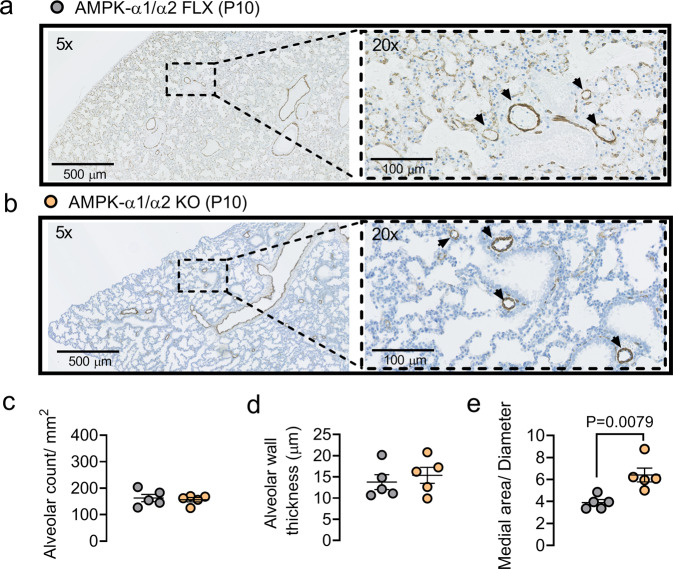
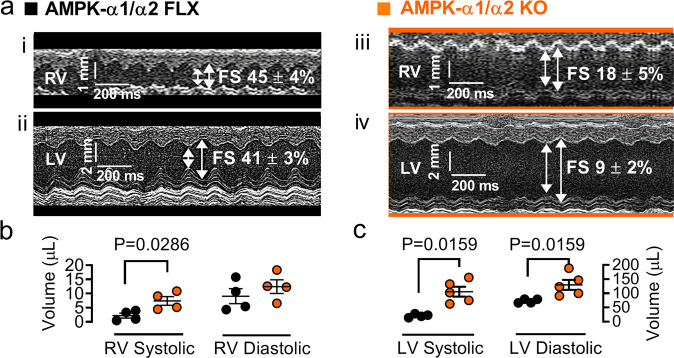
AMPK has been reported to facilitate hypoxic pulmonary vasoconstriction but, paradoxically, its deficiency precipitates pulmonary hypertension. Here we show that AMPK-α1/α2 deficiency in smooth muscles promotes persistent pulmonary hypertension of the new-born. Accordingly, dual AMPK-α1/α2 deletion in smooth muscles causes premature death of mice after birth, associated with increased muscularisation and remodeling throughout the pulmonary arterial tree, reduced alveolar numbers and alveolar membrane thickening, but with no oedema. Spectral Doppler ultrasound indicates pulmonary hypertension and attenuated hypoxic pulmonary vasoconstriction. Age-dependent right ventricular pressure elevation, dilation and reduced cardiac output was also evident. KV1.5 potassium currents of pulmonary arterial myocytes were markedly smaller under normoxia, which is known to facilitate pulmonary hypertension. Mitochondrial fragmentation and reactive oxygen species accumulation was also evident. Importantly, there was no evidence of systemic vasculopathy or hypertension in these mice. Moreover, hypoxic pulmonary vasoconstriction was attenuated by AMPK-α1 or AMPK-α2 deletion without triggering pulmonary hypertension.


Conflict of interest statement

The authors declare no competing interests.

Figures

Fig. 1
Fig. 1. AMPK-α1/α2 deletion precipitates premature death.
a Exemplar image of a section of pulmonary arterial media excised by laser microdissection. b Exemplar gels for quantitative RT-PCR amplicons for transgelin, AMPK-α1 and AMPK-α2 taken from sections of the medial layer excised from pulmonary arterial sections from AMPK-α1/α2 double knockout (KO) and AMPK-α1/α2 floxed (FLX) mice by laser microdissection. NTC negative template control (eluate from the RNA extraction for which no sample material was added). c Kaplan–Meyer curves for AMPK-α1/α2 FLX (black n = 4, 2 males and 2 females), AMPK-α1 knockouts (AMPK-α1 KO; red, n = 6, 3 males and 3 females), AMPK-α2 knockouts (AMPK-α2 KO; blue, n = 7, 2 males and 5 females) and AMPK-α1/α2 KO (orange, n = 4, 2 males and 2 females). d Retrospective analysis comparing survival rates for AMPK-α1/α2 KO males (n = 6) and females (n = 10).
Fig. 2
Fig. 2. AMPK-α1/α2 deletion precipitated remodeling of the heart.
a Representative sub-gross images of heart slices from terminal samples stained with Hematoxylin–Eosin (left) and a higher magnification image showing the right aspect of the septal myocardium including right ventricular endocardium stained with Masson’s trichrome (right) for (i) AMPK-α1/α2 floxed (AMPK-α1/α2 FLX) and (ii) AMPK-α1/α2 knockouts (AMPK-α1/α2 KO). b Scatter plots show the (i) Fulton index [RV/(LV + S) ratio], (ii) right ventricular weight relative to body weight ratio (RV/BW), and (iii) left ventricular plus septum weight to body weight ratio (LV + S/BW) and (iv) fibrosis of the right ventricle for AMPK-α1/α2 floxed (n = 10 fields of view per mouse from n = 4 mice) and AMPK-α1/α2 KO (n = 13 fields of view per mouse from n = 3 mice). Data are expressed as mean ± SEM. Statistical significance was assessed by two-sided unpaired Student’s t test.
Fig. 3
Fig. 3. AMPK-α1/α2 deletion precipitated remodeling of pulmonary arterial but not systemic arterial system.
a Representative images of lung slices from terminal samples stained for (i) α-smooth muscle actin, together with scatter plots of (ii) medial area corrected by diameter and (iii) degree of muscularisation for all pulmonary arteries analysed for AMPK-α1/α2 knockouts (AMPK-α1/α2 KO; n = 4 mice, average of 22–39 arteries per mouse, 7 fields per mouse) after death at 7–10 weeks, and age-matched AMPK-α1/α2 floxed (AMPK-α1/α2 FLX, n = 4 mice, average of 30–39 arteries per mouse, 7 fields per mouse), AMPK-α1 KO (n = 4 mice, average of 25–37 arteries per mouse, 7 fields per mouse) and AMPK-α2 KO (n = 4 mice, average of 30–39 arteries per mouse, 7 fields per mouse). b Scatter plots show the mean ± SEM for the (i) external diameter (n = 4 mice per genotype) and (ii) number of vessels found per 20x field for the analysis shown in (a) (n = 28 fields from n = 4 mice per genotype, 7 fields per mouse). Images of (c) picrosirius red staining and (d) Hematoxylin–Eosin staining of lung slices show the absence of parenchymal/alveolar remodeling and the lack of lung oedema, respectively. e (i) representative images of renal slices stained for α-smooth muscle actin, together with (ii) plots of the medial area corrected by diameter analysed for AMPK-α1/α2 KOs (n = 4 mice, average of 20–34 arteries per mouse, 4 fields per mouse) and age-matched AMPK-α1/α2 floxed (n = 4 mice, average of 17–30 arteries per mouse, 4 fields per mouse), AMPK-α1 KOs (n = 4 mice, average of 16–30 arteries per mouse, 4 fields per mouse) and AMPK-α2 KOs (n = 3 mice, average of 25–28 arteries per mouse, 7 fields per mouse). For clarity, only mean values are presented in panel aiii. The rest of the panels are expressed as mean ± SEM. Statistical significance was assessed by two-sided unpaired Mann–Whitney’s test (aii, bi-ii, eii) or a Friedman test with Dunn’s correction for multiple comparisons (aiii).
Fig. 4
Fig. 4. AMPK-α1/α2 deletion reduces alveolar number and precipitates thickening of alveolar walls.
a Representative images of alveoli in lung slices from terminal samples stained for α-smooth muscle actin. b Scatter plot shows alveolar number per mm2 for terminal (n = 4 mice) and non-terminal (n = 5 mice) samples of AMPK-α1/α2 knockouts (AMPK-α1/α2 KO) vs age-matched AMPK-α1/α2 floxed controls (AMPK-α1/α2 FLX; n = 4 mice). The analysis in (b) was averaged from 2 mm2 area per mouse. c Representative images of alveoli in lung slices from terminal samples stained for α-smooth muscle actin. d Scatter plot shows alveolar wall thickness for terminal (n = 4) and non-terminal (n = 4) samples of AMPK-α1/α2 KO vs age-matched AMPK-α1/α2 FLX (n = 4). The analysis in d was averaged from 60–70 septa per mouse. Data are expressed as mean ± SEM. Statistical significance was assessed by two- sided unpaired Mann–Whitney’s test.
Fig. 5
Fig. 5. In neonatal lungs AMPK-α1/α2 deletion has no effect on alveolar number or wall thickness but increases medial thickness of pulmonary arteries.
Representative images of alveoli in lung slices from non-terminal samples stained for α-smooth muscle actin from (a) age-matched AMPK-α1/α2 floxed (AMPK-α1/α2 FLX) controls and (b) AMPK-α1/α2 KOs. Scatter plots show (c) alveolar number per mm2 (n = 5 mice per genotype, averaged from 2 mm2 area per mouse), (d) alveolar wall thickness (n = 5 mice per genotype, averaged from 70–90 septa per mouse) and (e) medial thickness of pulmonary arteries for non-terminal samples of AMPK-α1/α2 KO (orange, n = 5 mice, n = 4 fields, averaged from 16–25 arteries per mouse) vs age-matched AMPK-α1/α2 FLX (gray, n = 5 mice, n = 4 fields, averaged from 16-22 arteries per mouse). Data are expressed as mean ± SEM. Statistical significance was assessed by two-sided unpaired Mann–Whitney’s test.
Fig. 6
Fig. 6. AMPK-α1/α2 deletion increased pulmonary vascular resistance and attenuated hypoxic pulmonary vasoconstriction after birth.
a i-ii Upper panels show representative spectral Doppler peak systolic velocities versus time within the main pulmonary artery of (i) AMPK-α1/α2 floxed (FLX) and (ii) AMPK-α1/α2 KO mice during normoxia, hypoxia (8% O2) and recovery; lower panels show example records of Doppler velocity during normoxia, hypoxia (shaded green) and recovery. Scatter plots show the mean ± SEM for the (iii) basal peak velocity under normoxia for AMPK-α1/α2 FLX (n = 13 mice) and AMPK-α1/α2 KO (n = 10 mice) and (iv) the maximum change in peak velocity observed during 8% O2 for AMPK-α1/α2 FLX (n = 7 mice) and AMPK-α1/α2 KO mice (n = 4 mice). b Graphs illustrate age-dependent changes in right ventricular systolic (S) and diastolic (D) pressures for (i) AMPK-α1/α2 floxed and (ii) AMPK-α1/α2 KO mice (different weeks identified by different shades of gray). Scatter plots show values of right ventricular (iii) systolic and (iv) diastolic pressures for AMPK-α1/α2 FLX (n = 9) and AMPK-α1/α2 KO (n = 5). c Representative images of lung slices stained with Hematoxylin–Eosin, showing an intralobar artery (left), medium sized pulmonary artery (middle) and arteriole (right) for (i) AMPK-α1/α2 FLX (n = 9) and (ii) AMPK-α1/α2 KO euthanised at ~80 days (n = 5). Data are expressed as mean ± SEM and statistical significance was assessed by two- sided unpaired Student’s t test (aiii) and two- sided unpaired Mann–Whitney’s test (aiv, biii-iv).
Fig. 7
Fig. 7. AMPK-α1/α2 deletion precipitated reduced right and left ventricular shortening and volumes.
a i-iv Spectral Doppler parasternal long axes obtained using M-mode analysis of the (i and iii) right ventricle (RV), (ii and iv) left ventricle (LV). Dot plots show associated measures of (b) RV and (c) LV volumes for AMPK-α1/α2 floxed controls (AMPK-α1/α2 FLX, n = 4 mice) and AMPK-α1/α2 knockout (AMPK-α1/α2 KO, n = 4 mice for RV volumes and n = 5 mice for LV volumes). Data are expressed as mean ± SEM. Statistical significance was assessed by two-sided unpaired Mann–Whitney’s test.
Fig. 8
Fig. 8. AMPK-α1/α2 deletion in smooth muscles had little or no effect on systemic arterial blood pressures.
Dot plots show mean ± SEM for systolic, diastolic and mean systemic arterial blood pressures under resting conditions for AMPK-α1/α2 floxed (AMPK-α1/α2 FLX, black, n = 4 mice), AMPK-α1 knockout (AMPK-α1 KO, red, n = 4 mice), AMPK-α2 knockout (AMPK-α2 KO, blue, n = 4 mice) and AMPK-α1/α2 knockout (AMPK-α1/α2 KO, orange, n = 4 mice). Statistical significance was assessed by Kruskall Wallis’ test with Dunn’s correction for multiple comparisons.
Fig. 9
Fig. 9. AMPK-α1/α2 deletion reduces KV1.5 current density in pulmonary arterial myocytes.
a Panels show example records for KV currents recorded during control conditions and following extracellular application of 1 µM DPO-1 in acutely isolated pulmonary arterial myocytes from (i) AMPK-α1/α2 floxed (AMPK-α1/α2 FLX) and (ii) AMPK-α1/α2 knockouts (AMPK-α1/α2 KO). b Comparison of current-voltage relationship for KV currents recorded in pulmonary arterial myocytes from AMPK-α1/α2 FLX (n = 4 cells, from n = 4 mice) and AMPK-α1/α2 KO mice (n = 5 cells from n = 4 mice) under control (normoxic) conditions and after extracellular application of 1µmol/L DPO-1. c Current-voltage relationship for DPO-1-sensitive current (current before DPO-1 minus current after DPO-1) for the experiments shown in (b). d Panels show example records for K+ currents in HEK293 cells transfected with (i) KCNA5 wild type (WT) or (ii) KCNA5 containing S559A + S592A dephospho-mimetic mutation at identified AMPK phosphorylation sites. d iii Comparison of current-voltage relationship for KV1.5 currents recorded in HEK 293 cells transfected with KCNA5 WT (n = 16 cells from n = 5 independent transfections) or S559A + S592A dephospho-mimetic KCNA5 mutant (n = 17 cells from n = 5 independent transfections paired with WT). Data are expressed as mean ± SEM. Statistical significance was assessed by two-sided paired (b) and two-sided unpaired Student’s t test (c and d iii). P values in (b) for AMPK-α1/α2 FLX vs AMPK-α1/α2 FLX + DPO-1: −20mV, * = 0.0225; −10mV, * = 0.0113; 0 mV, * = 0.0133; 10 mV, * = 0.0176; 20 mV, * = 0.0179; 30 mV, * = 0.0185; 40 mV, * = 0.0115. P values in (b) for AMPK-α1/α2 KO vs AMPK-α1/α2 KO + DPO-1: −20mV, * = 0.0291; −10mV, * = 0.0429; 0 mV, * = 0.0194; 10 mV, * = 0.0393; 20 mV, * = 0.0167; 30 mV, * = 0.0233; 40 mV, * = 0.0192. P values in (c) for AMPK-α1/α2 FLX vs AMPK-α1/α2 KO: 0 mV, * = 0.0133; 10 mV, * = 0.0117; 20 mV, * = 0.0219; 30 mV, * = 0.0850; 40 mV, ** = 0.0095. P values in diii for KCNA5 WT vs KCNA5. S559A + S592A: 10 mV; * = 0.0492; 20 mV, * = 0.0483; 30 mV, * = 0.0496; 40 mV, * = 0.045.
Fig. 10
Fig. 10. AMPK-α1/α2 deletion precipitates mitochondrial dysfunction and reactive oxygen species accumulation in pulmonary arterial myocytes.
a Images show from left to right a bright-field image of a pulmonary arterial myocyte, then deconvolved 3D reconstructions of a z-stack of images of MitoTracker Green fluorescence, TMRE fluorescence and a merged image from (i) AMPK-α1/α2 floxed (AMPK-α1/α2 FLX) and (ii) AMPK-α1/α2 knockouts (AMPK-α1/α2 KO). a iii Scatter plot shows the mean ± SEM for total (non-deconvolved) TMRE fluorescence (n = 26 cells for AMPK-α1/α2 FLX from 8 independent experiments, n = 3 mice; n = 54 cells for AMPK-α1/α2 KO from 13 independent experiments, n = 3 mice). b i-ii As in A but showing images of MitoTracker Red and Rhodamine 123 fluorescence. b iii, Scatter plot shows the mean ± SEM for total (non-deconvolved) Rhodamine 123 fluorescence (n = 41 cells for AMPK-α1/α2 FLX from 10 independent experiments, n = 5 mice; n = 20 cells for AMPK-α1/α2 KO from 6 independent experiments, n = 3 mice). c Records of Rhodamine 123 fluorescence ratio (F/F0) against time recorded in pulmonary arterial myocytes from (i) AMPK-α1/α2 floxed, (ii) AMPK-α1/α2 KO mice, and (iii) a scatter plot showing the mean ± SEM for the maximum change in Rhodamine 123 fluorescence during application of a mitochondrial uncoupler, FCCP (10 μmol/L; n = 10 cells for AMPK-α1/α2 FLX from 5 independent experiments, n = 3 mice; n = 6 cells for AMPK-α1/α2 KO from 4 independent experiments, n = 3 mice). d i-ii As in (a) but showing images of MitoTracker Green and MitoSOX fluorescence. d iii, Scatter plot shows the mean ± SEM for total (non-deconvolved) MitoSOX fluorescence (n = 24 cells for AMPK-α1/α2 FLX from 5 independent experiments, n = 2 mice; n = 15 cells for AMPK-α1/α2 KO from 4 independent experiments, n = 2 mice). e Images of z-sections and 3D reconstruction for the mitochondrial clusters detected in the cells shown in (a), from (i) AMPK-α1/α2 floxed and (ii) AMPK-α1/α2 KO, together with a (iii) frequency histogram (bin centre = 2, mean value indicated by dotted line) for the values shown in (e iv) and (iv) scatter plot for cluster detection (n = 25 cells for AMPK-α1/α2 FLX from 7 independent experiments, n = 3 mice; n = 39 for AMPK-α1/α2 KO from 9 independent experiments, n = 4 mice). Data are expressed as mean ± SEM. Statistical significance was assessed by two-sided unpaired Mann–Whitney’s test (a iii, c iii), two-sided unpaired Student’s t test (b iii, d iii, e iv) and extra sum-of squares F-test for Gaussian distributions (e iii).

Similar articles

Cited by

References

    1. Evans AM, et al. Does AMP-activated protein kinase couple inhibition of mitochondrial oxidative phosphorylation by hypoxia to calcium signaling in O2-sensing cells? J. Biol. Chem. 2005;280:41504–41511. doi: 10.1074/jbc.M510040200. - DOI - PubMed
    1. Moral-Sanz J, et al. The LKB1-AMPK-alpha1 signaling pathway triggers hypoxic pulmonary vasoconstriction downstream of mitochondria. Sci. Signal. 2018;11:eaau0296. doi: 10.1126/scisignal.aau0296. - DOI - PubMed
    1. Moral-Sanz J, et al. AMP-activated protein kinase inhibits Kv 1.5 channel currents of pulmonary arterial myocytes in response to hypoxia and inhibition of mitochondrial oxidative phosphorylation. J. Physiol. 2016;594:4901–4915. doi: 10.1113/JP272032. - DOI - PMC - PubMed
    1. Sylvester JT, Shimoda LA, Aaronson PI, Ward JP. Hypoxic pulmonary vasoconstriction. Physiol. Rev. 2012;92:367–520. doi: 10.1152/physrev.00041.2010. - DOI - PMC - PubMed
    1. Omura J, et al. Protective roles of endothelial AMP-activated protein kinase against hypoxia-induced pulmonary hypertension in mice. Circ. Res. 2016;119:197–209. doi: 10.1161/CIRCRESAHA.115.308178. - DOI - PubMed

Publication types

Substances