. 2022 Aug 26;10(1):57.
doi: 10.1038/s41413-022-00215-y.

Ammonia promotes the proliferation of bone marrow-derived mesenchymal stem cells by regulating the Akt/mTOR/S6k pathway

Affiliations

Ammonia promotes the proliferation of bone marrow-derived mesenchymal stem cells by regulating the Akt/mTOR/S6k pathway

Yu Liu et al. Bone Res. .

Erratum in

Abstract

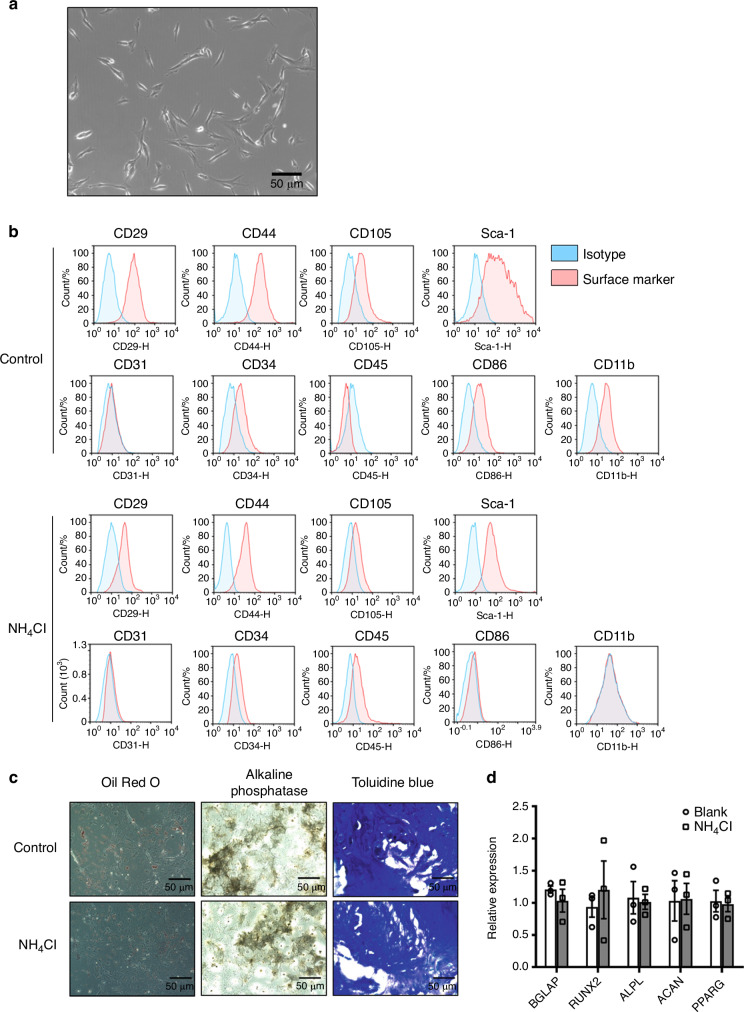
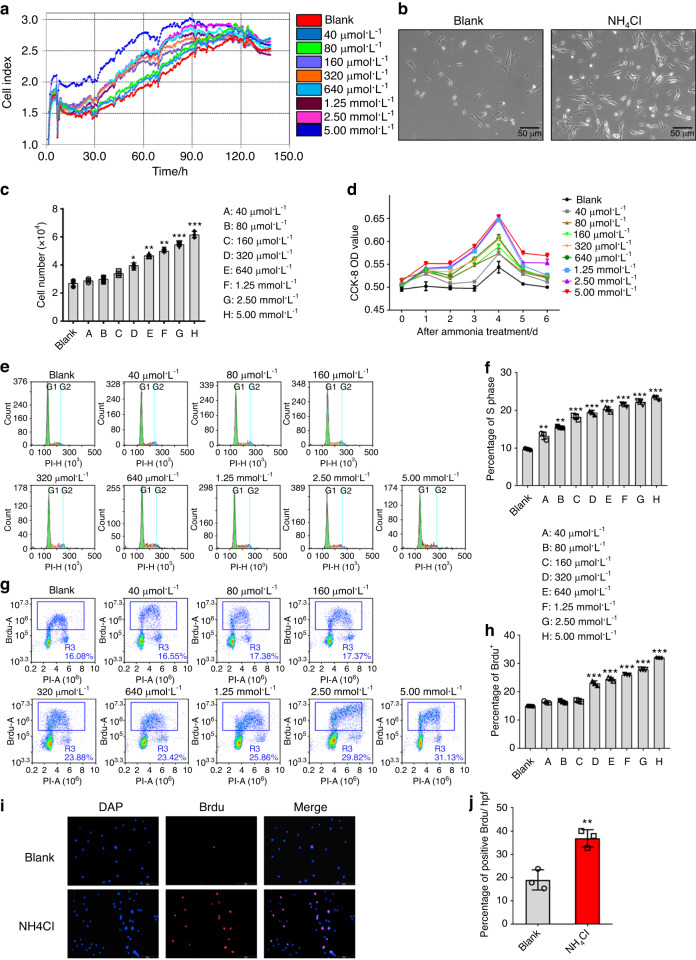
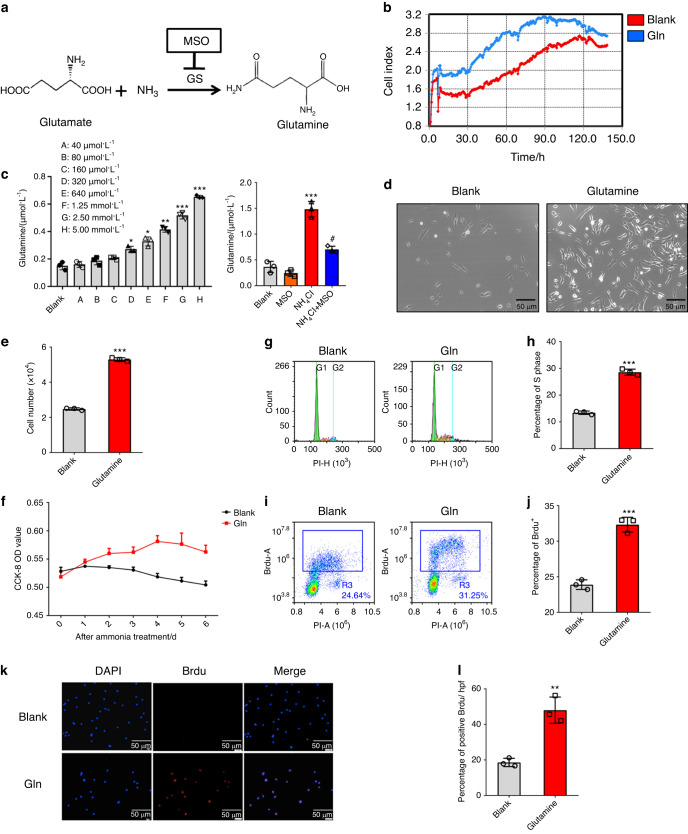
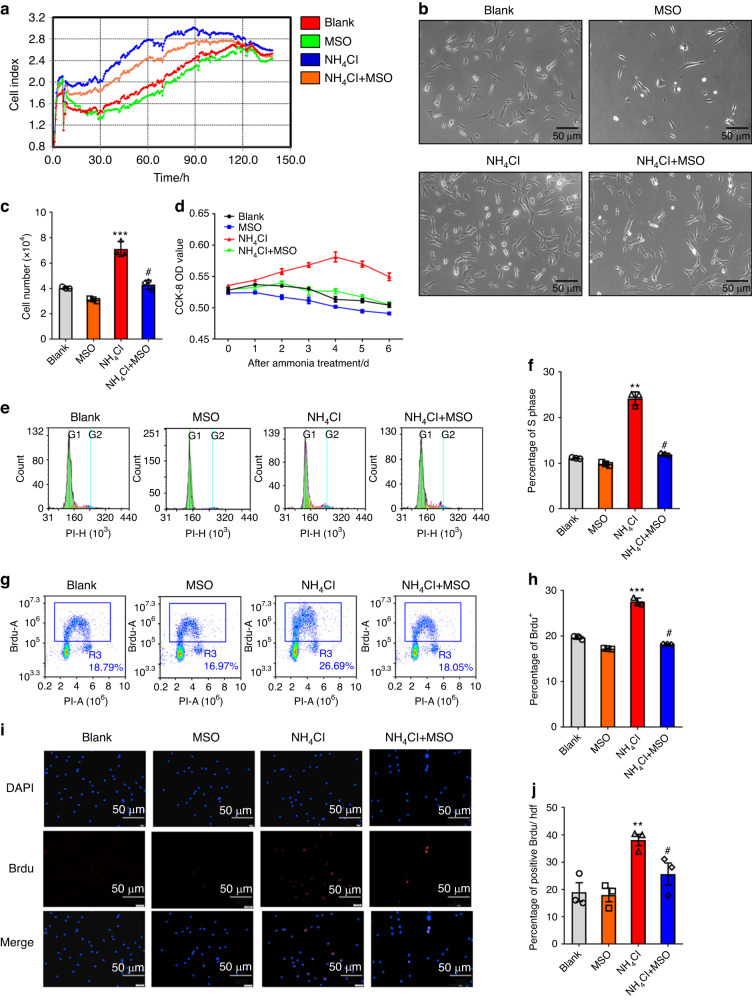
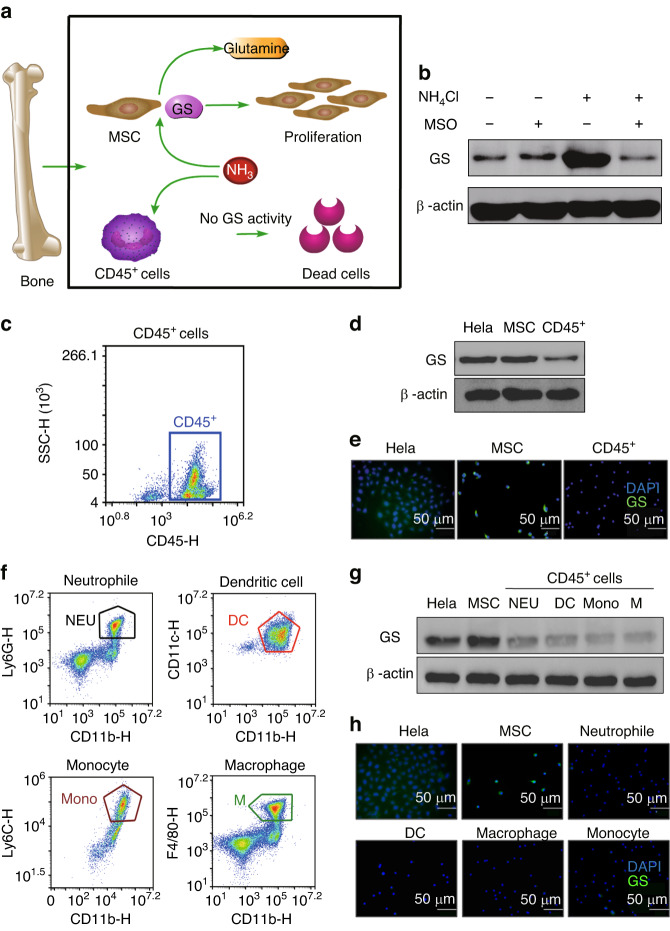
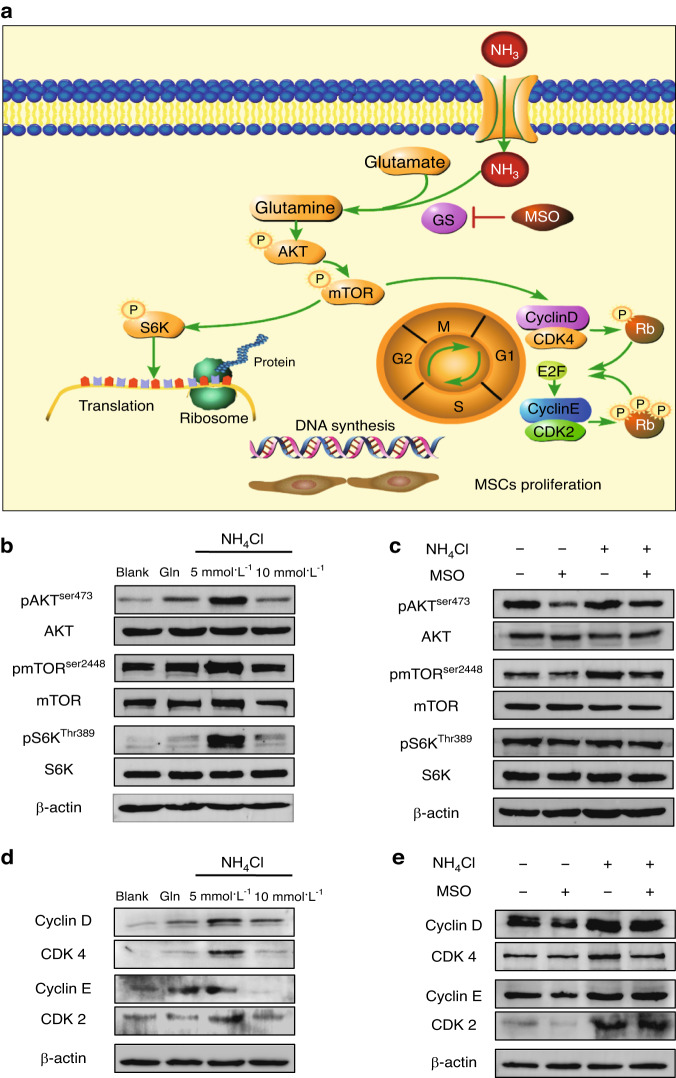
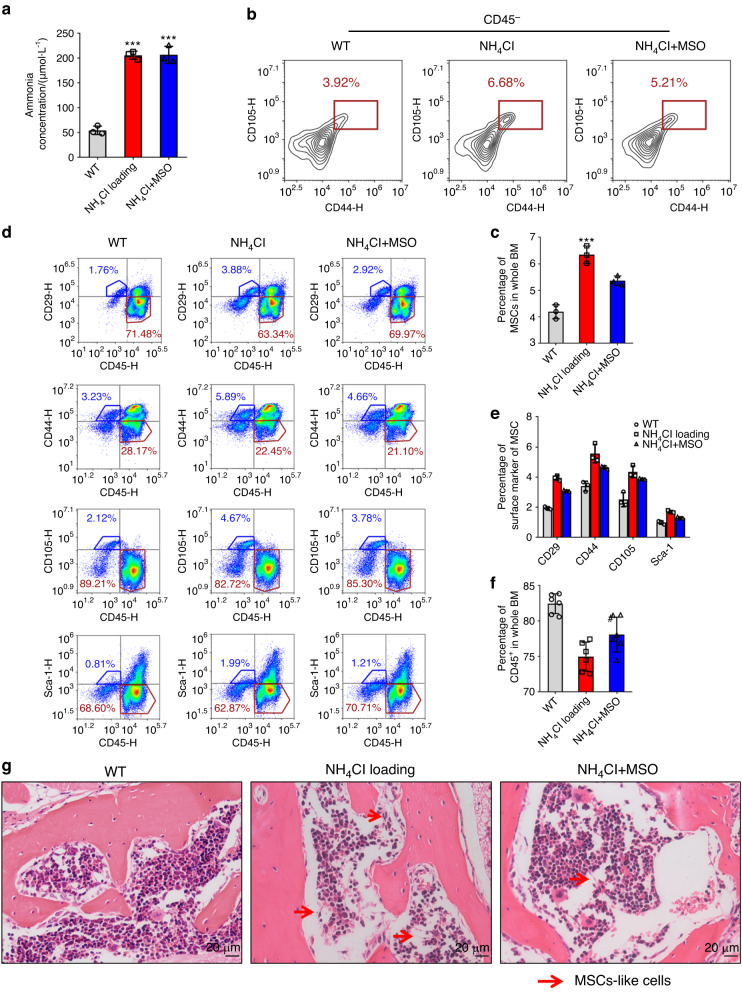
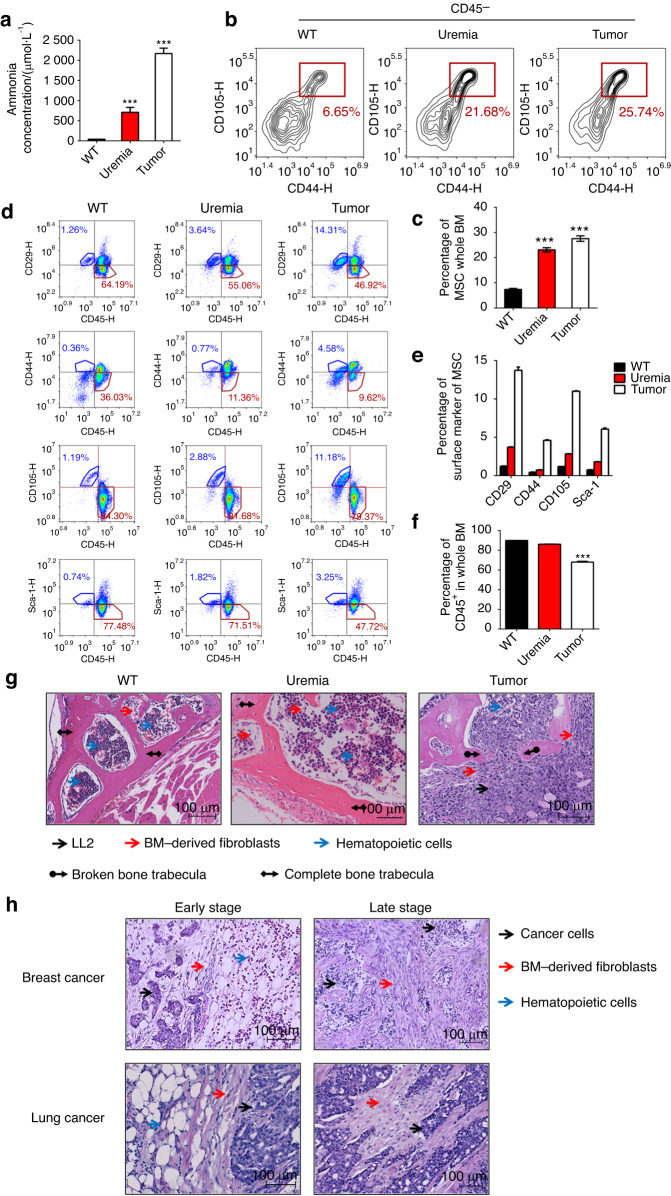
Ammonia plays an important role in cellular metabolism. However, ammonia is considered a toxic product. In bone marrow-derived mesenchymal stem cells, multipotent stem cells with high expression of glutamine synthetase (GS) in bone marrow, ammonia and glutamate can be converted to glutamine via glutamine synthetase activity to support the proliferation of MSCs. As a major nutritional amino acid for biosynthesis, glutamine can activate the Akt/mTOR/S6k pathway to stimulate cell proliferation. The activation of mTOR can promote cell entry into S phase, thereby enhancing DNA synthesis and cell proliferation. Our studies demonstrated that mesenchymal stem cells can convert the toxic waste product ammonia into nutritional glutamine via GS activity. Then, the Akt/mTOR/S6k pathway is activated to promote bone marrow-derived mesenchymal stem cell proliferation. These results suggest a new therapeutic strategy and potential target for the treatment of diseases involving hyperammonemia.


Conflict of interest statement

The authors declare no competing interests.

Figures

Fig. 1
Fig. 1
Isolation and identification of mesenchymal stem cells from mouse bone marrow. a Fibroblast-like or spindle-shaped morphology of mesenchymal stem cells appears at passages 4–6. b Passage 4–6 cells were harvested and stained with positive surface markers of mouse BM-MSCs: CD29, CD44, CD105, and Sca-1 and negative markers: CD31, CD34, CD45, CD86, and CD11b with their corresponding isotype control via FACS analysis. c Adipogenesis of MSCs was observed with oil red O staining, osteoblastogenesis was assayed with in situ alkaline phosphatase staining, and chondrocytic cells were identified with toluidine blue staining. d RT-PCR results showing the relative expression of bglap, runx2, alpl, acan and pparg with or without NH4Cl treatment
Fig. 2
Fig. 2
Ammonia promotes mesenchymal stem cell proliferation. a RTCA (real-time cellular analysis) of different concentrations of NH4Cl (0, 40 µmol·L−1, 80 µmol·L−1, 160 µmol·L−1, 320 µmol·L−1, 640 µmol·L−1, 1.25 mmol·L−1, 2.50 mmol·L−1, 5.00 mmol·L−1, and 10 mmol·L−1). b The growth of MSCs with or without NH4Cl treatment under a microscope after 48 h. c Cell counts after treatment with different concentrations of NH4Cl (0, 40 µmol·L−1, 80 µmol·L−1, 160 µmol·L−1, 320 µmol·L−1, 640 µmol·L−1, 1.25 mmol·L−1, 2.50 mmol·L−1, 5.00 mmol·L−1, and 10 mmol·L−1) after 48 h. d CCK-8 analysis with different concentrations of NH4Cl treatment (0, 40 µmol·L−1, 80 µmol·L−1, 160 µmol·L−1, 320 µmol·L−1, 640 µmol·L−1, 1.25 mmol·L−1, 2.50 mmol·L−1, 5.00 mmol·L−1, and 10 mmol·L−1) lasting 1 week (right). e PI flow cytometry analysis. f The statistical results of the percentage of S phase cells. f BrdU flow cytometry analysis. g The statistical results of the percentage of BrdU+ cells. h Immunofluorescence analysis of BrdU. j The statistical results of BrdU-positive cells/HPF. Values are the mean ± SEM of an experiment performed in triplicate (a two-tailed, paired Student’s t test). *P < 0.05 versus the controls. #P < 0.05 versus the 5 mmol·L−1 NH4Cl treatment group
Fig. 3
Fig. 3
Glutamine promotes mesenchymal stem cell proliferation. a Metabolic pathway of ammonia in GS-expressing MSCs. b RTCA (real-time cellular analysis) with or without glutamine treatment. c Determination of glutamine after NH4Cl treatment (left) and with or without both NH4Cl treatment and MSO treatment (right). d The growth of MSCs with or without glutamine treatment under a microscope. e The results of cell count analysis with or without glutamine treatment. f CCK-8 analysis with or without glutamine treatment lasting 1 week. g PI flow analysis. h The statistical results of the percentage of S phase cells. i BrdU flow analysis. j The statistical results of the percentage of BrdU+ cells. k Immunofluorescence analysis of BrdU. l The statistical results of BrdU+ cells/HPF. Values are the mean ± SEM of an experiment performed in triplicate (one-way analysis of variance). *P < 0.05 versus the controls. #P < 0.05 versus the 5 mmol·L−1 NH4Cl treatment group
Fig. 4
Fig. 4
Inhibition of glutamine synthetase reduces the ammonia-induced proliferation of mesenchymal stem cells. a RTCA (real-time cellular analysis) with or without both NH4Cl treatment or MSO treatment. b The growth of MSCs with or without both NH4Cl treatment and MSO treatment under a microscope. c The cell count results with or without both NH4Cl treatment and MSO treatment. d CCK-8 analysis with or without NH4Cl treatment or MSO treatment after 48 h (left) and lasting 1 week (right). e PI flow analysis. f The statistical results of the percentage of S phase cells. g BrdU flow analysis. h The statistical results of the percentage of BrdU+ cells. i Immunofluorescence analysis of BrdU. j The statistical results of BrdU+ cells/HPF. Values are the mean ± SEM of an experiment performed in triplicate (one-way analysis of variance). *P < 0.05 versus the controls. #P < 0.05 versus the 5 mmol·L−1 NH4Cl treatment group
Fig. 5
Fig. 5
The different effects of ammonia on GS-expressing cells and cells with no expression of GS in bone marrow. a Schematic of the fates of ammonia in the GS-expressing cells or non-GS-expressing cells in bone marrow. b The expression of GS in MSCs with or without both NH4Cl treatment and MSO treatment via western blots. c CD45+ cells from mouse bone marrow sorted by flow cytometry. d The expression of GS analysis between MSCs and CD45+ cells via western blots, with HeLa cells as a positive control. e The expression of GS in MSCs and CD45+ cells via immunofluorescence, with HeLa cells as a positive control. f CD45+ cells, including neutrophils (CD45+ CD11b+ Ly6G+), DCs (CD45+ CD11b+ CD11c+), monocytes (CD45+ CD11b+ Ly6C+) and macrophages (CD45+ CD11b+ F4/80+), were sorted by flow cytometry. g The expression of GS in MSCs, neutrophils, DCs, monocytes and macrophages via western blots, with HeLa cells as a positive control. h The expression of GS in MSCs, neutrophils, DCs, monocytes and macrophages via immunofluorescence. HeLa cells were used as a positive control
Fig. 6
Fig. 6
mTOR activation and cell cycle regulation are involved in ammonia-induced mesenchymal stem cell proliferation. a Schematic of the metabolic pathway of ammonia in GS-expressing MSCs. b Western blot analysis of the AKT/mTOR/S6K pathway with or without NH4Cl or glutamine treatment. c Western blot analysis of the AKT/mTOR/S6K pathway with or without both NH4Cl treatment or MSO treatment. d Western blot analyses of cyclin D/CDK4 and cyclin E/CDK2 with or without NH4Cl or glutamine treatment. e Western blot analysis of cyclin D/CDK4 and cyclin E/CDK2 with or without both NH4Cl treatment or MSO treatment
Fig. 7
Fig. 7
The proportion of bone marrow-derived MSCs was elevated in ammonia-loaded mice. a The ammonia concentration (µmol·L−1) of the wild-type mouse group, NH4Cl-loaded mouse group and NH4Cl-loaded mouse groups with MSO injection. b The percentage of MSCs in CD45- cells from mouse tibias and femurs in each group. c The statistical results of the percentage of MSCs in BM. d The percentage of the expression of MSC surface markers (CD29, CD44, CD105, Sca-1) and the expression of CD45 in each group. e The statistical results of the percentage of MSC surface marker expression in each group. f The statistical results of the percentage of CD45 expression in each group. g HE staining of the spinal column in each group. Red arrowheads, BM-derived fibroblasts; blue arrowheads, hematopoietic cells. Values are the mean ± SEM of an experiment performed in triplicate (one-way analysis of variance). *P < 0.05 versus the WT group. #P < 0.05 versus the NH4Cl-loaded group
Fig. 8
Fig. 8
The proportion of bone marrow-derived MSCs was elevated in the tumor infiltration model and uremic model. a The ammonia concentration (µmol·L−1) of wild-type mice, uremia model mice and tumor infiltration mice. b The percentage of MSCs in CD45- cells from mouse tibias and femurs in each group. c The statistical results of the percentage of MSCs in BM. d The percentage of the expression of MSC surface markers (CD29, CD44, CD105, Sca-1) and the expression of CD45 in each group. e The statistical results of the percentage of MSC surface marker expression in each group. f The statistical results of CD45 expression among in group. g HE staining of the spinal column in each group. Red arrowheads, BM-derived fibroblasts; blue arrowheads, hematopoietic cells; black arrowheads, LL2 cells; black arrowheads with diamond, completed bone trabecula; black arrowheads with circle, broken bone trabecula. h HE staining of bone with infiltrating lung cancer or breast cancer cells from patients. Red arrowheads, BM-derived fibroblasts; blue arrowheads, hematopoietic cells; black arrowheads, cancer cells. Values are the mean ± SEM of an experiment performed in triplicate (one-way analysis of variance). *P < 0.05 versus the WT group

Similar articles

Cited by

References

    1. Mariño, G. & Kroemer, G. Ammonia: A diffusible factor released by proliferating cells that induces autophagy. Sci. Signal.3, pe19 (2010). - PubMed
    1. Luo, C. et al. Ammonia drives dendritic cells into dysfunction. J. Immunol. (Baltim., Md.: 1950)193, 1080–1089 (2014). - PubMed
    1. Bharat, A. et al. Disseminated Ureaplasma infection as a cause of fatal hyperammonemia in humans. Sci. Transl. Med.7, 284re3 (2015). - PMC - PubMed
    1. Polletta, L. et al. SIRT5 regulation of ammonia-induced autophagy and mitophagy. Autophagy11, 253–270 (2015). - PMC - PubMed
    1. Eng, C. H., Yu, K., Lucas, J., White, E. & Abraham, R. T. Ammonia derived from glutaminolysis is a diffusible regulator of autophagy. Sci. Signal.3, ra31 (2010). - PubMed