

Inequality can double the energy required to secure universal decent living
- PMID: 36028504
- PMCID: PMC9418152
- DOI: 10.1038/s41467-022-32729-8
Inequality can double the energy required to secure universal decent living
Abstract
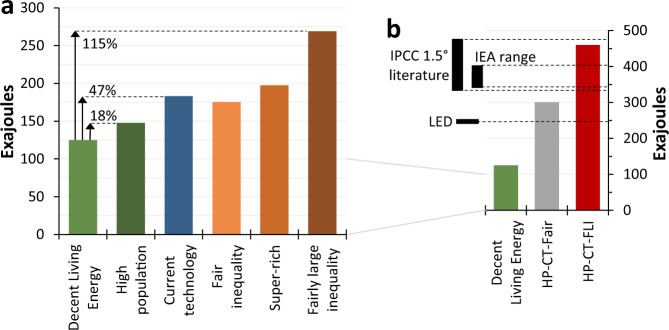
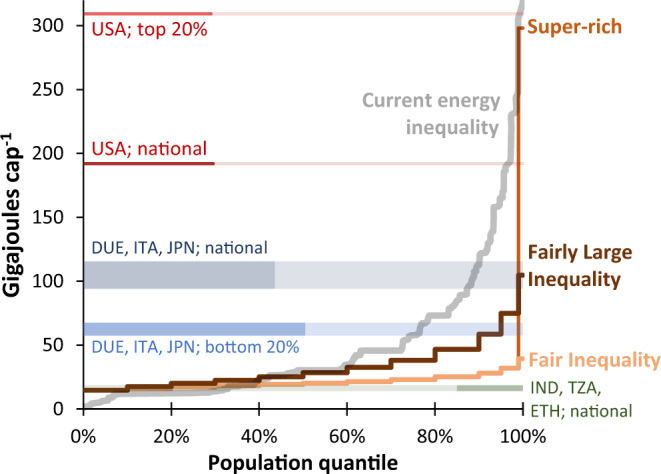
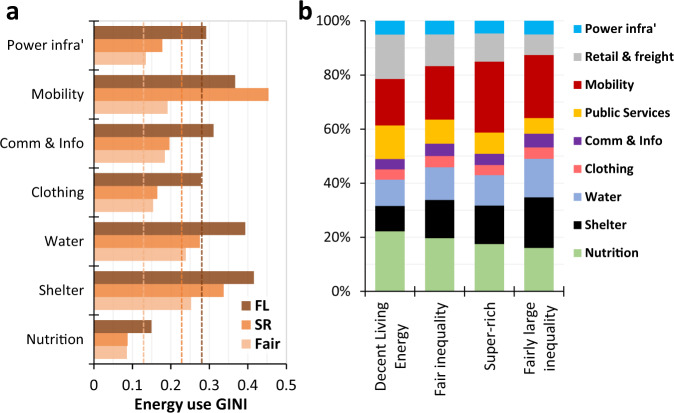
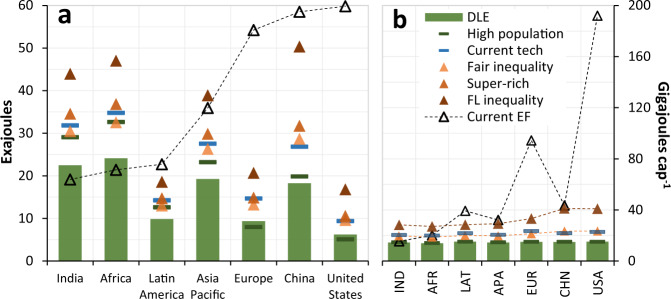
Ecological breakdown and economic inequality are among the largest contemporary global challenges, and the issues are thoroughly entangled - as they have been throughout the history of civilisations. Yet, the global economy continues toward ecological crises, and inequalities remain far higher than citizens believe to be fair. Here, we explore the role of inequality, alongside traditional drivers of ecological impacts, in determining global energy requirements for providing universal decent living. We consider scenarios from fair inequality - where inequalities mirror public ideals - through a fairly unequal world, to one with a super-rich global elite. The energy-costs of inequality appear far more significant than population: even fair levels increase the energy required to provide universal decent living by 40%, and a super-rich global 1% could consume as much energy as would providing decent living to 1.7 billion. We finish by arguing that total population remains important nonetheless, but for reasons beyond ecological impacts.
© 2022. The Author(s).
Conflict of interest statement
The author declares no competing interests.
Figures
Similar articles
-
Energy requirements for securing wellbeing in Switzerland and the space for affluence and inequality.Nat Commun. 2025 Apr 30;16(1):4066. doi: 10.1038/s41467-025-59276-2. Nat Commun. 2025. PMID: 40307205 Free PMC article.
-
Reducing global inequality to secure human wellbeing and climate safety: a modelling study.Lancet Planet Health. 2023 Feb;7(2):e147-e154. doi: 10.1016/S2542-5196(23)00004-9. Lancet Planet Health. 2023. PMID: 36754470
-
The Minderoo-Monaco Commission on Plastics and Human Health.Ann Glob Health. 2023 Mar 21;89(1):23. doi: 10.5334/aogh.4056. eCollection 2023. Ann Glob Health. 2023. PMID: 36969097 Free PMC article. Review.
-
Exploring the concepts of decent work through the lens of SDG 8: addressing challenges and inadequacies.Front Sociol. 2023 Nov 20;8:1266141. doi: 10.3389/fsoc.2023.1266141. eCollection 2023. Front Sociol. 2023. PMID: 38053676 Free PMC article. Review.
-
Socio-economic inequality and inequity in use of health care services in Kenya: evidence from the fourth Kenya household health expenditure and utilization survey.Int J Equity Health. 2019 Dec 18;18(1):196. doi: 10.1186/s12939-019-1106-z. Int J Equity Health. 2019. PMID: 31849334 Free PMC article.
Cited by
-
When enough is enough: Introducing sufficiency corridors to put techno-economism in its place.Ambio. 2024 Jul;53(7):960-969. doi: 10.1007/s13280-024-02027-2. Epub 2024 Apr 26. Ambio. 2024. PMID: 38671181 Free PMC article.
-
Energy requirements for securing wellbeing in Switzerland and the space for affluence and inequality.Nat Commun. 2025 Apr 30;16(1):4066. doi: 10.1038/s41467-025-59276-2. Nat Commun. 2025. PMID: 40307205 Free PMC article.
-
Quantifying the energy and emissions implications of consumption redistribution in the UK through sustainable consumption corridors.Sci Rep. 2025 May 12;15(1):16499. doi: 10.1038/s41598-025-01495-0. Sci Rep. 2025. PMID: 40355633 Free PMC article.
-
Ending extreme poverty has a negligible impact on global greenhouse gas emissions.Nature. 2023 Nov;623(7989):982-986. doi: 10.1038/s41586-023-06679-0. Epub 2023 Nov 29. Nature. 2023. PMID: 38030781 Free PMC article.
-
Fair pathways to net-zero healthcare.Nat Med. 2023 May;29(5):1078-1084. doi: 10.1038/s41591-023-02351-2. Epub 2023 May 18. Nat Med. 2023. PMID: 37202559 Review.
References
-
- Motesharrei S, Rivas J, Kalnay E. Human and nature dynamics (HANDY): Modeling inequality and use of resources in the collapse or sustainability of societies. Ecol. Econ. 2014;101:90–102. doi: 10.1016/j.ecolecon.2014.02.014. - DOI
-
- Ripple WJ, Wolf C, Newsome TM, Barnard P, Moomaw WR. World Scientists’ warning of a climate emergency. BioScience. 2016;70:8–12.
-
- Bradshaw, C. J. A. et al. Underestimating the challenges of avoiding a ghastly future. Front. Conserv. Sci.1, 1–10 (2021).
-
- Kareiva P, Carranza V. Existential risk due to ecosystem collapse: Nature strikes back. Futures. 2018;102:39–50. doi: 10.1016/j.futures.2018.01.001. - DOI
Publication types
MeSH terms
LinkOut - more resources
Full Text Sources
