. 2022 Aug 26;12(1):14608.
doi: 10.1038/s41598-022-17880-y.

Monitoring longitudinal disease progression in a novel murine Kit tumor model using high-field MRI

Affiliations

Monitoring longitudinal disease progression in a novel murine Kit tumor model using high-field MRI

Markus Kraiger et al. Sci Rep. .

Abstract

Animal models are an indispensable platform used in various research disciplines, enabling, for example, studies of basic biological mechanisms, pathological processes and new therapeutic interventions. In this study, we applied magnetic resonance imaging (MRI) to characterize the clinical picture of a novel N-ethyl-N-nitrosourea-induced Kit-mutant mouse in vivo. Seven C3H KitN824K/WT mutant animals each of both sexes and their littermates were monitored every other month for a period of twelve months. MRI relaxometry data of hematopoietic bone marrow and splenic tissue as well as high-resolution images of the gastrointestinal organs were acquired. Compared with controls, the mutants showed a dynamic change in the shape and volume of the cecum and enlarged Peyer´s patches were identified throughout the entire study. Mammary tumors were observed in the majority of mutant females and were first detected at eight months of age. Using relaxation measurements, a substantial decrease in longitudinal relaxation times in hematopoietic tissue was detected in mutants at one year of age. In contrast, transverse relaxation time of splenic tissue showed no differences between genotypes, except in two mutant mice, one of which had leukemia and the other hemangioma. In this study, in vivo MRI was used for the first time to thoroughly characterize the evolution of systemic manifestations of a novel Kit-induced tumor model and to document the observable organ-specific disease cascade.


Conflict of interest statement

The authors declare no competing interests.

Figures
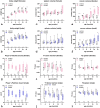
Figure 1
Figure 1
Body weight (a, b) significantly reduced weight was observed for the mutant females (a) initially detectable at the age of 8 months. Splenic volume (c, d) no genotype dependent difference was noticed; a sex-specific difference was detected at four and eight months. At the third measurement point data of one female bearing splenic cancer was excluded. Cecal volume (e, f) a temporal varying phenotype was observed for the cecal volume in mutants. The progression correlated with the form of the cecum, the initial decreased volume turned into a significant increase at later age. Peyer’s Patches (g, h) analysis of the MR images revealed prominent Peyer’s patches located inside the cecum. Manual enumeration revealed that, on average, up to five times more nodules were present in the mutants. T1 relaxometry (i, j) revealed possible changes in the cell composition of the hematopoietic tissue of the mutants with increasing age. Compared with controls, a trend toward T1 shortening was observed. T2 relaxometry (k, l) no genotype dependent difference was observed. However, T2 times were significantly longer in males, indicating a higher iron load in females. Markers representing individual data samples, bar indication median value; animal numbers are given below the box plots; *, p ≤ 0.05; **, p ≤ 0.01.
Figure 2
Figure 2
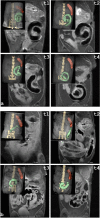
Comparison of cecal development in a female control mouse (a) and a female mutant mouse (b) along the first four time points (t1–t4). The spine is colored yellow, the spleen is shown in red and the cecum is colored green. At two (t1) and four (t2) months of age, the cecum of the mutant had an elongated shape, whereas the cecum in the control group was arranged in a coiled shape. At later time points, the shape of the mutant cecum resembled the anatomy of the control. Peyer´s patches were clearly visible in the inner wall of the mutant cecum (marked by white arrow in b).
Figure 3
Figure 3
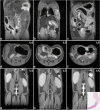
Examples of the development of the Peyer´s patches are given for a mutant female (a, b) and a male mutant (c, d) at an age of six and eight months. A comparison between the first and the second row illustrates the decreasing visibility of the patches at later time points. A striking thickening of the cecal wall was noted with increasing age, as observed, for example, in two female mutants at 12 months of age (e, f) (thickening is indicated by an arrow). (g) an example of the observed Peyer’s patches detected in a control along with associated histology. (h) coronal image showing the enlarged cecum of a mutant, and the corresponding macro image.
Figure 4
Figure 4
Representative tumor findings in mutant mice. At the third observation time point, a female mutant was found to have a large spleen (a). In (b) tumorous tissue was observed in the axillary region of an 8-month-old female. In (c) cancerous tissue is located in the pelvic region of a one-year-old female. (di) panel showing 2D fs-RARE data, starting at eight months of age, tracking cancer development in two mutant individuals over a six-month period. A mammary tumor is shown in (d–f), and a splenic hemangioma (tumor indicated by white arrow) is shown in (g–i) with the corresponding histologic finding as an insert in (i).
Figure 5
Figure 5
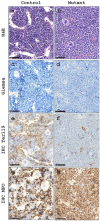
Representative images of bone marrow of the lumbar vertebrae from control (a, c, e, g) and mutant (b, d, f, h) mice. H&E and Giemsa stained sections (ad) show an increase in hematopoietic cell density with a corresponding decrease in vascularization in the mutant compared to the control. Immunohistochemistry (IHC) using the Ter119 marker for mature and immature erythrocytes reveals the expected proportion of the erythrocyte to myeloid cells (E: M) ratio in the control animal (e), in contrast, a decreased amount of erythrocytes was detected in mutant (f). Whereas the IHC using the MPO marker demonstrates an increase in the number of myeloid cells, a shift to (M: E) ratio, in the mutant (h) compared to the control shown in (g).
Figure 6
Figure 6
Quantification of the splenic iron load. (a) Example of a control spleen tissue and (b) of a mutant spleen tissue stained with Prussian blue. (c) The training region within a male control originally used for manual annotation with clearly identifiable, positively stained areas. (d) An example of the achieved performance of the trained pixel classifier, iron-loaded areas highlighted in dark blue. (e) Results of quantitative image analysis of spleen samples (females: 4/4, males: 4/4; age: 12 month) stained with Prussian blue confirmed the unchanged splenic iron load in C3H KitN824K/WT mice and the general sex-specific iron status. Consistently, shorter T2 times were measured in the spleen of females compared with males, both at 12 months of age (**, p ≤ 0.01).

Similar articles

Cited by

References

    1. Abbaspour Babaei M, Kamalidehghan B, Saleem M, Huri HZ, Ahmadipour F. Receptor tyrosine kinase (c-Kit) inhibitors: A potential therapeutic target in cancer cells. Drug Des. Dev. Ther. 2016;10:2443–2459. doi: 10.2147/DDDT.S89114. - DOI - PMC - PubMed
    1. Lennartsson J, Ronnstrand L. The stem cell factor receptor/c-Kit as a drug target in cancer. Curr. Cancer Drug Targets. 2006;6:65–75. doi: 10.2174/156800906775471725. - DOI - PubMed
    1. Gunawan B. Knock-in murine models of familial gastrointestinal stromal tumours. J. Pathol. 2008;214:407–409. doi: 10.1002/path.2315. - DOI - PubMed
    1. Pham DDM, Guhan S, Tsao H. KIT and melanoma: Biological insights and clinical implications. Yonsei Med. J. 2020;61:562–571. doi: 10.3349/ymj.2020.61.7.562. - DOI - PMC - PubMed
    1. Ke H, Kazi JU, Zhao H, Sun J. Germline mutations of KIT in gastrointestinal stromal tumor (GIST) and mastocytosis. Cell Biosci. 2016;6:55. doi: 10.1186/s13578-016-0120-8. - DOI - PMC - PubMed

Publication types