. 2022 Dec;27(12):4843-4860.
doi: 10.1038/s41380-022-01742-0. Epub 2022 Aug 26.

A circuit from lateral septum neurotensin neurons to tuberal nucleus controls hedonic feeding

Affiliations

A circuit from lateral septum neurotensin neurons to tuberal nucleus controls hedonic feeding

Zijun Chen et al. Mol Psychiatry. 2022 Dec.

Abstract

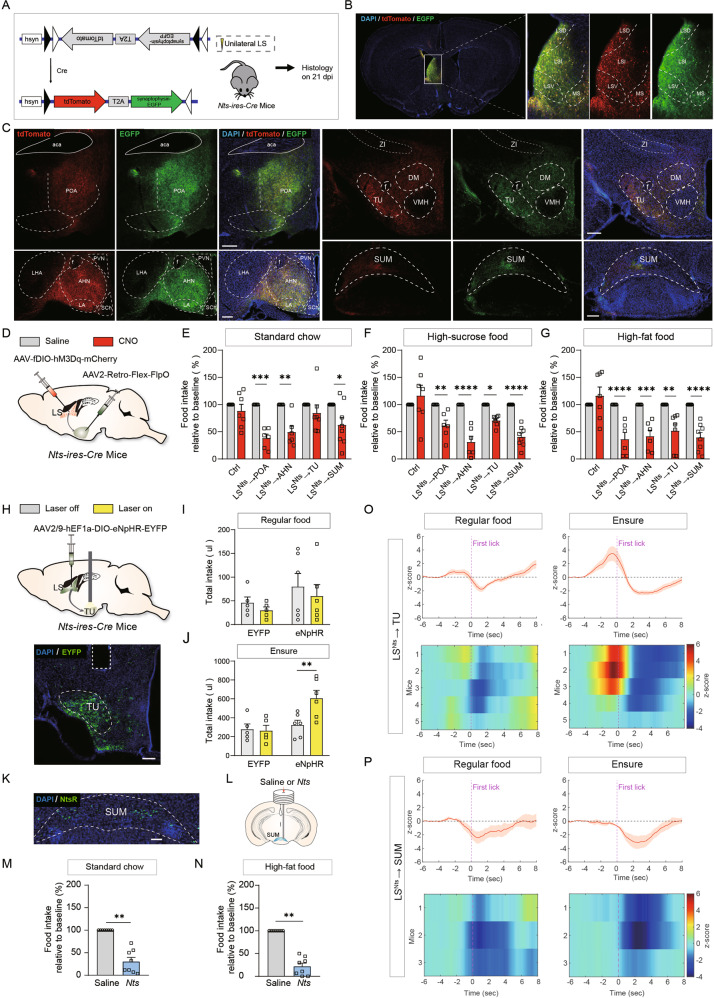
Feeding behavior is regulated by both the homeostatic needs of the body and hedonic values of the food. Easy access to palatable energy-dense foods and the consequent obesity epidemic stress the urgent need for a better understanding of neural circuits that regulate hedonic feeding. Here, we report that neurotensin-positive neurons in the lateral septum (LSNts) play a crucial role in regulating hedonic feeding. Silencing LSNts specifically promotes feeding of palatable food, whereas activation of LSNts suppresses overall feeding. LSNts neurons project to the tuberal nucleus (TU) via GABA signaling to regulate hedonic feeding, while the neurotensin signal from LSNts→the supramammillary nucleus (SUM) is sufficient to suppress overall feeding. In vivo calcium imaging and optogenetic manipulation reveal two populations of LSNts neurons that are activated and inhibited during feeding, which contribute to food seeking and consumption, respectively. Chronic activation of LSNts or LSNts→TU is sufficient to reduce high-fat diet-induced obesity. Our findings suggest that LSNts→TU is a key pathway in regulating hedonic feeding.


Conflict of interest statement

The authors declare no competing interests.

Figures

Fig. 1
Fig. 1. Nts-positive neurons in the LS were activated during hedonic feeding.
A The LS was activated during the intake of high-sucrose food without an energy deficit. Left panel: Food intake measured in 2 h for control mice (ad libitum access to standard chow, n = 10) and hedonic feeding mice (intermittent access to high-sucrose food along with ad libitum access to standard chow, n = 10). Mann–Whitney U test. ****P < 0.0001. Middle panel: Number of c-fos+ neurons in the LS of control (n = 10) and hedonic feeding mice (n = 10). Mann–Whitney U test. ****P < 0.0001. Right panel: Representative images of c-fos immunostaining in the LS of control and hedonic-feeding mice. Scale bar: 100 μm. B The LS showed preferential activation when mice consumed high-sucrose food (HSF) compared with standard chow after fasting. Left panel: Food intake measured in 2 h for standard chow (n = 8) or high-sucrose food (n = 8) after an overnight fast. Mann–Whitney U test. ****P < 0.0001. Middle panel: Number of c-fos+ neurons in the LS of the fasted, fasted + chow and fasted + HSF groups. One-way ANOVA (F(2, 21) = 6.558, P < 0.01) followed by Tukey’s post hoc test. ns, no significant difference, *P < 0.05, and **P < 0.01. Right panel: Representative images of c-fos immunostaining in the LS of the fasted, fasted + chow and fasted + HSF groups. Scale bar: 100 μm. C Representative images of double in situ hybridization experiments for c-fos (green) and Nts (red). Scale bar: 100 μm. D Representative images of double in situ hybridization experiments for c-fos (green) and Penk (red). Scale bar: 100 μm. E Representative images of double in situ hybridization experiments for c-fos (green) and Crhr2 (red). Scale bar: 100 μm. F Percentages of Penk+, Crhr2+ and Nts+ cells among the c-fos+ population: Penk+/c-fos+ = 19.7 ± 2.5%, Crhr2+/c-fos+ = 13.5 ± 1.3%, and Nts+/c-fos+ = 57.6 ± 2.5%. One-way ANOVA (F(2,14) = 43.71, P < 0.01) followed by Tukey’s post hoc test. ***P < 0.001 and ****P < 0.0001. Means ± s.e.m. G Representative images of double in situ hybridization experiments for Nts (red) and vGAT (green). Scale bar: 100 μm. H Percentage of Nts+ cells in the vGAT+ population and percentage of vGAT+ cells in the Nts+ population: (Nts+ & vGAT+)/vGAT+ = 21.3 ± 3.8%, (Nts+ & vGAT+)/Nts+ = 100%, and (Nts+ & vGluT2+)/Nts+ = 1.38 ± 0.5%.
Fig. 2
Fig. 2. Silencing of LSNts neurons promotes hedonic feeding with palatable food.
A Left panel: Schematic showing the injection of AAV-DIO-TeNT into the LS for the synaptic silencing of LSNts neurons. Right panel: representative image of the injection site and viral expression in the LS of Nts-ires-Cre mice. Scale bar: 500 μm. B Representative image showing the expression of ChR2 (red) and TeNT (green) in LSNts neurons. Scale bar: 500 μm (upper panel), 20 μm (lower panel). C Schematic showing the experiment used to record postsynaptic currents in LS slices induced by optogenetic stimulation of LSNts neurons. In the slice in which ChR2 was coexpressed with EYFP, blue light stimulation evoked robust IPSCs (gray trace), which was blocked by picrotoxin (red trace). In the slice in which ChR2 was coexpressed with TeNT, blue light stimulation failed to evoke IPSCs (green trace). D Statistics for the amplitudes of light-evoked IPSCs in TeNT-expressing (n = 6 cells) and EYFP-expressing (n = 7 cells) mice. Two-way ANOVA (F(1,11) = 53.46, P < 0.0001) followed by Sidak’s post hoc test. ***P < 0.0001. Means ± s.e.m. E Quantification of 2-h solid food intake in EYFP- (gray bar, n = 6) and TeNT-expressing mice (green bar, n = 8). Upper panel: TeNT expression increased the intake of high-sucrose and high-fat food but not standard chow under ad libitum conditions. Lower panel: TeNT expression had no effect on food intake under fasted conditions. Mann–Whitney U test. ***P < 0.001. Means ± s.e.m. F Quantification of 2-h liquid food intake by EYFP- (gray bar, n = 6) and TeNT-expressing mice (green bar, n = 8). TeNT expression increased the intake of palatable liquid food but not water. Representative licking behavior (left panel), cumulative licks (middle panel) and total intake (right panel) of water (upper panel), sucrose solution (middle panel) and Ensure (lower panel) in EYFP- (gray, n = 6) and TeNT-expressing mice (green, n = 8). Mann–Whitney U test. **P < 0.01 and ****P < 0.0001. Means ± s.e.m. G Quantification of changes in the body weights of EYFP- (gray bar, n = 7) and TeNT-expressing (green bar, n = 7) mice. Left panel: Representative images showing the EYFP- and TeNT-expressing mice after 6 weeks of feeding on a high-fat diet. Right panel: TeNT expression promoted increased body weight of mice fed the high-fat diet, but not standard chow. Mann–Whitney U test. ns, no significant difference, *P < 0.01, and ***P < 0.001. Means ± s.e.m.
Fig. 3
Fig. 3. Activation of LSNts neurons suppresses overall feeding.
A Left panel: Schematic showing the injection of AAV-DIO-hM3D into the LS for chemogenetic activation of LSNts neurons. Right panel: Representative image of the injection site and viral expression in the LS of Nts-ires-Cre mice. Scale bar: 500 μm. B Left panel: Representative image showing that the CNO injection (2 mg/kg) induced robust c-fos expression of LSNts neurons in hM3D-expressing mice. Scale bar: 100 μm. Right panel: Percentage of c-fos+ cells among LSNts neurons from the “hM3D + saline” (n = 4), “EYFP + CNO” (n = 4) and “hM3D + CNO” (n = 4) groups. One-way ANOVA (F(2,9) = 684.5, P < 0.001) followed by Dunnett’s post hoc test. ****P < 0.0001. C Quantification of 2-h solid food intake after saline (gray bar) and CNO (red bar) injection in mCherry- and hM3D-expressing mice. Upper panel: CNO injection reduced food intake under ad libitum conditions in hM3D-expressing (n = 6) but not mCherry-expressing mice (n = 5). Two-way ANOVA (standard chow, F(1,18) = 8.202, P < 0.05; high-sucrose food, F(1,18) = 9.941, P < 0.01; high-fat food, F(1,18) = 19.27, P < 0.001) followed by Sidak’s post hoc test. **P < 0.01, ***P < 0.001, and ****P < 0.0001. Lower panel: CNO injection reduced high-sucrose and high-fat food intake under fasted-refed conditions in hM3D-expressing (n = 6) but not mCherry-expressing mice (n = 5). Two-way ANOVA (standard chow, F(1,18) = 0.9784, P > 0.05; high-sucrose food, F(1,18) = 5.234, P < 0.05; high-fat food, F(1,18) = 6.420, P < 0.05) followed by Sidak’s post hoc test, ***P < 0.001, means ± s.e.m. D CNO injection reduced the total intake of sucrose solution (upper panel) and Ensure (lower panel) by hM3D-expressing (n = 7) but not mCherry-expressing mice (n = 5). Sucrose solution: two-way ANOVA (F(1,20) = 7.96, P < 0.05) followed by Sidak’s post hoc test. ***P < 0.001. Ensure: two-way ANOVA (F(1,20) = 15.70, P < 0.001) followed by Tukey’s post hoc test. ****P < 0.0001. Means ± s.e.m.
Fig. 4
Fig. 4. GABA and neurotensin signaling differentially regulate hedonic and overall feeding.
A Schematic showing the experimental design for CRISPR/Cas9-mediated knockdown of vGAT and Nts. The AAV encoding vGAT-targeting, Nts-targeting, or control LacZ-targeting sgRNA and Cre-inducible hM3D was injected into Nts-ires-Cre mice crossed with Cre-inducible Cas9 knock in mice. B Schematic showing the experimental design for the verification of vGAT knockdown. In LacZ control or vGAT knockdown mice, ChR2 was expressed in LSNts neurons, and whole-cell patch clamp recordings were performed on neighboring Nts-negative neurons. C Representative traces of light-evoked IPSCs for LacZ control (gray) and vGAT knockdown (red) mice at different light powers (from left to right: 0.5 mW, 1.0 mW, 1.5 mW, 2.0 mW). D Statistics for the amplitudes of light-evoked IPSCs in the LacZ control (gray, n = 8 cells) and vGAT knockdown (red, n = 8 cells) mice. Two-way ANOVA (F(1,14) = 50.87, P < 0.0001) followed by Sidak’s post hoc test. **P < 0.01 and ***P < 0.0001, means ± s.e.m. E Baseline food intake (left panel: standard chow, right panel: high-sucrose food) by LacZ control (yellow, n = 11), vGAT knockdown (red, n = 9) and Nts knockdown (blue, n = 13) mice. One-way ANOVA (standard chow, F(2,230) = 1.716, P > 0.05; palatable food, F(2,30) = 6.563, P < 0.01) followed by Tukey’s post hoc test. ns, no significant difference and *P < 0.05. Means ± s.e.m. F Effects of chemogenetic activation of LSNts neurons on food intake (left panel: standard chow, right panel: palatable food) by LacZ control (n = 11), vGAT knockdown (n = 9) and Nts knockdown (n = 13) mice. Two-way ANOVA (standard chow, F(2,60) = 4.661, P < 0.05; palatable food, F(2,60) = 5.583, P < 0.01) followed by Sidak’s post hoc test. ns, no significant difference, *P < 0.05, ***P < 0.001, and ****P < 0.0001, means ± s.e.m. G Representative images showing that the CNO (2 mg/kg) injection induced robust c-fos expression in LSNts neurons in LacZ control, vGAT knockdown and Nts knockdown mice. Scale bar: 100 μm. H Statistical analysis of the ratio of c-fos+ cells after saline and CNO injection in LacZ control (n = 3), vGAT knockdown (n = 3) and Nts knockdown (n = 3) mice. One-way ANOVA (F(5,12) = 854.6, P < 0.0001) followed by Tukey’s post hoc test. ****P < 0.0001. Means ± s.e.m.
Fig. 5
Fig. 5. The biphasic activity of LSNts neurons drives food seeking and consumption.
A Left panel: Population Ca2+ activity of LSNts neurons during free feeding of Ensure. Middle panel: Population Ca2+ activity of LSNts neurons when food was omitted. Right panel: Population Ca2+ activity of LSNts neurons when the animal was head-fixed and fed Ensure. Dashed vertical line: first lick. B Area under the curve of Ca2+ activity during the food approach phase (n = 8). One-way ANOVA (F(2, 21) = 5.49, P < 0.01) followed by Tukey’s post hoc test. *P < 0.05. Means ± s.e.m. C Area under the curve of Ca2+ activity during the food consumption phase (n = 8). One-way ANOVA (F(2, 21) = 11.05, P < 0.01) followed by Tukey’s post hoc test. **P < 0.01 and ***P < 0.001. Means ± s.e.m. D Upper panel: Schematic showing the injection of AAV-DIO-ChR2 or AAV-DIO-eNpHR into the LS for optogenetic manipulation of LSNts neurons. Middle panel: Representative image showing the expression of ChR2-mCherry in LSNts neurons. Lower panel: Representative image showing the expression of eNpHR-EYFP. E The effect of optogenetic activation (blue, n = 4) or inhibition (yellow, n = 6) of LSNts neurons during the food approach phase on food seeking and food consumption. Wilcoxon signed-rank test. *P < 0.05. F The effect of optogenetic activation (blue, n = 4) or inhibition (yellow, n = 6) of LSNts neurons during the food consumption phase on food seeking and food consumption. Wilcoxon signed-rank test. *P < 0.05 and **P < 0.01.
Fig. 6
Fig. 6. Miniscope Ca2+ imaging reveals two populations of LSNts neurons that are activated and inhibited during feeding.
A Schematic showing Ca2+ imaging of individual LSNts neurons with a head-mounted miniature microscope. B Ca2+ dynamics of 10 representative LSNts cells during feeding. Scale bar: 1 z score. C Ca2+ responses of 290 LSNts cells aligned to the first lick during free feeding of Ensure. Approximately 31% of cells were activated, and 32% of cells were inhibited. D The time to the peak of activated cells (n = 88) was shorter than the time to the trough of inhibited cells (n = 86). Mann–Whitney U test. ***P < 0.001. E The response half-width of activated cells (n = 88) was shorter than that of inhibited cells (n = 86). Mann–Whitney U test. ***P < 0.001. F. Ca2+ responses of 130 LSNts cells aligned to the first lick under the food-deficient condition. Approximately 40% of cells were activated, and 11% of cells were inhibited. G. Percentages of activated, inhibited and nonresponsive cells under free feeding (left panel) and food omission (right panel) conditions. H Area under the curve of Ca2+ activity for activated (left panel) and inhibited (right panel) cells during the free feeding of Ensure and food omission trials. Mann–Whitney U test. Ns, no significant difference. I. Correlation between the response half-width and bout duration for inhibited (left panel) and activated neurons (middle panel). Right panel: The correlation coefficient between the response and behavior of inhibited cells was larger than that of activated cells. Mann–Whitney U test. ***P < 0.001. J Ca2+ response of activated (right panel) and inhibited (left panel) cells when aligned to the last lick during free feeding of Ensure. K. Ca2+ response of LSNts neurons to the sucrose solution and Ensure (n = 143 neurons from 4 mice) grouped by k-means clustering. Vertical dashed line: first lick. L Ca2+ response of LSNts neurons to Ensure and regular food (n = 124 neurons from 4 mice) grouped by k-means clustering. Vertical dashed line: first lick. M Ca2+ response of LSNts neurons to Ensure and water (n = 161 neurons from 4 mice) grouped by k-means clustering. Vertical dashed line: first lick. N Percentages of activated, inhibited and nonresponsive cells identified during the free feeding of Ensure, sucrose solution, regular food and water.
Fig. 7
Fig. 7. LSNts neurons project to the TU to regulate hedonic feeding.
A Schematic showing the SynaptoTag AAV strategy to map the projections of LSNts neurons. B Representative image of the injection site and viral expression in the LS of Nts-ires-Cre mice. C Representative images showing tdTomato-expressing axons and GFP-expressing axon terminals in different regions. Scale bar: 200 μm. D Schematic showing the viral strategy used to activate LSNts neurons projecting to one specific downstream target through a chemogenetic approach. Quantification of the intake of standard chow (E), high-sucrose (F) and high-fat (G) food after chemogenetic activation of each LSNts projection. Control group, n = 7; LSNts→POA group, n = 6; LSNts→AHN group, n = 6; LSNts→TU group, n = 7; LSNts→SUM group, n = 8. Two-way ANOVA (standard chow, F(4,68) = 2.854, P < 0.05; high-sucrose food, F(4,58) = 9.145, P < 0.0001; high-fat food, F(4,58) = 4.541, P < 0.0001) followed by Sidak’s post hoc test. *P < 0.05, **P < 0.01, ***P < 0.001, and ****P < 0.0001. Means ± s.e.m. H Upper panel: Schematic showing the viral strategy used to inhibit LSNts neurons projecting to TU through an optogenetic approach. Lower panel: Representative images showing the expression of eNpHR-EYFP in LSNts neurons projecting to the TU. Scale bar: 200 μm. I Optogenetic inhibition of TU-projecting LSNts neurons had no effect on regular food intake. EYFP control group, n = 5; eNpHR group, n = 6. Two-way ANOVA (F(1,18) = 0.2096, P > 0.05). Means ± s.e.m. J Optogenetic inhibition of TU-projecting LSNts neurons significantly increased the intake of Ensure. EYFP control group, n = 5; eNpHR group, n = 6. Two-way ANOVA (F(1,18) = 5.341, P < 0.05) followed by Sidak’s post hoc test. **P < 0.01. Means ± s.e.m. K Representative images showing the in situ hybridization results for the neurotensin receptor 1 (NtsR1) mRNA signal in the SUM. L Schematic showing the experimental design for the local infusion of the Nts peptide into the SUM. M Quantification of 2-h intake of standard chow after saline (gray bar, n = 8) or Nts (blue bar, n = 8) administration to the SUM. Wilcoxon signed-rank test. ***P < 0.001. N Quantification of 2-h intake of high-fat food after saline (gray bar, n = 8) or Nts (blue bar, n = 8) administration to the SUM. Wilcoxon signed-rank test. **P < 0.01. O Average Ca2+ activity of LSNts→TU recorded by fiber photometry during free feeding of regular food (left panel) or Ensure (right panel). Upper panel: Population average from 5 mice. Lower panel: Ca2+ activity in individual mice. P Average Ca2+ activity of the LSNts→SUM circuit recorded by fiber photometry during free feeding of regular food (left panel) or Ensure (right panel). Upper panel: Population average from 3 mice. Lower panel: Ca2+ activity in individual mice.
Fig. 8
Fig. 8. Activation of LSNts neurons prevents high-fat diet-induced obesity.
A Schematic showing the experimental design for chronic chemogenetic activation of LSNts neurons in a high-fat diet-induced obesity model. B Changes in the body weight of control mice fed standard chow (gray, n = 5), control mice fed a high-fat diet (red, n = 5), LSNts::hM3D mice fed a high-fat diet (green, n = 7) and LSNts→TU::hM3D mice fed a high-fat diet (orange, n = 9) over several weeks. Two-way ANOVA (F(3,22) = 13.74, P < 0.0001). Means ± s.e.m. C Changes in the body weight of control mice fed standard chow (gray, n = 5), control mice fed a high-fat diet (red, n = 5), LSNts::hM3D mice fed a high-fat diet (green, n = 7) and LSNts→TU::hM3D mice fed a high-fat diet (orange, n = 9) after 6 weeks. Two-way ANOVA (F(3,22) = 11.4, P < 0.001) followed by Tukey’s post hoc test. *P < 0.05 and ***P < 0.001. Means ± s.e.m. D The average locomotor activity of control mice fed standard chow (gray, n = 5), control mice fed a high-fat diet (red, n = 5), LSNts::hM3D mice fed a high-fat diet (green, n = 7) and LSNts→TU::hM3D mice fed a high-fat diet (orange, n = 9). One-way ANOVA (F(3,22) = 0.15, P > 0.05). Means ± s.e.m. E The duration in the center of the open field test for control mice fed standard chow (gray, n = 5), control mice fed a high-fat diet (red, n = 5), LSNts::hM3D mice fed a high-fat diet (green, n = 7) and LSNts→TU::hM3D mice fed a high-fat diet (orange, n = 9). One-way ANOVA (F(3,22) = 1.19, P > 0.05). Means ± s.e.m. F Working model of the molecular and circuitry mechanism by which LSNts neurons regulate hedonic feeding and body weight.

References

    1. Finucane MM, Stevens GA, Cowan MJ, Danaei G, Lin JK, Paciorek CJ, et al. National, regional, and global trends in body-mass index since 1980: systematic analysis of health examination surveys and epidemiological studies with 960 country-years and 9.1 million participants. Lancet. 2011;377:557–67. doi: 10.1016/S0140-6736(10)62037-5. - DOI - PMC - PubMed
    1. Saper CB, Chou TC, Elmquist JK. The need to feed: homeostatic and hedonic control of eating. Neuron. 2002;36:199–211. doi: 10.1016/S0896-6273(02)00969-8. - DOI - PubMed
    1. Friedman JM, Halaas JL. Leptin and the regulation of body weight in mammals. Nature. 1998;395:763–70. doi: 10.1038/27376. - DOI - PubMed
    1. Sternson SM, Eiselt AK. Three pillars for the neural control of appetite. Annu Rev Physiol. 2017;79:401–23. doi: 10.1146/annurev-physiol-021115-104948. - DOI - PubMed
    1. Berthoud HR, Munzberg H, Morrison CD. Blaming the brain for obesity: integration of hedonic and homeostatic mechanisms. Gastroenterology. 2017;152:1728–38. doi: 10.1053/j.gastro.2016.12.050. - DOI - PMC - PubMed

Publication types