. 2022 Aug 26;5(1):878.
doi: 10.1038/s42003-022-03804-z.

mTOR regulation of metabolism limits LPS-induced monocyte inflammatory and procoagulant responses

Affiliations

mTOR regulation of metabolism limits LPS-induced monocyte inflammatory and procoagulant responses

Nina C Lund et al. Commun Biol. .

Abstract

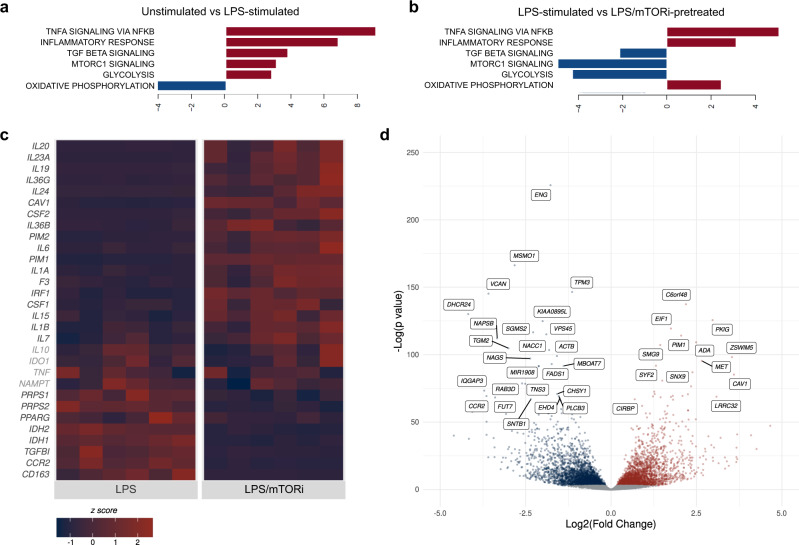
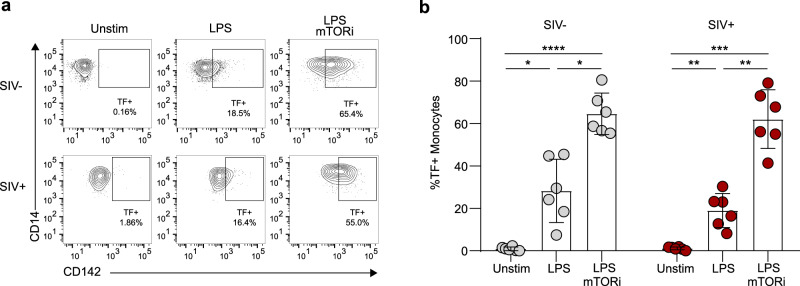
Translocated lipopolysaccharide (LPS) activates monocytes via TLR4 and is hypothesized to increase cardiovascular disease risk in persons living with HIV. We tested whether mTOR activity supports LPS-stimulated monocyte production of pro-inflammatory cytokines and tissue factor (TF), as it propels the inflammatory response in several immune cell types besides monocytes. However, multi-omics analyses here demonstrate that mTOR activates a metabolic pathway that limits abundance of these gene products in monocytes. Treatment of primary human monocytes with catalytic mTOR inhibitors (mTORi) increased LPS-induced polyfunctional responses, including production of IL-1β, IL-6, and the pro-coagulant, TF. NF-κB-driven transcriptional activity is enhanced with LPS stimulation after mTORi treatment to increase expression of F3 (TF). Moreover, intracellular NAD+ availability is restricted due to decreased salvage pathway synthesis. These results document mTOR-mediated restraint of the LPS-induced transcriptional response in monocytes and a metabolic mechanism informing strategies to reverse enhanced risk of coagulopathy in pro-inflammatory states.


Conflict of interest statement

The authors declare no competing interests.

Figures

Fig. 1
Fig. 1. mTOR inhibition potentiates the inflammatory phenotype of primary uninfected human monocytes following TLR4 stimulation.
a Freshly isolated human monocytes were pretreated as indicated with rapamycin (100 nM) or one of two structurally distinct mTORi (AZD2014, mTORi #1; INK128, mTORi #2; each 5 μM) or DMSO for 6 h prior to stimulation with LPS (1 μg, 30 m). Representative western blot series from one independent donor of three quantified, with adjusted density representing fold change of phosphorylated target staining, normalized to GAPDH staining, relative to the stimulated control (LPS). b Monocytes from four donors were pretreated as in a, stimulated with LPS (1 μg, 24 h), and supernatant cytokine content was quantified on the MSD platform. ce PBMCs from three donors were pretreated with AZD2014 for 6 h and stimulated with LPS (1 ng, 18 h) prior to staining. Representative flow plot (c) and aggregates (d and e) represent gating on leukocyte/singlet/live/CD14+. Boolean gating (e) facilitated identification of subpopulations producing different combinations of cytokines. e Illustrates that some monocytes produced no cytokines at all (turquoise), whether unstimulated, only stimulated with LPS, or stimulated with LPS after mTORi pretreatment. In contrast, the color coding described in the rightmost panel in e indicates that others produced one cytokine or different combinations of two or three cytokines, with “polyfunctionality” being defined as production of 2 or 3 cytokines in different combinations. Enahnced polyfunctionality was seen among the mTORi pretreated, LPS-stimulated monocytes. Statistical analyses: for the blot quantification (a), significance was determined using an ANOVA with Dunnett’s multiple comparisons, and asterisks (*) indicate a comparison to the stimulated control. For b, significance was determined via one-way ANOVA Tukey’s multiple comparisons, except in cases where Friedman tests and Dunn’s multiple comparisons were appropriate. For d, asterisks (*) indicate comparisons between US and LPS/mTORi (AZD2014) and hashes (#) indicate comparisons between LPS and LPS/mTORi (AZD2014), and significance was computed via two-way ANOVA and Tukey’s multiple comparisons. */# p < 0.05, **/## p < 0.01, ***/### p < 0.001. Error bars represent mean ± SD. For e, cytokine profiles were compared using Chi-square tests.
Fig. 2
Fig. 2. mTOR inhibition potentiates surface expression of tissue factor on primary uninfected human monocytes following TLR4 stimulation.
a, b Freshly isolated human monocytes from three independent donors were pretreated as indicated with rapamycin (100 nM) or one of two structurally distinct mTORi (AZD2014, mTORi #1; INK128, mTORi #2; each 5 μM) or DMSO for 6 h and stimulated with LPS (1 μg, 12 h) prior to staining Representative flow plot (a) and aggregate (b) represent gating on leukocyte/singlet/live/CD14+. For b, significance was determined via one-way ANOVA and Tukey’s multiple comparisons. *p < 0.05. Error bars represent mean ± SD.
Fig. 3
Fig. 3. mTOR inhibition of LPS-stimulated monocytes promotes an inflammatory transcriptional program.
ad Monocytes from six independent donors were pretreated with an mTORi (AZD2014 at 5 μM, 6 h) or DMSO and stimulated with LPS (1 ng, 6 h) for bulk RNA-seq analysis. Select HALLMARK gene sets identified as differentially regulated through GSEA, presenting expression data comparing LPS-stimulated monocytes to unstimulated monocytes (a) and mTORi-treated, stimulated monocytes to LPS-stimulated monocytes without mTORi pretreatment (b). For complete HALLMARK GSEA, see also Supplementary Fig. 4. c, d Differential expression of genes of interest. c Expression normalized by z score; genes that did not reach significance are noted in light gray. d Significantly upregulated (red) or downregulated (blue) genes determined using an FDR adjusted p value cut-off of 0.05. Top 50 genes by FDR adjusted p value labeled.
Fig. 4
Fig. 4. mTOR inhibition restricts NAD+ synthesis in LPS-stimulated primary human monocytes.
ac Donor monocytes (n = 7) were pretreated with an mTORi (AZD2014 at 5 μM, 6 h) or vehicle (DMSO) and stimulated with LPS (1 ng, 18 h) prior to metabolome extraction and analysis via LC-MS. a Partial least squares discriminant analysis (PLS-DA) and b hierarchical clustering analysis of “top 25” metabolites identified via one-way ANOVA performed using MetaboAnalyst. c Shows relative peak area of the individual metabolite NAD+. Significance was assessed with a Friedman test and Dunn’s multiple comparisons. d Monocytes from four independent donors were pretreated and stimulated ex vivo as in a and intracellular NAD+ content was quantified differently using an enzymatic assay. Significance was evaluated by one-way ANOVA and Tukey’s multiple comparisons. e Schematic outlining pathways supporting NAD+ biosynthesis. f Donor monocytes (n = 3 unique donors) were pretreated as in a and stimulated with LPS (1 ng) for the specified duration (3 or 6 h) prior to lysis and western analysis. Representative blot series from one donor of three shown. G-H Donor monocytes (n = 4 unique donors) were pretreated as indicated with inhibitors of either mTOR (AZD2014) (LM, light gray), IDO1 (epacadostat) (LI, red), NAMPT (FK866) (LN, blue), or G6PD (G6PDi-1) (LG, yellow), cultured in media supplemented with 13C-tryptophan for 6 h and then stimulated with LPS (1 ng, 18 h). Note that key to abbreviations of conditions is listed in panel h for conditions used in g and h. g The metabolome was extracted and targeted analysis was obtained via LC-MS. The abundance of the unlabeled (M + 0, gray columns) and labeled (maroon columns) species of interest are shown as a percentage of the total abundance of each metabolite. Representations of labeled species with each 13C marked in maroon are under graphs in g. h Shows relative peak area of three metabolites of interest: tryptophan, kynurenine, and NAD+. For g and h, significance was determined by two-tailed t-tests, comparing LPS-induced response after each inhibitor pretreatment to the DMSO pretreatment, LPS-stimulated condition. For g, relative abundances of only the labeled species of kynurenine (in maroon) were compared, evaluating LPS-induced response after each inhibitor pretreatment compared to the DMSO pretreatment, LPS-stimulated condition. Statistical evaluation was not performed for tryptophan or NAD+ in g. *p < 0.05, **p < 0.01, ***p < 0.001, ****p < 0.0001. Error bars represent mean ± SD in any panel showing them.
Fig. 5
Fig. 5. mTOR inhibition potentiates surface expression of tissue factor on monocytes from uninfected and SIV-infected macaques in an equivalent manner.
a, b Cryopreserved PBMCs from six uninfected and six chronically SIVmac239-infected rhesus macaques were pretreated with an mTORi (AZD2014 at 5 μM, 6 h) or DMSO and stimulated with LPS (1 ng, 12 h) prior to staining for flow cytometry. For b, gray dots represent uninfected (SIV−) animals and red dots represent infected (SIV+). Representative flow plots (a) and aggregate (b) represent gating on leukocyte/singlet/live/CD11b+/CD14+. For additional details on gating strategy see Supplementary Fig. 6. *p < 0.05, **p < 0.01, ***p < 0.001, ****p < 0.0001, p values calculated using a two-way ANOVA and Sidak’s multiple comparisons. Error bars represent mean ± SD.

References

    1. Shah ASV, et al. Global burden of atherosclerotic cardiovascular disease in people living with HIV: systematic review and meta-analysis. Circulation. 2018;138:1100–1112. doi: 10.1161/CIRCULATIONAHA.117.033369. - DOI - PMC - PubMed
    1. Feinstein MJ, et al. HIV-related myocardial vulnerability to infarction and coronary artery disease. J. Am. Coll. Cardiol. 2016;68:2026–2027. doi: 10.1016/j.jacc.2016.07.771. - DOI - PMC - PubMed
    1. Butler J, et al. Diastolic dysfunction in patients with human immunodeficiency virus receiving antiretroviral therapy: results from the CHART study. J. Card. Fail. 2020;26:371–380. doi: 10.1016/j.cardfail.2019.10.011. - DOI - PMC - PubMed
    1. Feinstein Matthew J, et al. Characteristics, prevention, and management of cardiovascular disease in people living with HIV: a scientific statement from the American Heart Association. Circulation. 2019;140:e98–e124. doi: 10.1161/CIRCULATIONAHA.119.040654. - DOI - PMC - PubMed
    1. Giorgi JV, et al. Shorter survival in advanced human immunodeficiency virus type 1 infection is more closely associated with T lymphocyte activation than with plasma virus burden or virus chemokine coreceptor usage. J. Infect. Dis. 1999;179:859–870. doi: 10.1086/314660. - DOI - PubMed

Publication types