. 2022 Aug 26;5(1):877.
doi: 10.1038/s42003-022-03805-y.

MOG analogues to explore the MCT2 pharmacophore, α-ketoglutarate biology and cellular effects of N-oxalylglycine

Affiliations

MOG analogues to explore the MCT2 pharmacophore, α-ketoglutarate biology and cellular effects of N-oxalylglycine

Louise Fets et al. Commun Biol. .

Erratum in

Abstract

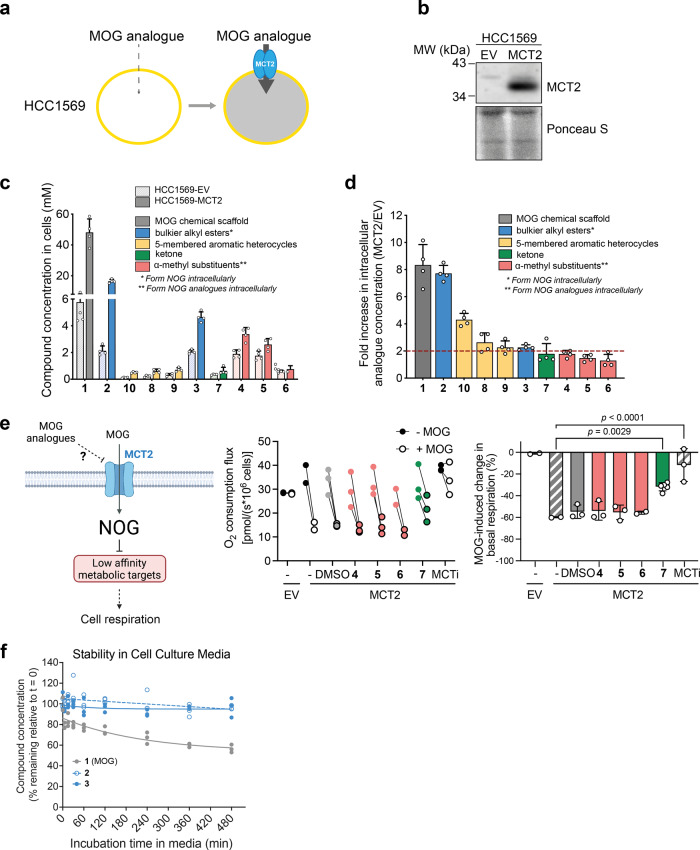
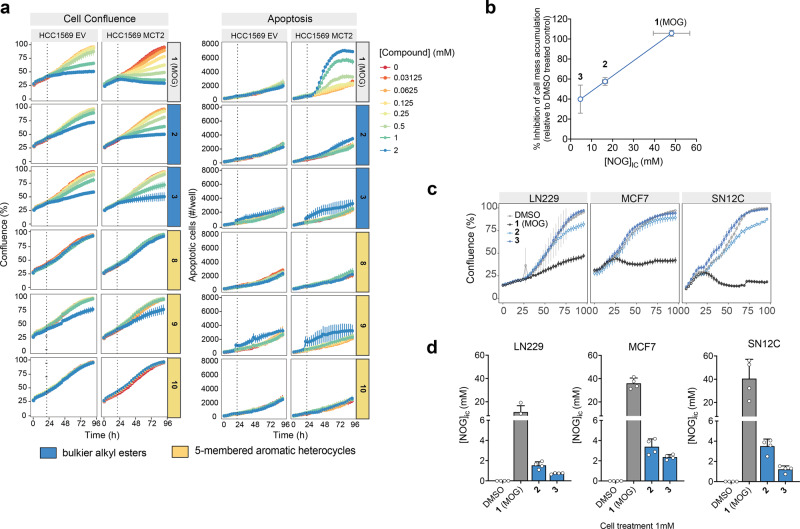
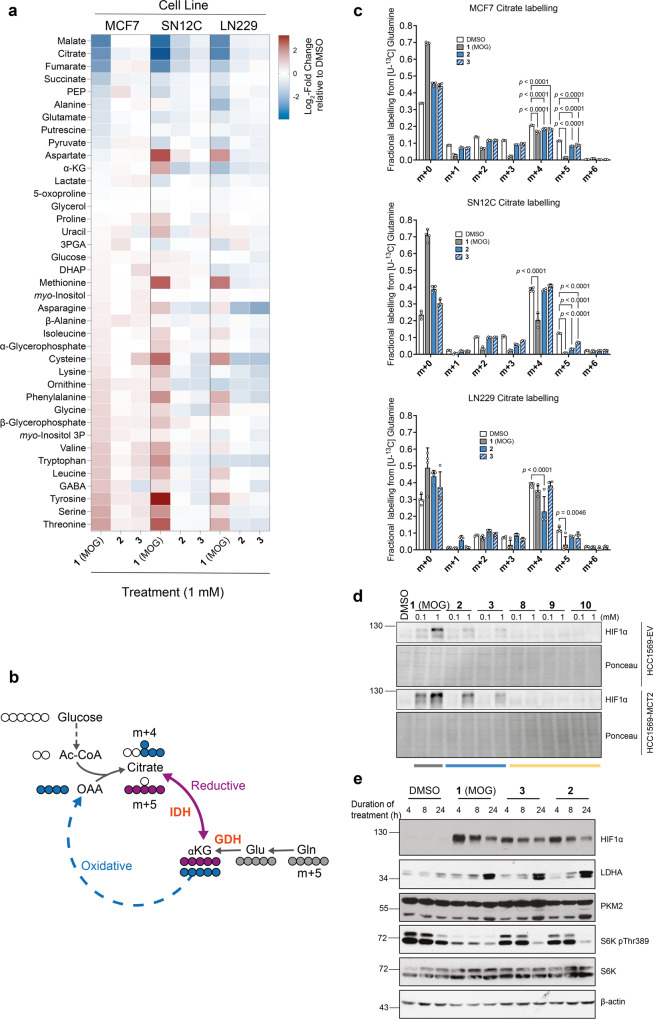
α-ketoglutarate (αKG) is a central metabolic node with a broad influence on cellular physiology. The αKG analogue N-oxalylglycine (NOG) and its membrane-permeable pro-drug derivative dimethyl-oxalylglycine (DMOG) have been extensively used as tools to study prolyl hydroxylases (PHDs) and other αKG-dependent processes. In cell culture media, DMOG is rapidly converted to MOG, which enters cells through monocarboxylate transporter MCT2, leading to intracellular NOG concentrations that are sufficiently high to inhibit glutaminolysis enzymes and cause cytotoxicity. Therefore, the degree of (D)MOG instability together with MCT2 expression levels determine the intracellular targets NOG engages with and, ultimately, its effects on cell viability. Here we designed and characterised a series of MOG analogues with the aims of improving compound stability and exploring the functional requirements for interaction with MCT2, a relatively understudied member of the SLC16 family. We report MOG analogues that maintain ability to enter cells via MCT2, and identify compounds that do not inhibit glutaminolysis or cause cytotoxicity but can still inhibit PHDs. We use these analogues to show that, under our experimental conditions, glutaminolysis-induced activation of mTORC1 can be uncoupled from PHD activity. Therefore, these new compounds can help deconvolute cellular effects that result from the polypharmacological action of NOG.


Conflict of interest statement

The authors declare no competing interests.

Figures

Fig. 1
Fig. 1. Design and synthesis of MOG analogues.
a Schematic (created with Biorender) depicting chemical structures for DMOG, MOG and NOG, their relative cell permeability and cellular targets depending on the intracellular NOG concentrations ([NOG]IC) they elicit). DMOG is converted to MOG and subsequently to the active αKG analogue NOG. DMOG is cell-permeable whereas MOG is transported via MCT2 leading to higher [NOG]IC compared to that elicited by DMOG. High [NOG]IC inhibits metabolic enzymes in addition to PHDs. NOG cannot pass through the plasma membrane. b Analysis of synthetic MOG stability over time in whole mouse blood by LC-MS (n = 3 technical replicates). c LC–MS analysis of DMOG stability in whole mouse blood over time (n = 3 technical replicates). DMOG is very rapidly converted to MOG, which is also unstable and subsequently forms NOG with similar kinetics to those of synthetic MOG measured in (b). Table shows calculated half-lives of DMOG conversion to MOG and subsequently NOG, or of synthetic MOG conversion to NOG from the data shown in panels (b and c). d Structures of MOG glycinate methyl ester replacement analogues designed, synthesised and reported in this work. (i) bulkier alkyl esters (2,3), (ii) α-methyl substituents (46), (iii) ketone analogue (7), (iv) 5-membered aromatic heterocycles (810). e Synthetic route for the preparation of MOG analogues 2-10 shown in panel (d).
Fig. 2
Fig. 2. MCT2-dependent entry into cells is maintained by alkyl ester and aromatic heterocycle MOG analogues.
a Schematic to illustrate the cell system used to assess dependence of MOG analogue cellular uptake on MCT2. HCC1569 human breast cancer cells were transduced with either an empty pBabePuro vector control (EV) or pBabePuro-MCT2 to stably express exogenous MCT2. b Western blot demonstrating expression of exogenous MCT2 in HCC1569-EV or HCC1569-MCT2 cells generated as described in (a). c Concentration of each of the analogues, or the indicated compounds they produce in cells, in HCC1569-EV or HCC1569-MCT2 cells incubated for 4 h with 1 mM of each of the indicated analogues (n = 4 independent wells, mean ± SD). d Fold-difference in intracellular concentration of each analogue, or the indicated compounds they produce in cells, in HCC1569-MCT2 cells relative to HCC1569-EV cells. Analogues with a >2-fold (dashed line) increase were considered to be taken up in an MCT2-dependent manner (n = 4, mean ± SD). e Left: Schematic (created with Biorender) illustrating the strategy for testing analogues 47 as putative MCT2 inhibitors). In cells treated with MOG, NOG inhibits metabolic enzymes and thereby leads to decreased respiration. Putative MCT2 inhibitors prevent MOG entry and are expected to attenuate MOG-induced inhibition of respiration. Right: Mean ± SD change in basal cellular respiration (calculated from the data shown in the middle panel) after treatment of INS1-EV or INS1-MCT2 cells with MOG in the presence or absence of the indicated MOG analogues. MOG does not inhibit respiration in the absence of exogenous MCT2 expression illustrating the specificity of the assay. AR-C155858 was used as a positive control for MCT2 inhibition. The ketone analogue 7 attenuates MOG-induced inhibition of respiration consistent with this compound being an MCT2 inhibitor. Significance tested using a one-way ANOVA with Dunnett’s test for multiple comparisons (n = 2–5 independent measurements). f LC-MS analysis to assess stability of MOG or the bulkier alkyl MOG analogues 2 and 3 in cell culture media over time (n = 3 independent replicates).
Fig. 3
Fig. 3. Analogues elicit lower [NOG]IC and decreased cytotoxicity compared to MOG.
a Confluence and apoptosis measurements, over time, of HCC1569-EV or HCC1569-MCT2 cells in the presence of MOG analogues added to cells at the indicated concentrations at 20 h (dotted line) (n = 3 independent wells, mean ± SD). b Degree of inhibition of cell mass accumulation after treatment with 1 mM of the indicated analogues (data from panel a) is proportional to the corresponding [NOG]IC elicited by each analogue. Error bars represent ± SD. c Confluence, over time, of MCF7, SN12C or LN229 cells in the presence of the indicated compounds added to cells at 16 h (n = 3 independent wells, mean ± SD). d [NOG]IC in MCF7, SN12C or LN229 cells treated with 1 mM of each of the indicated for 4 h (n = 4 independent wells, mean ± SD).
Fig. 4
Fig. 4. MOG analogues help deconvolute cellular effects of NOG elicited by inhibition of metabolic targets from those due to inhibition of PHDs.
a Heat map showing log2 fold-changes in the mean abundance of the indicated metabolites in MCF7, LN229 and SN12C cells treated for 4 h with the indicated compounds relative to DMSO (vehicle)-treated controls. Metabolites are ordered from the highest to the lowest fold-change values in the MCF7 MOG-treated condition. b. Schematic to demonstrate different routes of citrate synthesis and subsequent labelling patterns from [U-13C]-Glutamine. c Labelling of citrate from [U-13C]-Glutamine in MCF7, LN229 or SN12C cells treated with 1 mM of each of the indicated analogues for 4 h. n = 4 independent wells, mean ± SD; significance tested by multiple t-tests with Holm-Sidak correction for multiple comparisons. (* = p < 0.05, ** = p < 0.01, *** = p < 0.001). d Western blot showing HIF1α protein expression in HCC1569-EV or HCC1569-MCT2 cells treated with 0.1 or 1.0 mM of the indicated analogues, or with DMSO for 4 h. e Western blot showing protein levels of HIF1α, the HIF1α target gene protein products LDHA and PKM2, and the mTORC1 kinase substrate S6K (total and phosphorylated at Thr389) in lysates of MCF7 cells treated with 1 mM of the indicated compounds for 4, 8 or 24 h.

References

    1. Woolley DW. The revolution in pharmacology. Perspect. Biol. Med. 1958;1:174–197. - PubMed
    1. Méndez-Lucas A, et al. Identifying strategies to target the metabolic flexibility of tumours. Nat. Metab. 2020;2:335–350. - PMC - PubMed
    1. Liu X, et al. Cystine transporter regulation of pentose phosphate pathway dependency and disulfide stress exposes a targetable metabolic vulnerability in cancer. Nat Cell Biol. 2020;22:476–486. - PMC - PubMed
    1. Lu H, et al. Rational combination with PDK1 inhibition overcomes cetuximab resistance in head and neck squamous cell carcinoma. Jci Insight. 2019;4:e131106. - PMC - PubMed
    1. Luengo A, Gui DY, Heiden MGV. Targeting metabolism for cancer therapy. Cell Chem. Biol. 2017;24:1161–1180. - PMC - PubMed

Publication types

Substances