. 2022 Aug 26;12(1):14562.
doi: 10.1038/s41598-022-18921-2.

Exploring the mechanistic link between SF3B1 mutation and ring sideroblast formation in myelodysplastic syndrome

Affiliations

Exploring the mechanistic link between SF3B1 mutation and ring sideroblast formation in myelodysplastic syndrome

Tetsuro Ochi et al. Sci Rep. .

Abstract

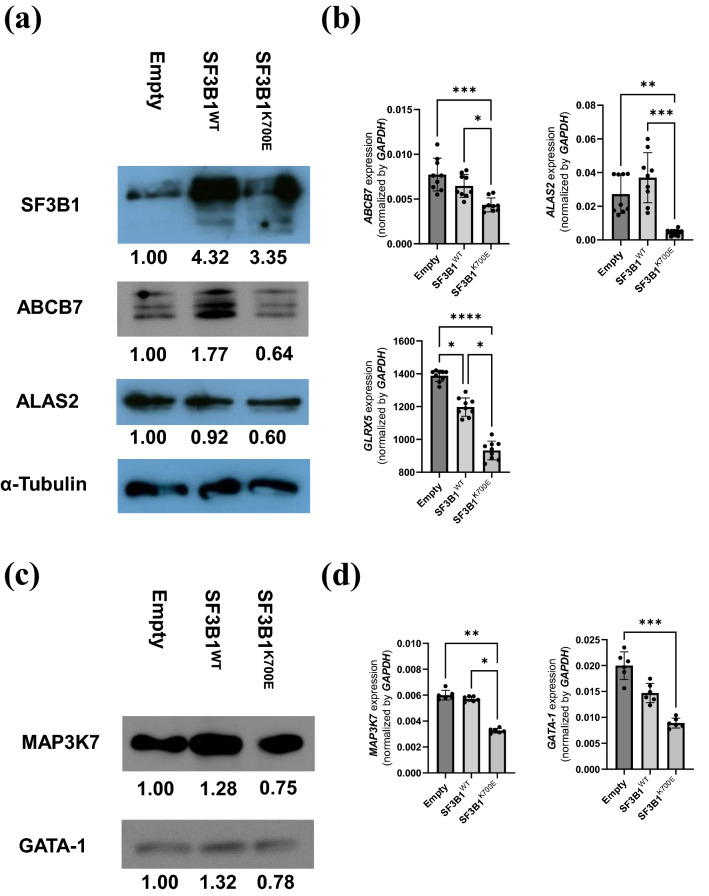
Acquired sideroblastic anemia, characterized by bone marrow ring sideroblasts (RS), is predominantly associated with myelodysplastic syndrome (MDS). Although somatic mutations in splicing factor 3b subunit 1 (SF3B1), which is involved in the RNA splicing machinery, are frequently found in MDS-RS, the detailed mechanism contributing to RS formation is unknown. To explore the mechanism, we established human umbilical cord blood-derived erythroid progenitor-2 (HUDEP-2) cells stably expressing SF3B1K700E. SF3B1K700E expressing cells showed higher proportion of RS than the control cells along with erythroid differentiation, indicating the direct contribution of mutant SF3B1 expression in erythroblasts to RS formation. In SF3B1K700E expressing cells, ABCB7 and ALAS2, known causative genes for congenital sideroblastic anemia, were downregulated. Additionally, mis-splicing of ABCB7 was observed in SF3B1K700E expressing cells. ABCB7-knockdown HUDEP-2 cells revealed an increased frequency of RS formation along with erythroid differentiation, demonstrating the direct molecular link between ABCB7 defects and RS formation. ALAS2 protein levels were obviously decreased in ABCB7-knockdown cells, indicating decreased ALAS2 translation owing to impaired Fe-S cluster export by ABCB7 defects. Finally, RNA-seq analysis of MDS clinical samples demonstrated decreased expression of ABCB7 by the SF3B1 mutation. Our findings contribute to the elucidation of the complex mechanisms of RS formation in MDS-RS.


Conflict of interest statement

The authors declare no competing interests.

Figures

Figure 1
Figure 1
RS formation of HUDEP-2 cells stably expressing SF3B1K700E after differentiation. (a) Representative micrograph of cytospin slides for differentiated HUDEP-2 cells stably expressing SF3B1K700E or controls. The upper photographs show slides stained with May–Grünwald–Giemsa stain, and the lower ones represent those stained with Prussian blue. Ring sideroblasts are indicated by black arrows. (b) RS proportion of differentiated HUDEP-2 cells stably expressing SF3B1K700E or controls are shown as mean ± SD and dot plots. (c) Representative electron micrographs of differentiated HUDEP-2 cells stably expressing SF3B1K700E or controls. Electron dense deposits in mitochondria are indicated by white arrows.
Figure 2
Figure 2
Gene expression analysis of HUDEP-2 cells stably expressing SF3B1K700E. (a) Western blot analysis for SF3B1, ABCB7, and ALAS2. Relative expression level of each gene in HUDEP-2 cells stably expressing SF3B1WT or SF3B1K700E in comparison to control vector-transduced HUDEP-2 cells are described under each picture. α-Tubulin was used as a loading control. The image of each protein was cropped from the different films. The original films are presented in Supplementary Fig. S6–9 online. (b) Expression levels of ABCB7, MAP3K7 and GLRX5 were measured by quantitative RT-PCR (results shown as mean ± SD and dot plots); * p < 0.05, ** p < 0.01, *** p < 0.001, **** p < 0.0001. (c) Western blot analysis for MAP3K7 and GATA-1. Relative expression level of each gene in HUDEP-2 cells stably expressing SF3B1WT or SF3B1K700E in comparison to control vector-transduced HUDEP-2 cells is described under each picture. α-Tubulin was used as a loading control (a). The image of each protein was cropped from the different films. The original films are presented in Supplementary Fig. S10–11 online. (d) Expression levels of MAP3K7 and GATA-1 were measured by quantitative RT-PCR (results shown as mean ± SD and dot plots); * p < 0.05, ** p < 0.01, *** p < 0.001.
Figure 3
Figure 3
Detection of A3SS events in ABCB7 and MAP3K7 with HUDEP-2 cells stably expressing SF3B1K700E with or without CHX treatment. (a-b) Read-coverage visualized by IGV around canonical 3′ SS of ABCB7 exon 9 (a) and canonical 3′ SS of MAP3K7 exon 5 (b). Black and red arrow indicate canonical and aberrant 3′ SS, respectively. Empty, SF3B1WT and SF3B1K700E indicate HUDEP-2 cells transduced with control vector, HUDEP-2 cells stably expressing SF3B1WT and HUDEP-2 cells stably expressing SF3B1K700E, respectively. NT and CHX indicate the non-treated samples and the samples treated with CHX, respectively.
Figure 4
Figure 4
Gene expression analysis of K562 cells overexpressing SF3B1K700E. (a) Western blot analysis for FLAG, SF3B1, ABCB7, MAP3K7, ALAS2, and GATA-1. Relative expression level of each gene in K562 cells expressing SF3B1WT or SF3B1K700E in comparison to control vector-transduced K562 cells are described under each picture. α-Tubulin was used as a loading control. The image of each protein was cropped from the different fields of the film. The original film is presented in Supplementary Fig. S17–21 online. (b) Expression levels of ABCB7, MAP3K7 and GATA-1 by quantitative RT-PCR (results shown as mean ± SD and dot plots); ** p < 0.01, *** p < 0.001. (c) Comprehensive AS analysis with MISO. The graph shows the number of significant AS events detected in K562 cells stably expressing SF3B1WT or SF3B1K700E when compared with control vector-transduced K562 cells. (d, e) Read-coverage visualized by IGV around canonical 3′ SS of ABCB7 exon 9 (d) and canonical 3′ SS of MAP3K7 exon 5 (e). Black and red arrow indicate canonical and aberrant 3′ SS, respectively. Empty, SF3B1WT and SF3B1K700E indicate K562 cells transduced with control vector, K562 cells overexpressing SF3B1WT and K562 cells overexpressing SF3B1K700E, respectively.
Figure 5
Figure 5
Analysis of ABCB7-knockdown HUDEP-2 cells. (a) Expression levels of ABCB7 by quantitative RT-PCR (results shown as mean ± SD and dot plots) in undifferentiated and differentiated ABCB7-knockdown HUDEP-2 cells; * p < 0.05, ** p < 0.01. (b) Western blot analysis for ALAS2, ABCB7 and α-Tubulin in undifferentiated ABCB7-knockdown HUDEP-2 cells. Relative expression levels of ALAS2 and ABCB7 in ABCB7-knockdown HUDEP-2 cells in comparison to control shRNA-transduced HUDEP-2 cells described under the picture. α-Tubulin was used as a loading control. The image of each protein was cropped from the different fields of the film. The original film is presented in Supplementary Fig. S23-24 online. (c) Expression levels of ALAS2 by quantitative RT-PCR (results shown as mean ± SD and dot plots) in undifferentiated ABCB7-knockdown HUDEP-2 cells. (d) Representative micrograph of cytospin slides for differentiated ABCB7-knockdown HUDEP-2 cells. The upper photographs show slides stained with May–Grünwald–Giemsa stain, and the lower ones represent those stained with Prussian blue. Ring sideroblasts are indicated by black arrows. Control, shRNA5, and shRNA6 represent HUDEP-2 cells transduced with control shRNA, HUDEP-2 cells transduced with ABCB7 shRNA clone 5, and HUDEP-2 cells transduced with ABCB7 shRNA clone 6, respectively.
Figure 6
Figure 6
Gene ontology enrichment analysis of dysregulated genes in ABCB7-knockdown HUDEP-2 cells. Enrichment heatmap of genes (a) upregulated and (b) downregulated by ABCB7-knockdown. ABCB7_shRNA5 and ABCB7_shRNA6 indicate HUDEP-2 cells transduced with ABCB7 shRNA clone 5 and HUDEP-2 cells transduced with ABCB7 shRNA clone 6, respectively.
Figure 7
Figure 7
Analysis of MDS clinical samples. (a) RNA-seq analysis of ABCB7 and MAP3K7 expression levels in SF3B1WT- or SF3B1MUT-MDS patients diagnosed at Tohoku University Hospital; * p < 0.05. (b, c) Read-coverage visualized with IGV around canonical 3′ SS of ABCB7 exon 9 (b) and of MAP3K7 exon 5 (c) in representative MDS patients diagnosed at Tohoku University Hospital. SF3B1WT- or SF3B1MUT-MDS-T refers to the RNA-seq data of MDS patients diagnosed at Tohoku University Hospital.
Figure 8
Figure 8
Proposed mechanism for RS formation in SF3B1MUT-MDS. A3SS usage in ABCB7, MAP3K7, and RNH1 is promoted by the spliceosome containing the mutant SF3B1. Targeting of increased mis-spliced ABCB7 mRNA by NMD contributes to the downregulation of ABCB7, resulting in reduced translation of ALAS2 through an enhanced IRP1-IRE system induced by reduced cytosolic Fe–S cluster. Increased mis-spliced MAP3K7 mRNA, also targeted by NMD, contributes to the downregulation of MAP3K7, causing deterioration of GATA-1 function through the reduction in phosphorylated p38MAPK, as previously described. Mis-splicing in the 5′ UTR of RNH1 might impair translation of RNH1, leading to downregulation of RNH1, which was reported to downregulate GATA-1 by inhibition of translation. Thus, transcription of ALAS2 is reduced owing to decreased GATA-1 function induced by downregulation of MAP3K7, and perhaps RNH1. In conclusion, downregulation of ALAS2 at both the transcriptional and translational levels because of mutant SF3B1-induced mis-splicing in ABCB7, MAP3K7, and possibly RNH1 could be considered the underlying mechanism of RS formation in SF3B1MUT-MDS. Moreover, downregulation of ABCB7 and GLRX5 also promoted RS formation by accelerating mitochondrial iron accumulation through decreased Fe–S cluster export from the mitochondria and decreased production of Fe–S cluster, resulting in decreased use of mitochondrial free iron. p-p38MAPK indicates phosphorylated p38MAPK.

References

    1. Fujiwara T, Harigae H. Molecular pathophysiology and genetic mutations in congenital sideroblastic anemia. Free Radic. Biol. Med. 2019;133:179–185. doi: 10.1016/j.freeradbiomed.2018.08.008. - DOI - PubMed
    1. Harigae H, Furuyama K. Hereditary sideroblastic anemia: Pathophysiology and gene mutations. Int. J. Hematol. 2010;92:425–431. doi: 10.1007/s12185-010-0688-4. - DOI - PubMed
    1. Ducamp S, Fleming MD. The molecular genetics of sideroblastic anemia. Blood. 2019;133:59–69. doi: 10.1182/blood-2018-08-815951. - DOI - PMC - PubMed
    1. Camaschella C. Hereditary sideroblastic anemias: Pathophysiology, diagnosis, and treatment. Semin. Hematol. 2009;46:371–377. doi: 10.1053/j.seminhematol.2009.07.001. - DOI - PubMed
    1. Nikpour M, et al. Gene expression profiling of erythroblasts from refractory anaemia with ring sideroblasts (RARS) and effects of G-CSF. Br. J. Haematol. 2010;149:844–854. doi: 10.1111/j.1365-2141.2010.08174.x. - DOI - PubMed

Publication types