

Evaluation of a training intervention to improve cancer care in Zimbabwe: Strategies to Improve Kaposi Sarcoma Outcomes (SIKO), a prospective community-based stepped-wedge cluster randomized trial
- PMID: 36028920
- PMCID: PMC9418419
- DOI: 10.1002/jia2.25998
Evaluation of a training intervention to improve cancer care in Zimbabwe: Strategies to Improve Kaposi Sarcoma Outcomes (SIKO), a prospective community-based stepped-wedge cluster randomized trial
Abstract
Introduction: Most Zimbabweans access medical care through tiered health systems. In 2013, HIV care was decentralized to primary care clinics; while oncology care remained centralized. Most persons in Zimbabwe with Kaposi sarcoma (KS) are diagnosed late in their disease, and the prognosis is poor. Little is known about whether educational interventions could improve KS outcomes in these settings.
Methods: Interventions to improve KS detection and management were evaluated at eight Zimbabwe primary care sites (four rural/four urban) that provided HIV care. Interventions included a standardized KS clinical evaluation tool, palliative care integration, standardized treatment and improved consultative services. Interventions were implemented between February 2013 and January 2016 using a randomized stepped-wedge cluster design. Sites were monitored for KS diagnosis rates and KS outcomes, including early diagnosis (T0 vs. T1 tumour stage), participant retention and mortality. Analyses controlled for within-clinic correlations.
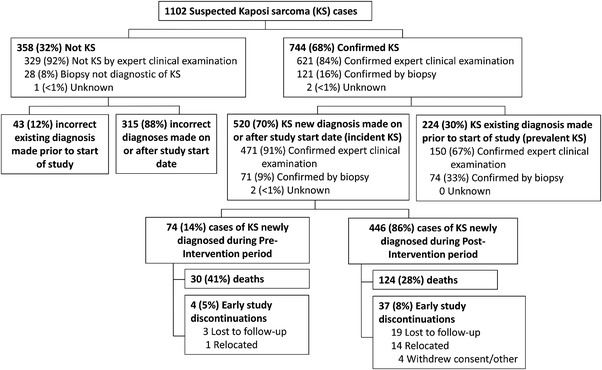
Results: A total of 1102 persons with suspected KS (96% HIV positive) were enrolled: 47% incident (new diagnosis), 20% prevalent (previous diagnosis) and 33% determined as not KS. Early (T0) diagnosis increased post-intervention, though not significant statistically (adjusted odds ratio [aOR] = 1.48 [95% confidence interval (95% CI): 0.66-3.79], p = 0.37). New KS diagnosis rates increased 103% (95% CI: 11-273%), p = 0.02) post-intervention; although paired with an increased odds of incorrectly diagnosing KS (aOR = 2.08 [95% CI: 0.33-3.24], p = 0.001). Post-intervention, non-significant decreases in 90-day return rates (adjusted hazard ratio [aHR] = 0.69 [95% CI: 0.38-1.45], p = 0.21) and survival (aHR = 1.36 [95% CI: 0.85-2.20], p = 0.20) were estimated.
Conclusions: KS training interventions at urban and rural Zimbabwe decentralized primary care clinics significantly increased overall and incorrect KS diagnosis rates, but not early KS diagnosis rates, 90-day return rates or survival.
Trial registration: ClinicalTrials.gov NCT01764360.
Keywords: HIV; KS; Kaposi sarcoma; palliative care; primary community care; training intervention tools.
© 2022 The Authors. Journal of the International AIDS Society published by John Wiley & Sons Ltd on behalf of the International AIDS Society.
Conflict of interest statement
No competing interests were reported by any authors.
Figures


References
-
- Chokunonga E, Borok MZ, Chingonzoh T, Chirenje ZM, Makunike‐Mutsa R, Manangazira P, et al. Pattern of cancer in Zimbabwe in 2016. Zimbabwe National Cancer Registry (ZNCR); 2018.
-
- Nelson BC, Borok MZ, Mhlanga TO, Makadzange AT, Campbell TB. AIDS‐associated Kaposi sarcoma: outcomes after initiation of antiretroviral therapy at a university‐affiliated hospital in urban Zimbabwe. Int J Infect Dis. 2013;17:e902–6. - PubMed
-
- Kingham TP, Alatise OI, Vanderpuye V, Casper C, Abantanga FA, Kamara TB, et al. Treatment of cancer in sub‐Saharan Africa. Lancet Oncol. 2013;14:e158‐67. - PubMed
-
- Singogo E, Keegan TJ, Diggle PJ, van Lettow M, Matengeni A, van Oosterhout JJ, et al. Differences in survival among adults with HIV‐associated Kaposi's sarcoma during routine HIV treatment initiation in Zomba district, Malawi: a retrospective cohort analysis. Int Health. 2017;9:281‐7. - PubMed
-
- Borok M, Fiorillo S, Gudza I, Putnam B, Ndemera B, White IE, et al. Evaluation of plasma human herpesvirus 8 DNA as a marker of clinical outcomes during antiretroviral therapy for AIDS‐related Kaposi sarcoma in Zimbabwe. Clin Infect Dis. 2010;51:342‐9. - PubMed
Publication types
MeSH terms
Associated data
Grants and funding
LinkOut - more resources
Full Text Sources
Medical
