. 2023 Apr 1;77(4):1319-1334.
doi: 10.1002/hep.32756. Epub 2022 Oct 11.

RIPK3 dampens mitochondrial bioenergetics and lipid droplet dynamics in metabolic liver disease

Affiliations

RIPK3 dampens mitochondrial bioenergetics and lipid droplet dynamics in metabolic liver disease

Marta B Afonso et al. Hepatology. .

Abstract

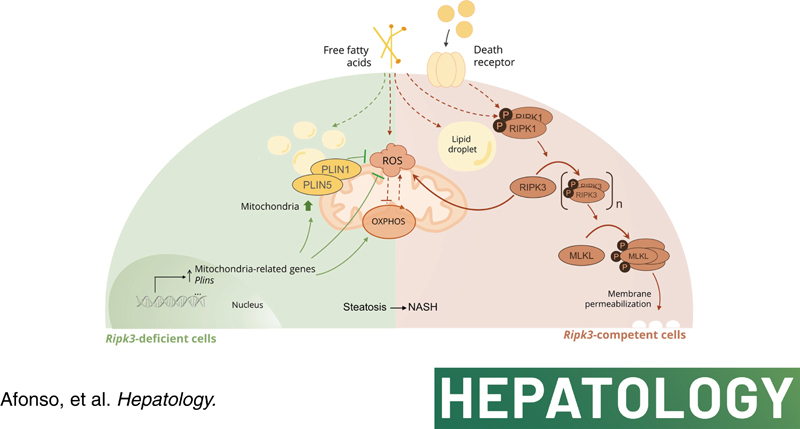
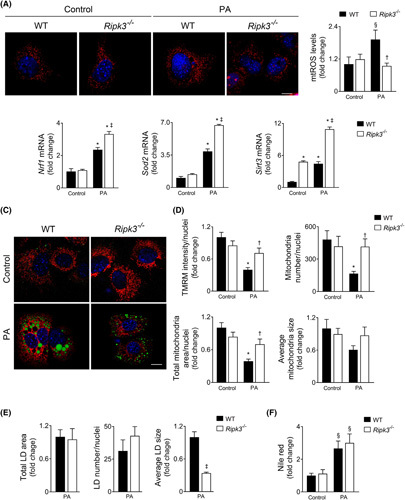
Background and aims: Receptor-interacting protein kinase 3 (RIPK3) mediates NAFLD progression, but its metabolic function is unclear. Here, we aimed to investigate the role of RIPK3 in modulating mitochondria function, coupled with lipid droplet (LD) architecture in NAFLD.

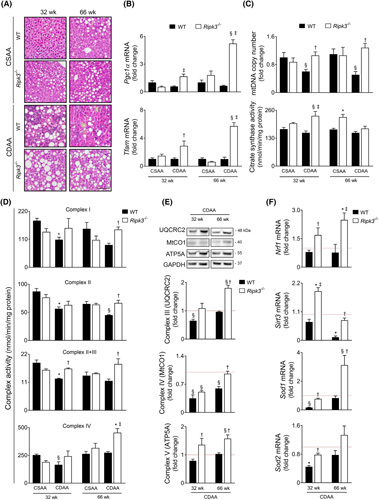
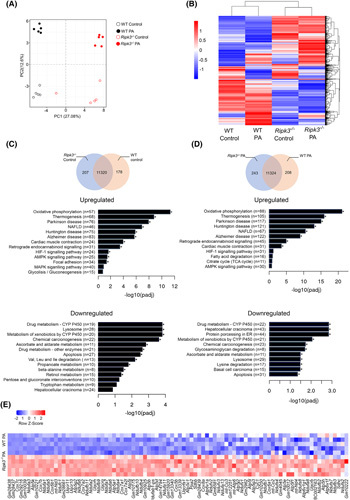
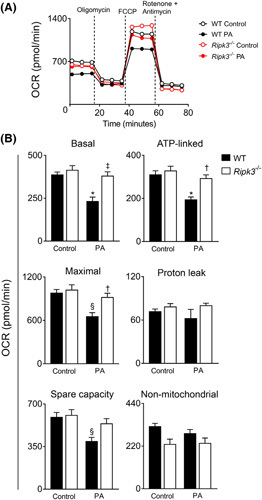
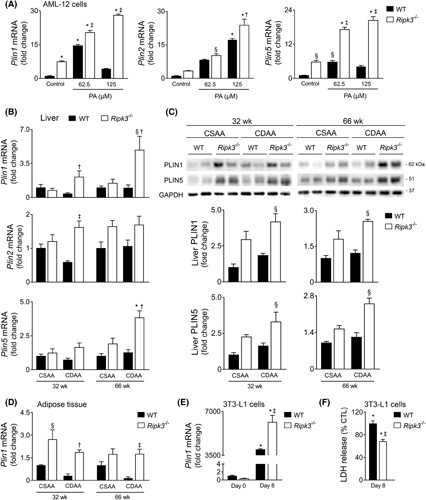
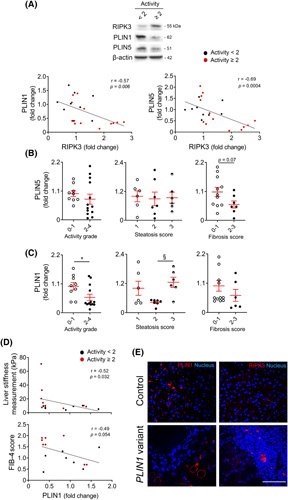
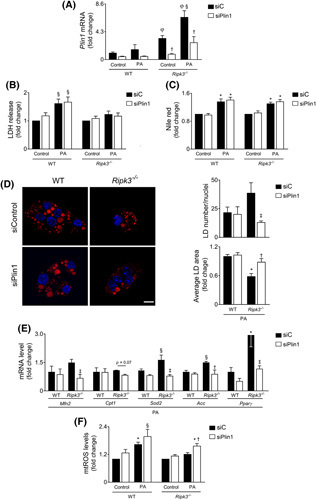
Approach and results: Functional studies evaluating mitochondria and LD biology were performed in wild-type (WT) and Ripk3-/- mice fed a choline-deficient, amino acid-defined (CDAA) diet for 32 and 66 weeks and in CRISPR-Cas9 Ripk3 -null fat-loaded immortalized hepatocytes. The association between hepatic perilipin (PLIN) 1 and 5, RIPK3, and disease severity was also addressed in a cohort of patients with NAFLD and in PLIN1 -associated familial partial lipodystrophy. Ripk3 deficiency rescued impairment in mitochondrial biogenesis, bioenergetics, and function in CDAA diet-fed mice and fat-loaded hepatocytes. Ripk3 deficiency was accompanied by a strong upregulation of antioxidant systems, leading to diminished oxidative stress upon fat loading both in vivo and in vitro. Strikingly, Ripk3-/- hepatocytes displayed smaller size LD in higher numbers than WT cells after incubation with free fatty acids. Ripk3 deficiency upregulated adipocyte and hepatic levels of LD-associated proteins PLIN1 and PLIN5. PLIN1 upregulation controlled LD structure and diminished mitochondrial stress upon free fatty acid overload in Ripk3-/- hepatocytes and was associated with diminished human NAFLD severity. Conversely, a pathogenic PLIN1 frameshift variant was associated with NAFLD and fibrosis, as well as with increased hepatic RIPK3 levels in familial partial lipodystrophy.

Conclusions: Ripk3 deficiency restores mitochondria bioenergetics and impacts LD dynamics. RIPK3 inhibition is promising in ameliorating NAFLD.


Conflict of interest statement

The authors have no conflicts to report.

Figures

None
Graphical abstract
FIGURE 1
FIGURE 1
Ripk3 deficiency rescues mitochondrial biogenesis, mitochondria respiratory chain (MRC) activity, and reactive oxygen species scavenging systems in choline‐deficient, amino acid‐defined (CDAA) diet–induced experimental NASH. C57BL/6 wild‐type (WT) or Ripk3 −/− mice were fed a CDAA or an isocaloric control choline‐sufficient L‐amino acid‐defined (CSAA) diet for 32 or 66 weeks. (A) Representative images of hematoxylin and eosin–stained liver sections. Scale bar = 100 μM. (B) qRT‐PCR analysis of Pgc1α and Tfam in mouse liver. (C) Quantification of relative mitochondrial DNA copy number assessed by qPCR analysis of mitochondria‐encoded gene mt‐Co1. Nuclear Rn18s was used as loading control (top); and citrate synthase activity determined as described in Supplementary Materials and Methods (bottom). (D) MRC activity determined as described in Supplementary Materials and Methods. (E) Immunoblotting and densitometry of oxidative phosphorylation protein complexes in mouse liver, namely UQCRC2 (CIII), mtCO1 (CIV), and ATP5A (CV). Blots were normalized to endogenous GAPDH. F. qRT‐PCR analysis of Nrf1, Sod1, Sod2, and Sirt3 in mouse liver. Results are expressed as mean ± SEM arbitrary units or fold change of 6–7 individual mice. Red dashed line represents the CSAA diet‐fed WT mice levels. § p < 0.05 and *p < 0.01 from CSAA diet‐fed WT mice; p < 0.05 and p < 0.01 from CDAA diet‐fed WT mice.
FIGURE 2
FIGURE 2
Ripk3 deficiency shifts the hepatocyte transcriptome. Wild‐type (WT) and Ripk3 −/− AML‐12 cells were treated with 125 μM palmitate (PA) for 24 h. (A) Score scatter plot corresponding to a principal component analysis (PCA) of the RNA sequencing data. Each individual is represented by one dot. (B) Heatmap of RNA‐Seq expression z scores computed for all genes that are differentially expressed between (padj ≤ 0.05, |log2FoldChange| ≥ 0), where red indicates overexpressed transcripts and blue represents underexpressed transcripts. (C) Venn diagrams showing genes expressed in unchallenged Ripk3 −/− versus WT hepatocytes. Kyoto Encyclopedia of Genes and Genomes (KEGG) pathway enrichment analysis of upregulated and downregulated differentially expressed genes (DEGs). (D) Venn diagrams showing genes expressed in PA‐treated Ripk3 −/− versus WT hepatocytes. KEGG pathway enrichment analysis of upregulated and downregulated DEGs. (E) Heatmap of z scores of DEGs associated with the KEGG pathways oxidative phosphorylation relative to the comparison Ripk3 −/− versus WT hepatocytes treated with PA. Each row in the heatmap is an individual sample. Red indicates overexpressed transcripts and blue represents underexpressed transcripts. *p < 0.05 from respective control.
FIGURE 3
FIGURE 3
Ripk3 deficiency improves hepatocyte mitochondrial bioenergetics following palmitate (PA) treatment in AML‐12 cells. Wild‐type (WT) and Ripk3 −/− AML‐12 cells were treated with 62.5 μM PA for 48 h. (A) Respiratory flux profiles of cells were determined using a Seahorse extracellular flux analyzer as described in Supplementary Materials and Methods. (B) Quantification of bioenergetic parameters including oxygen consumption rate (OCR) associated with basal respiration, ATP‐linked, maximal respiration capacity, proton leak, spare capacity, and nonmitochondrial respiration. Results are expressed as mean ± SEM arbitrary units of four independent experiments. § p < 0.05 and *p < 0.01 from control; p < 0.05 from and p < 0.01 from respective control.
FIGURE 4
FIGURE 4
Ripk3 deficiency dampens hepatocyte mitochondrial reactive oxygen species (ROS) following palmitate treatment in AML‐12 cells. Wild‐type (WT) and Ripk3 −/− AML‐12 cells were treated with 125 μM palmitate (PA) for 24 h. (A) Representative staining for MitoSOX Red (red). Nuclei were counterstained with Hoechst 33258 (blue). Scale bar = 85 μM. Histogram shows the quantification of mitochondrial ROS. (B) qRT‐PCR analysis of Nfr1, Sod2, and Srit3 in AML‐12 cells. (C) Representative staining for tetramethylrhodamine methyl ester perchlorate (TMRM) (red), LipidTOX Green (green), and Hoechst 33342 (blue) for mitochondrial network, neutral LD, mitochondrial superoxide, and nuclei, respectively. Scale bar = 85 μM. (D) Histograms show the quantification of TMRM intensity and number, area, and average size of mitochondria. (E) Histograms show the quantification of total area, average size, and number of lipid droplets. (F) Fluorometric measurement of Nile red staining normalized by SRB method. Results are expressed as mean ± SEM fold change or percentage of four independent cultures from each genotype § p < 0.05 and *p < 0.01 from control; p < 0.05 from and p < 0.01 from respective control.
FIGURE 5
FIGURE 5
Ripk3 deficiency upregulates lipid droplets coat proteins in hepatocytes in vitro and in vivo. (A) qRT‐PCR analysis of Plin1, Plin2, Plin5 in wild‐type (WT) and Ripk3 −/− AML‐12 cells treated with 62.5 or 125 μM palmitate for 24 h. (B) qRT‐PCR analysis of Plin1, Plin2, Plin5 in the liver of C57BL/6 WT or Ripk3 −/− mice fed a choline‐deficient, amino acid‐defined (CDAA) or an isocaloric control choline‐sufficient L‐amino acid‐defined (CSAA) diet for 32 or 66 weeks. (C) Immunoblotting and densitometry of PLIN1 and PLIN5 in the liver of C57BL/6 WT or Ripk3 −/− mice fed a CDAA or CSAA diet for 32 or 66 weeks. Blots were normalized to endogenous GAPDH. Representative immunoblots are shown. (D) qRT‐PCR analysis of Plin1 in the white adipose tissue of C57BL/6 WT or Ripk3 −/− mice fed a CDAA or an isocaloric control CSAA diet for 32 or 66 weeks. (E) qRT‐PCR analysis of Plin1 in WT and Ripk3 −/− 3 T3‐L1 cells before (day 0) and after differentiation in adipocytes (day 8). (F) Percentage of released LDH in differentiated adipocytes relative to undifferentiated 3 T3‐L1 cells, as surrogate of general cells death. Results are expressed as mean ± SEM fold change or percentage to control of three to four independent in vitro experiments or six to seven individual mice. § p < 0.05 and *p < 0.01 from CSAA diet‐fed WT mice; p < 0.05 and p < 0.01 from CDAA diet‐fed WT mice.
FIGURE 6
FIGURE 6
Ripk3 deficiency associates with augmented hepatic perilipin (PLIN)1 and PLIN5 in patients with NAFLD. (A) Representative immunoblots of RIPK3 and PLIN1 and PLIN5 in the liver of patients from an NAFLD cohort (n = 22) and their Spearman correlation scatter plot. Blots were normalized to endogenous β‐actin. Densitometry of PLIN1 (B) and PLIN5 (C) according to activity grade, steatosis score, and fibrosis score. Activity score in patients with NAFLD corresponds to the unweighted addition of hepatocyte ballooning and lobular inflammation as described in Supplementary Materials and Methods. (D) Spearman correlation scatter plot of hepatic PLIN1 with liver stiffness measurement assessed by FribroScan and Fibrosis‐4 (FIB4) score in patients with NAFLD. Each individual is represented by one dot. Data are expressed as mean ± SEM arbitrary units or fold change. § p < 0.05 and *p < 0.01 compared with respective controls. (E) Representative immunostaining of PLIN1 (left) and RIPK3 (right) in liver tissue from a healthy control (top) and a patient with familial partial lipodystrophy type 4 carrying a PLIN1 frameshift variant (bottom). Nuclei were counterstained with Hoechst 33258 (blue). Scale bar = 100 μM.
FIGURE 7
FIGURE 7
PLIN1 upregulation in Ripk3‐deficient hepatocytes controls lipid droplet structure and diminished mitochondrial stress upon free fatty acid overload. Wild‐type (WT) and Ripk3 −/− AML‐12 hepatocytes were transfected with an siRNA‐targeting Plin1 (siPlin1) or a scrambled control (siC) for 24 h. Then, cells were loaded with 125 μM palmitate (PA) or vehicle control for 24 h. (A) qRT‐PCR analysis of Plin1 in AML‐12 cells. (B) General cell death as assessed by the lactate dehydrogenase (LDH) release assay. (C) Fluorometric measurement of Nile red staining normalized by SRB method. § p < 0.05 and *p < 0.01 from control; p < 0.05 from respective control. φ p < 0.01 from WT control. Data are expressed as mean ± SEM fold change for WT control of four independent experiments. (D) Representative staining for Nile Red (red) and Hoechst 33342 (blue) for neutral lipid droplet (LD) and nuclei, respectively. Scale bar = 15 μM. Histograms show the quantification of number and area of LD. (E) qRT‐PCR analysis of Mfn2, Cpt1a, Sod2, Acc, and Pparγ in AML‐12 cells. Data are expressed as mean ± SEM fold change for WT PA of four independent experiments. (F) Mitochondrial reactive oxygen species as determined by the fluorometric measurement of MitoSOX Red. Data are expressed as mean ± SEM fold change for WT control of four independent experiments. § p < 0.05 and *p < 0.01 from WT control; p < 0.05 from and p < 0.01 from respective control.

References

    1. Tilg H, Moschen AR. Evolution of inflammation in nonalcoholic fatty liver disease: the multiple parallel hits hypothesis. Hepatology. 2010;52:1836–46. - PubMed
    1. Galluzzi L, Vitale I, Aaronson SA, Abrams JM, Adam D, Agostinis P, et al. . Molecular mechanisms of cell death: recommendations of the Nomenclature Committee on Cell Death 2018. Cell Death Differ. 2018;25:486–541. - PMC - PubMed
    1. Afonso MB, Rodrigues PM, Carvalho T, Caridade M, Borralho P, Cortez‐Pinto H, et al. . Necroptosis is a key pathogenic event in human and experimental murine models of non‐alcoholic steatohepatitis. Clin Sci (Lond). 2015;129:721–39. - PubMed
    1. Gautheron J, Vucur M, Reisinger F, Vargas Cardenas D, Roderburg C, Koppe C, et al. . A positive feedback loop between RIP3 and JNK controls non‐alcoholic steatohepatitis. EMBO Mol Med. 2014;6:1062–74. - PMC - PubMed
    1. Majdi A, Aoudjehane L, Ratziu V, Islam T, Afonso MB, Conti F, et al. . Inhibition of receptor‐interacting protein kinase 1 improves experimental non‐alcoholic fatty liver disease. J Hepatol. 2020;72:627–35. - PubMed

Publication types

MeSH terms

Substances