

Among high responders, is oocyte development potential different in Rotterdam consensus PCOS vs non-PCOS patients undergoing IVF?
- PMID: 36029372
- PMCID: PMC9596635
- DOI: 10.1007/s10815-022-02598-7
Among high responders, is oocyte development potential different in Rotterdam consensus PCOS vs non-PCOS patients undergoing IVF?
Abstract
Purpose: To evaluate the oocyte potential to develop to blastocyst in Rotterdam consensus PCOS in women with hyper-responses requiring freeze-all embryos.
Methods: Retrospective, single-academic center, cohort study of 205 patients who underwent freeze-all antagonist IVF cycles for OHSS risk between 2013 and 2019. Women in the PCOS group (n = 88) were diagnosed per the 2003 Rotterdam criteria. Control patients (n = 122) had no evidence of hyperandrogenism or menstrual disturbance. Data was compared by t-tests, chi-squared tests, or multivariate logistic regression (SPSS). Frozen blastocysts were Gardner's grade BB or better.
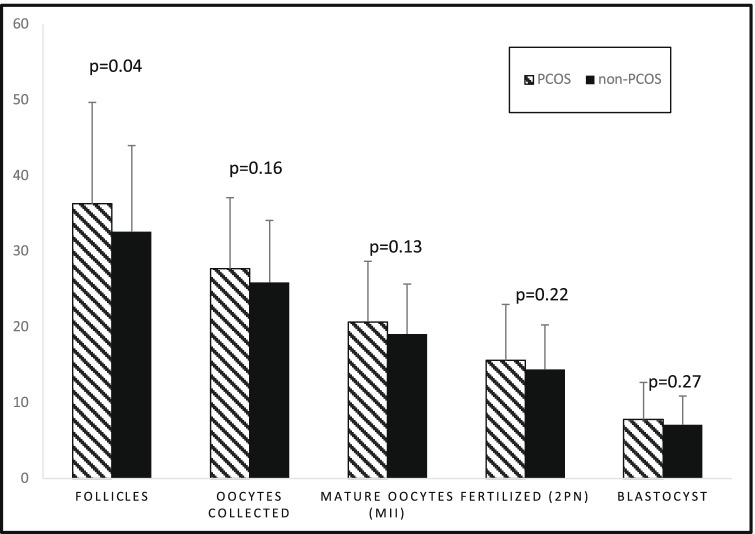
Results: There was no difference in terms of number of oocytes collected (PCOS vs non-PCOS 27.7 ± 9.4 vs 25.9 ± 8.2, p = 0.157), number of MII (20.7 ± 8.0 vs 19.1 ± 6.6, p = 0.130), number of 2PN fertilized (15.6 ± 7.4 vs 14.4 ± 5.9, p = 0.220), and number of frozen blastocysts (7.8 ± 4.9 vs 7.1 ± 3.8, p = 0.272). In addition, fertilization rates (74 ± 17% vs 75 ± 17%, p = 0.730), blastulation rates per 2PN (51 ± 25% vs 51 ± 25%, p = 0.869), and blastulation rates per mature oocytes (37 ± 18% vs 37 ± 15%, p = 0.984) were all comparable between PCOS and controls, respectively. Moreover, there was no difference when comparing PCOS and controls in pregnancy rates (45/81 vs 77/122, p = 0.28) and clinical pregnancy rates (34/81 vs 54/122, p = 0.75), respectively. Multivariate logistic regression controlling for confounders failed to alter these results.
Conclusion: PCOS subjects do not seem to have altered oocyte potential as measured by number of MII oocytes collected, fertilization, and blastulation rates when compared to high-responder controls, with similar magnitude of stimulation.
Keywords: Fertilization rate; IVF; OHSS; Oocyte quality; PCOM; PCOS.
© 2022. The Author(s), under exclusive licence to Springer Science+Business Media, LLC, part of Springer Nature.
Conflict of interest statement
The authors declare no competing interests.
Figures
References
MeSH terms
LinkOut - more resources
Full Text Sources
Medical
