Randomized Controlled Trial
. 2022 Sep 20;3(9):100712.
doi: 10.1016/j.xcrm.2022.100712. Epub 2022 Aug 26.

Source of human milk (mother or donor) is more important than fortifier type (human or bovine) in shaping the preterm infant microbiome

Affiliations
Randomized Controlled Trial

Source of human milk (mother or donor) is more important than fortifier type (human or bovine) in shaping the preterm infant microbiome

Shreyas V Kumbhare et al. Cell Rep Med. .

Abstract

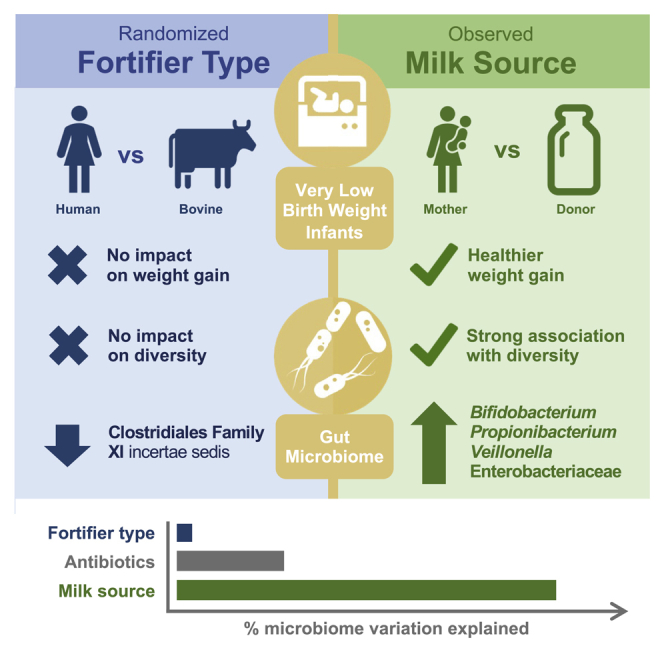
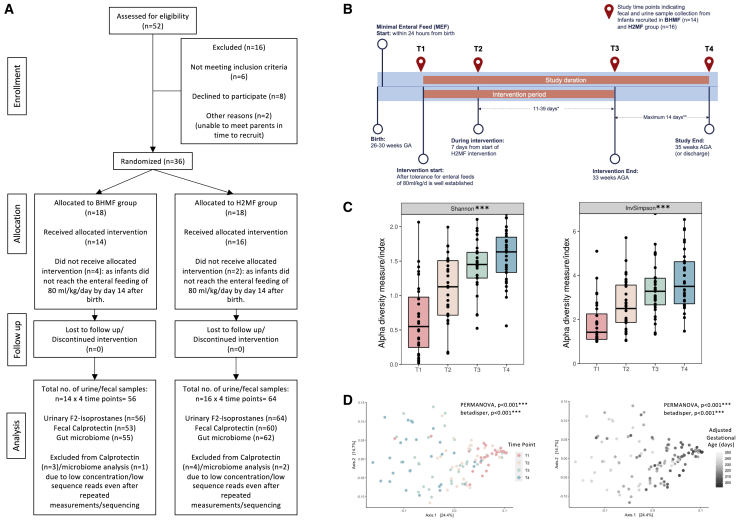
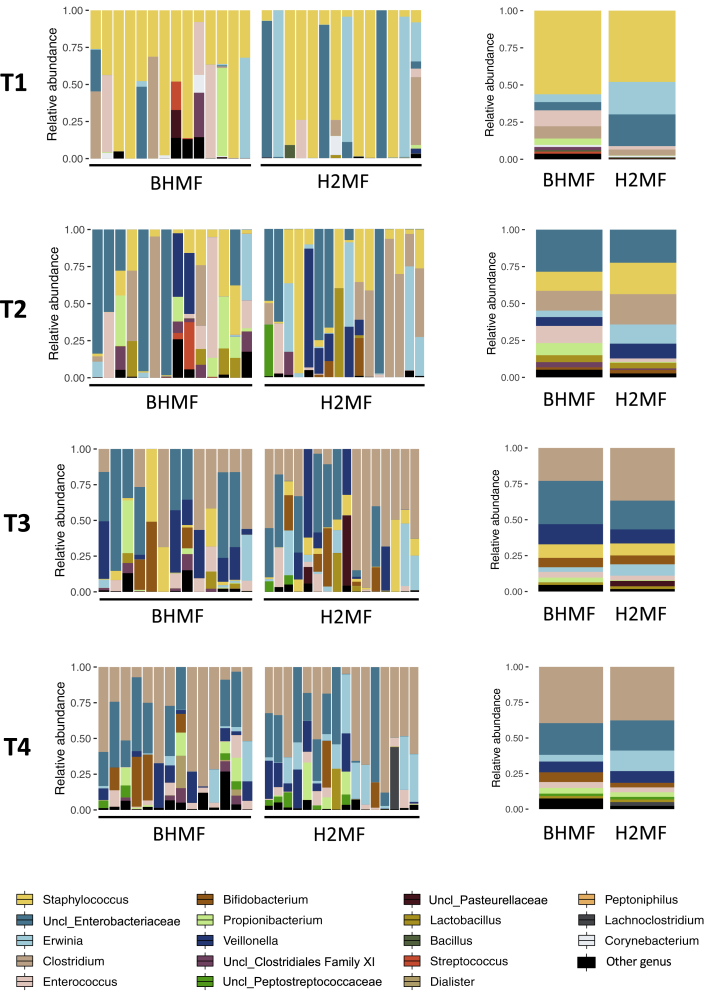
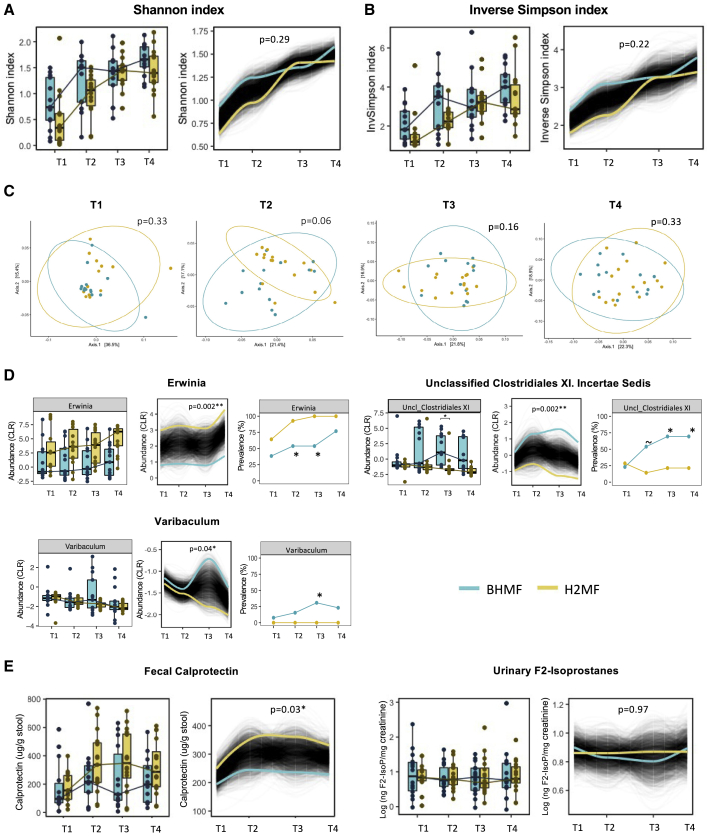
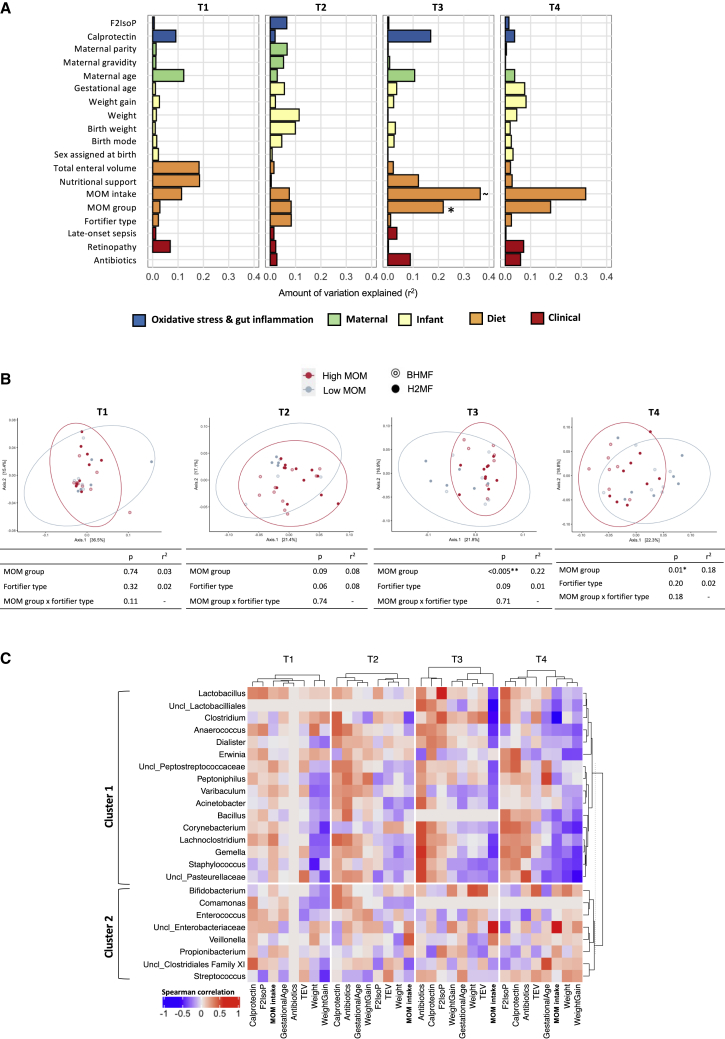
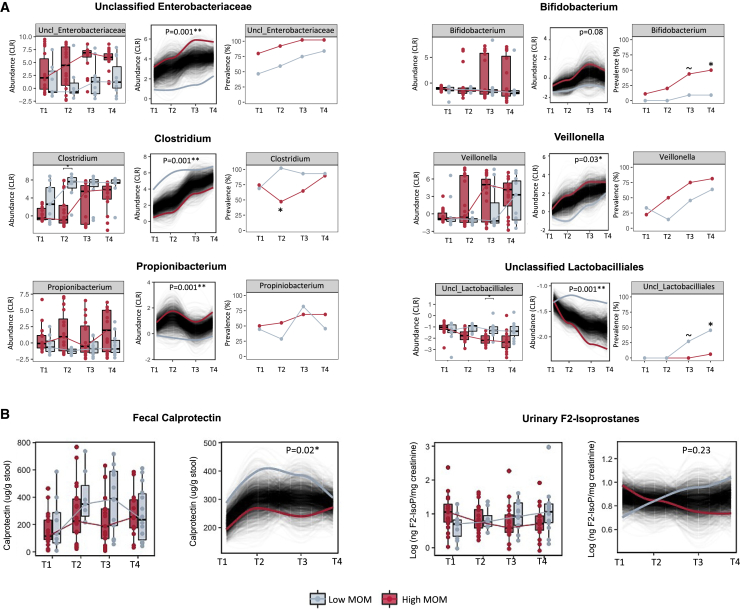
Milk fortifiers help meet the nutritional needs of preterm infants receiving their mother's own milk (MOM) or donor human milk. We conducted a randomized clinical trial (NCT03214822) in 30 very low birth weight premature neonates comparing bovine-derived human milk fortifier (BHMF) versus human-derived fortifier (H2MF). We found that fortifier type does not affect the overall microbiome, although H2MF infants were less often colonized by an unclassified member of Clostridiales Family XI. Secondary analyses show that MOM intake is strongly associated with weight gain and microbiota composition, including Bifidobacterium, Veillonella, and Propionibacterium enrichment. Finally, we show that while oxidative stress (urinary F2-isoprostanes) is not affected by fortifier type or MOM intake, fecal calprotectin is higher in H2MF infants and lower in those consuming more MOM. Overall, the source of human milk (mother versus donor) appears more important than the type of milk fortifier (human versus bovine) in shaping preterm infant gut microbiota.

Keywords: calprotectin; gut inflammation; gut microbiome; human donor milk; human milk fortifiers; mother’s own milk; oxidative stress; very low birth weight infants.


Conflict of interest statement

Declaration of interests M.B.A. has consulted for DSM Nutritional Products and serves on the Malaika Vx and Tiny Health scientific advisory boards. She has received honoraria for speaking at symposia sponsored by Medela, Prolacta Biosciences, and the Institute for Advancement of Breastfeeding and Lactation Education and has contributed without remuneration to online courses on breast milk and the infant microbiome produced by Microbiome Courses. S.V.K. is currently employed by Digbi Health (3T and AI Pvt. Ltd., India), a position taken up after concluding the research presented in this study. These entities had no role in the design and conduct of the study; collection, management, analysis, and interpretation of the data; preparation, review, or approval of the article; or decision to submit the article for publication.

Figures

None
Graphical abstract
Figure 1
Figure 1
Flowchart and illustration of changes in gut bacterial diversity and community structure in VLBW infants over time (A) Participant flow chart: consolidated standards of reporting trials diagram. (B) Study design and sample collection time points (T1–T4). Infants born from 26 to 30 weeks were recruited into the study, received their assigned fortifier (BHMF or H2MF) until 33 weeks AGA, and were followed until 35 weeks AGA or hospital discharge. Therefore, the intervention (T1 to T3) and follow-up (T3 to T4) periods ranged in duration. (C) Alpha diversity indicating species diversity within samples (n = 30) across time. (D) Principal coordinate analysis based on Bray-Curtis dissimilarity (Jaccard distances in Figure S1 and phylum/genus level changes over time in Figures S2A and S2B) showing diversity between samples across four study time points (left) and with adjusted gestational age in days (right). T1, study day 0 (before fortification); T2, study day 7 (during fortification); T3, week 33 AGA (end of fortification); and T4, week 35 AGA (follow-up after fortification). Statistical significance: ∗∗∗p < 0.001 across all study time points (Kruskal-Wallis test) for alpha diversity or by permutational multivariate analysis of variance (PERMANOVA) for beta diversity and betadisper test (permutation test for homogeneity of multivariate dispersions; 99,999 permutations with strata by infant ID to account for repeated measures). The p values were adjusted for multiple comparisons using false discovery rate (FDR) correction. AGA, adjusted gestational age; BHMF, bovine-derived human milk fortifier; H2MF, human-derived human milk fortifier; VLBW, very low birth weight.
Figure 2
Figure 2
Impact of human milk fortifier type, bovine (BHMF, n = 14) or human (H2MF, n = 16), on gut bacterial composition in VLBW infants Bar plots depict the relative abundance of gut bacterial genera (left, individual infants; right, group means). T1, study day 0 (before fortification); T2, study day 7 (during fortification); T3, week 33 AGA (end of fortification); and T4, week 35 AGA (follow-up after fortification). AGA, adjusted gestational age; BHMF, bovine-derived human milk fortifier; H2MF, human-derived human milk fortifier; VLBW, very low birth weight. Figure S3 shows results at the phylum level. The prefix “Uncl_” indicates an unclassified genus of the particular bacterial family or order.
Figure 3
Figure 3
Impact of human milk fortifier type on the gut microbiome, gut inflammation, and oxidative stress in VLBW infants over time (A and B) Longitudinal trajectories of (A) Shannon index and (B) inverse Simpson index, indicating alpha (within-sample) diversity over time in infants receiving BHMF (n = 14) or H2MF (n = 16); p values are from trend comparison using splinectomeR (999 permutations). (C) PCoA depicts beta (between-sample) diversity based on Bray-Curtis dissimilarity (Jaccard distances in Figure S4A) at each time point; p values are from PERMANOVA (99,999 permutations). See Table S1A for betadisper test results (permutation test for homogeneity of multivariate dispersions). (D) Genera with >10% prevalence across all samples that differed in prevalence or relative abundance (centered log-ratio [CLR] transformed) between groups over time are shown here (complete data are shown in Tables S1B–S1D, and regression analysis is shown in Figure S5). For Erwinia, the distance between groups at T1 indicates a random difference at baseline. (E) Gut inflammation (fecal calprotectin) and oxidative stress (urinary F2-isoprostane). The p values are from Wilcoxon sum rank test (for boxplots) or using splinectomeR (for longitudinal trajectories, 999 permutations) or Fisher’s exact test (for prevalences) (p < 0.10, ∗p < 0.05, ∗∗p < 0.01). T1, study day 0 (before fortification); T2, study day 7 (during fortification); T3, week 33 AGA (end of fortification); and T4, week 35 AGA (follow-up after fortification). AGA, adjusted gestational age; BHMF, bovine-derived human milk fortifier; H2MF, human-derived human milk fortifier; PCoA, principal coordinate analysis; VLBW, very low birth weight.
Figure 4
Figure 4
Association of mother’s own milk (MOM) intake, fortifier type, and other factors with gut microbiome composition in VLBW infants (A) Microbiome variance is explained by various factors, modeled individually by EnvFit using Bray-Curtis dissimilarity. Fortifier type, BHMF versus H2MF; MOM group, high versus low intake; F2IsoP, F2-isoprostane levels; antibiotics, percentage of days on antibiotics until a particular study time point. FDR-adjusted p values are denoted by p < 0.1, ∗p < 0.05, ∗∗p < 0.01. (B) PCoA depicting beta diversity between MOM groups (low-MOM versus high-MOM infants, see Figure S8 for details) over time, modeled from PERMANOVA (99,999 permutations) using the fortifier type and MOM group in a multivariable analysis. See Table S1A for betadisper test results (permutation test for homogeneity of multivariate dispersions). (C) Heatmap illustrating correlations between bacterial genera relative abundances (CLR transformed) and other continuous covariates at each time point (T1–T4). Dendrogram clustering was based on pairwise distances obtained from Spearman correlations, independently for each time point (horizontal axis). Correlations represented were not significant (p > 0.05, FDR corrected). Clusters 1 and 2 on the vertical axis depict the clustering of genera based on their correlations with covariates. MOM groups were determined based on % MOM volumes that represent the proportion of MOM used to prepare the feeds prior to fortification. T1, study day 0 (before fortification: BHMF, n = 14; H2MF, n = 16; low MOM, n = 10; high MOM, n = 20); T2, study day 7 (during fortification: BHMF, n = 14; H2MF, n = 16; low MOM, n = 8; high MOM, n = 22); T3, week 33 AGA (end of fortification: BHMF, n = 14; H2MF, n = 16; low MOM, n = 13; high MOM, n = 17); and T4, week 35 AGA (follow-up after fortification: BHMF, n = 14; H2MF, n = 16; low MOM, n = 14; high MOM, n = 16). BHMF, bovine-derived human milk fortifier; H2MF, human-derived human milk fortifier; PCoA, principal coordinate analysis; VLBW, very low birth weight; F2IsoP, F2-isoprostanes; AGA, adjusted gestational age; antibiotics, percentage of days on antibiotics until a specific study time point; TEV, total enteral volume. The prefix “Uncl_” indicates an unclassified genus of the named bacterial family or order.
Figure 5
Figure 5
Association of mother’s own milk (MOM) intake with microbiome trajectories, gut inflammation, and oxidative stress in VLBW infants over time (A) Trajectories of bacterial relative abundance (CLR transformed) and prevalence over time in infants with high versus low MOM intake (see Figure S8 for details). Genera with >10% prevalence across all samples that differed in prevalence or relative abundance between groups over time are shown here (complete data are shown in Tables S1E–S1G, and regression analyses are shown in Figure S10). (B) Gut inflammation (fecal calprotectin) and oxidative stress (urinary F2-isoprostanes) over time. The p values are from Wilcoxon sum rank test (for boxplots) or using splinectomeR (for longitudinal trajectories, 999 permutations) or Fisher’s exact test (for prevalences) (p < 0.10, ∗p < 0.05, ∗∗p < 0.01). MOM groups were determined based on % MOM volumes that represent the proportion of MOM used to prepare the feeds prior to fortification. T1, study day 0 (before fortification: low MOM, n = 10; high MOM, n = 20); T2, study day 7 (during fortification: low MOM, n = 8; high MOM, n = 22); T3, week 33 AGA (end of fortification: low MOM, n = 13; high MOM, n = 17); and T4, week 35 AGA (follow-up after fortification: low MOM, n = 14; high MOM, n = 16).

Comment in

  • Reply to SV Kumbhare et al.
    Strobel KM, Del Vecchio G, Devaskar SU, Calkins KL. Strobel KM, et al. J Nutr. 2024 May;154(5):1723. doi: 10.1016/j.tjnut.2023.11.029. Epub 2023 Nov 30. J Nutr. 2024. PMID: 38042349 No abstract available.

References

    1. Arslanoglu S., Boquien C.-Y., King C., Lamireau D., Tonetto P., Barnett D., Bertino E., Gaya A., Gebauer C., Grovslien A., et al. Fortification of human milk for preterm infants: update and recommendations of the European milk bank association (EMBA) working group on human milk fortification. Front. Pediatr. 2019;7:76. doi: 10.3389/fped.2019.00076. - DOI - PMC - PubMed
    1. Dutta S., Singh B., Chessell L., Wilson J., Janes M., McDonald K., Shahid S., Gardner V.A., Hjartarson A., Purcha M., et al. Guidelines for feeding very low birth weight infants. Nutrients. 2015;7:423–442. doi: 10.3390/nu7010423. - DOI - PMC - PubMed
    1. Gregory K. Update on nutrition for preterm and full-term infants. J. Obstet. Gynecol. Neonatal Nurs. 2005;34:98–108. doi: 10.1177/0884217504272805. - DOI - PubMed
    1. Martin C.R., Ling P.-R., Blackburn G.L. Review of infant feeding: key features of breast milk and infant formula. Nutrients. 2016;8:279. doi: 10.3390/nu8050279. - DOI - PMC - PubMed
    1. Neu J. Mother’s own milk: how does it differ from donor milk for the baby. Breastfeed. Med. 2019;14:S3–S4. doi: 10.1089/bfm.2019.0036. - DOI - PubMed

Publication types

Substances

Associated data