

Bayesian estimation of the effect of health inequality in disease detection
- PMID: 36030233
- PMCID: PMC9419354
- DOI: 10.1186/s12939-022-01713-5
Bayesian estimation of the effect of health inequality in disease detection
Abstract
Background: Measuring health inequality is essential to ensure that everyone has equal accessibility to health care. Studies in the past have continuously presented and showed areas or groups of people affected by various inequality in accessing the health resources and services to help improve this matter. Alongside, disease prevention is as important to minimise the disease burden and improve health and quality of life. These aspects are interlinked and greatly contributes to one's health.
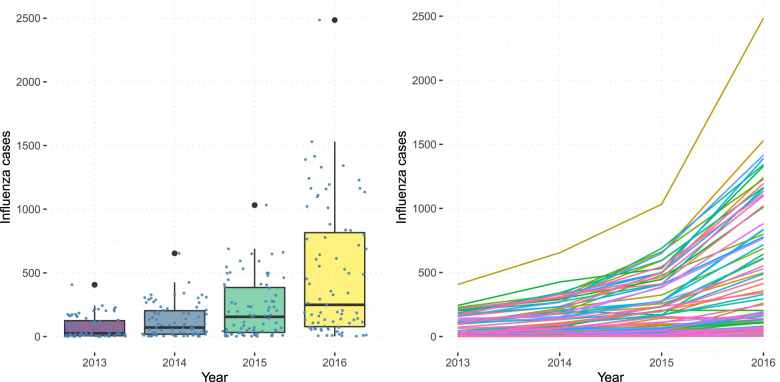
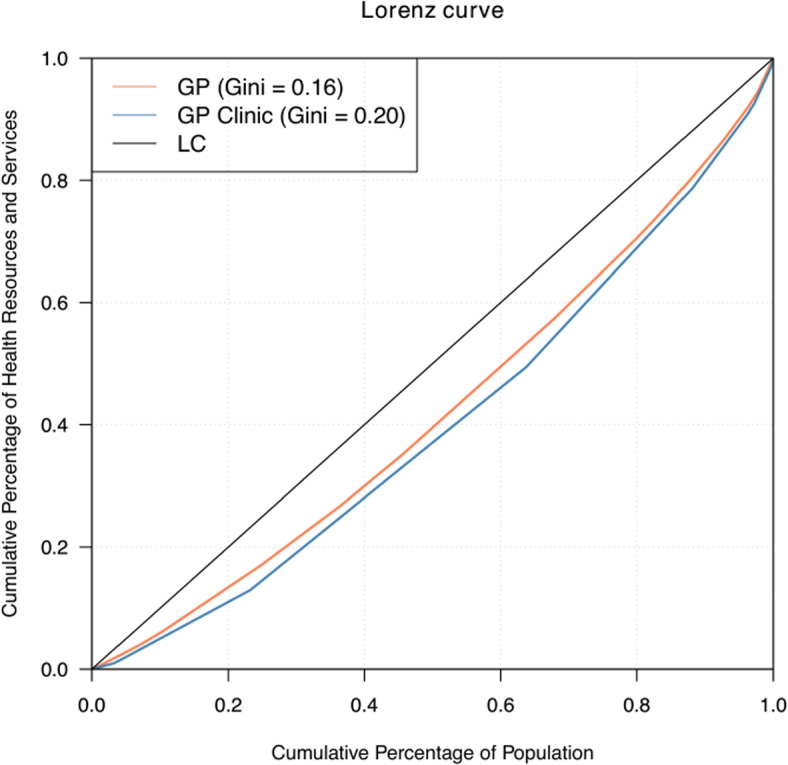
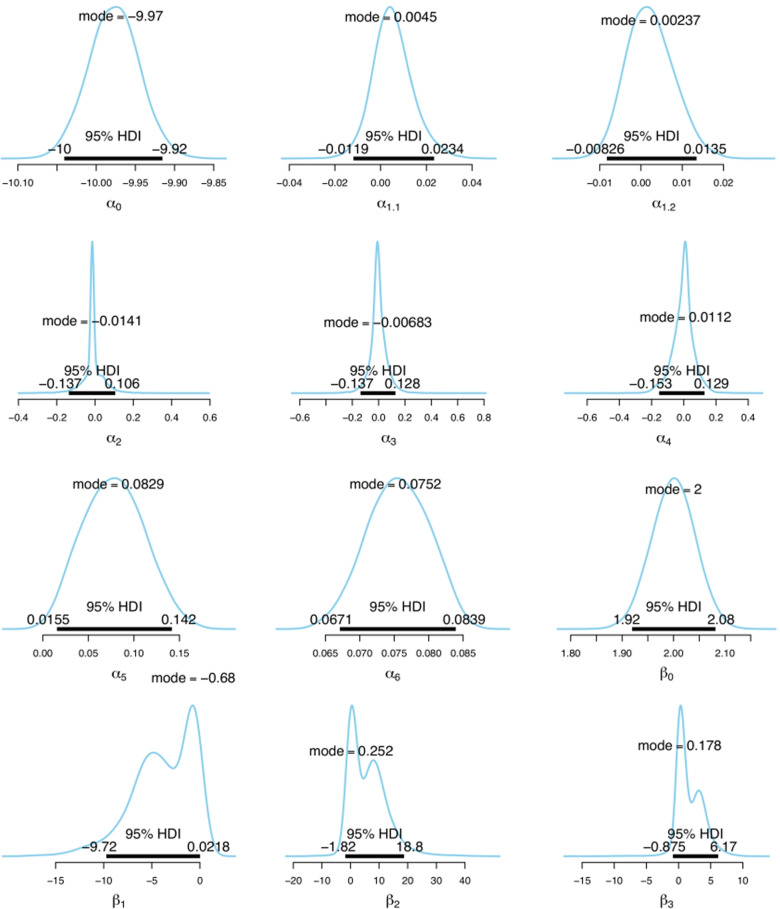
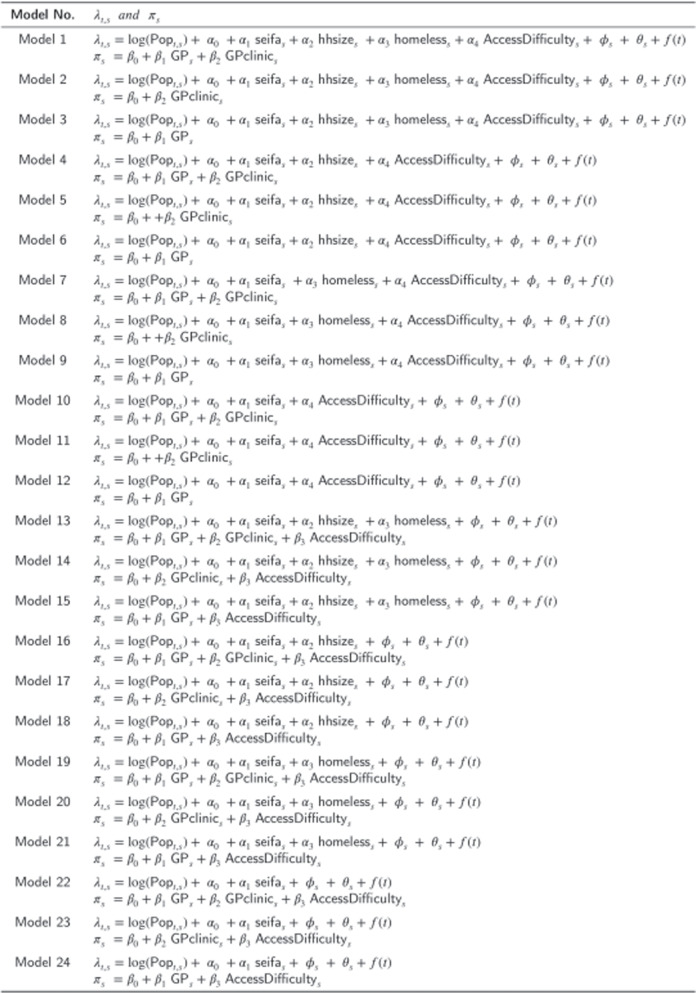
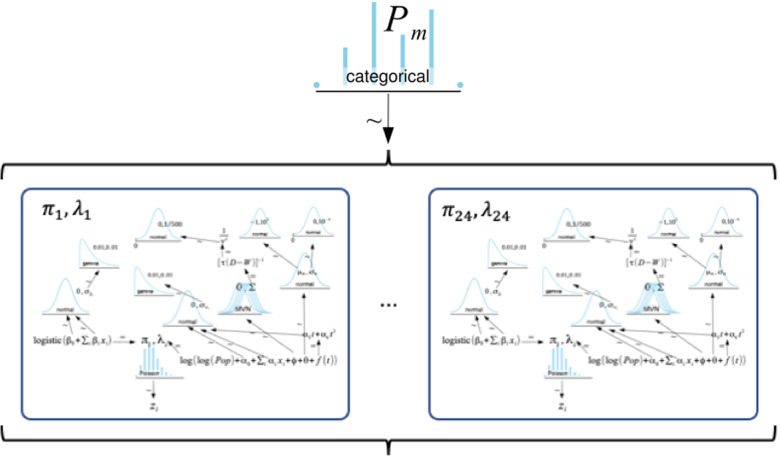
Method: In this study, the Gini coefficient and Lorenz curve are used to give an indication of the overall health inequality. The impact of this inequality in granular level is demonstrated using Bayesian estimation for disease detection. The Bayesian estimation used a two-component modelling approach that separates the case detection process and incidence rate using a mixed Poisson distribution while capturing underlying spatio-temporal characteristics. Bayesian model averaging is used in conjunction with the two-component modelling approach to improve the accuracy of estimates by incorporating many candidate models into the analysis instead of using fixed component models. This method is applied to an infectious disease, influenza, in Victoria, Australia between 2013 and 2016 and the corresponding primary health care of the state.
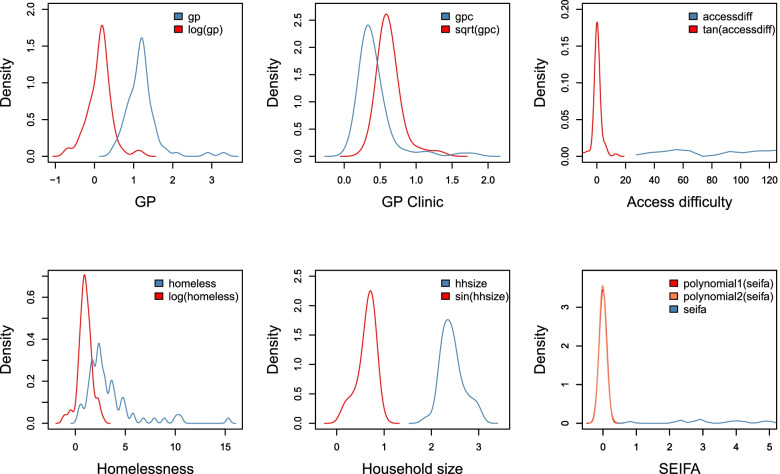
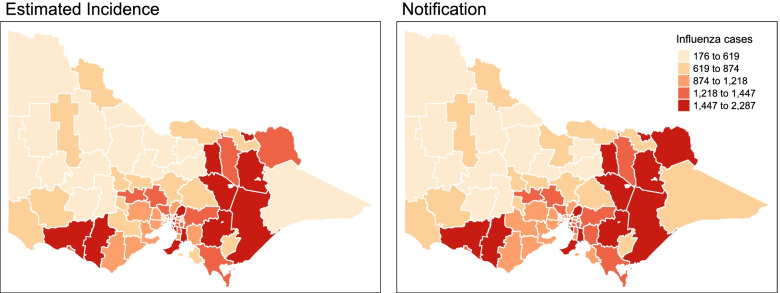
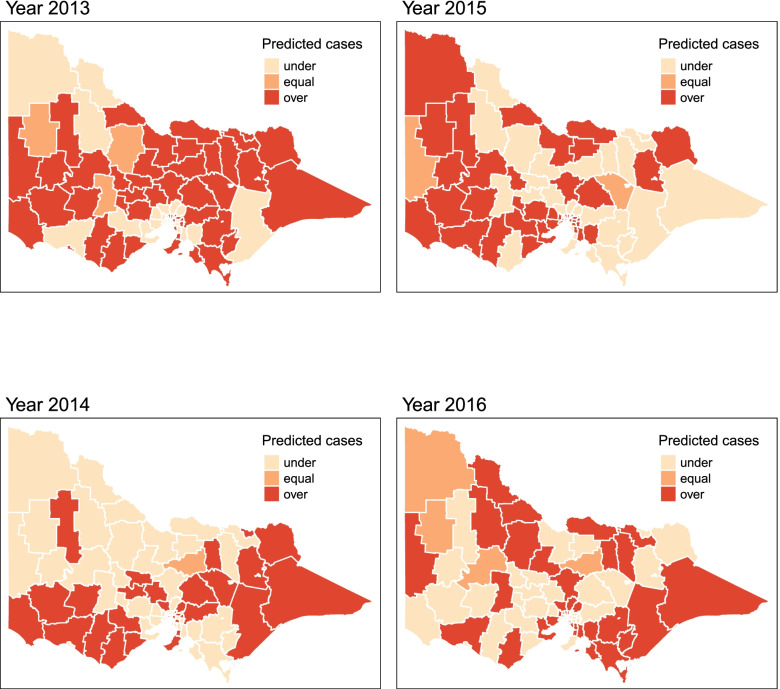
Result: There is a relatively equal distribution of health resources and services pertaining to general practitioners (GP) and GP clinics in Victoria, Australia. Roughly 80 percent of the population shares 70 percent of the number of GPs and GP clinics. The Bayesian estimation with model averaging revealed that access difficulty to health services impacts both case detection probability and incidence rate. Minimal differences are recorded in the observed and estimated incidence of influenza cases considering social deprivation factors. In most years, areas in Victoria's southwest and eastern parts have potential under-reported cases consistent with their relatively lower number of GP or GP clinics.
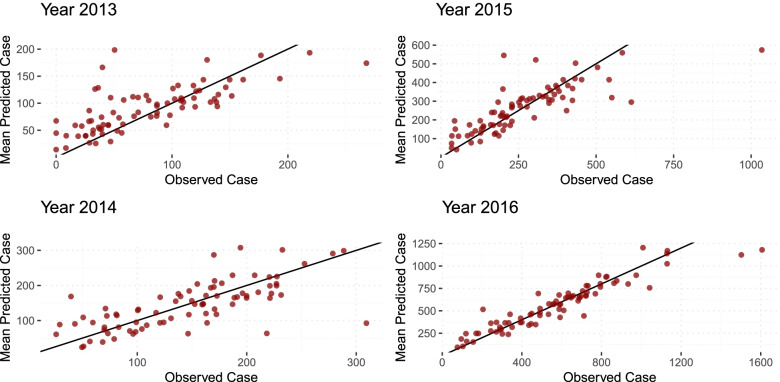
Conclusion: The Bayesian model estimated a slight discrepancy between the estimated incidence and the observed cases of influenza in Victoria, Australia in 2013-2016 period. This is consistent with the relatively equal health resources and services in the state. This finding is beneficial in determining areas with potential under-reported cases and under-served health care. The proposed approach in this study provides insight into the impact of health inequality in disease detection without requiring costly and time-extensive surveys and relying mainly on the data at hand. Furthermore, the application of Bayesian model averaging provided a flexible modelling framework that allows covariates to move between case detection and incidence models.
Keywords: Bayesian model averaging; Bayesian statistics; Case detection; Gini coefficient; Incidence; Influenza; Lorenz curve.
© 2022. The Author(s).
Conflict of interest statement
The authors declare that they have no competing interests.
Figures


References
-
- World Health Organization. The world health report 2000. 2000. https://apps.who.int/gb/archive/pdf_files/WHA53/ea4.pdf. Accessed 07 June 2021.
-
- Australian Institute of Health and Welfare. Australia’s Health 2018. 2018. https://www.aihw.gov.au/reports/australias-health/australias-health-2018.... Accessed 07 June 2021.
Publication types
MeSH terms
LinkOut - more resources
Full Text Sources
Medical
Miscellaneous
