. 2022 Aug 27;13(1):5062.
doi: 10.1038/s41467-022-32477-9.

Reversal of the renal hyperglycemic memory in diabetic kidney disease by targeting sustained tubular p21 expression

Affiliations

Reversal of the renal hyperglycemic memory in diabetic kidney disease by targeting sustained tubular p21 expression

Moh'd Mohanad Al-Dabet et al. Nat Commun. .

Abstract

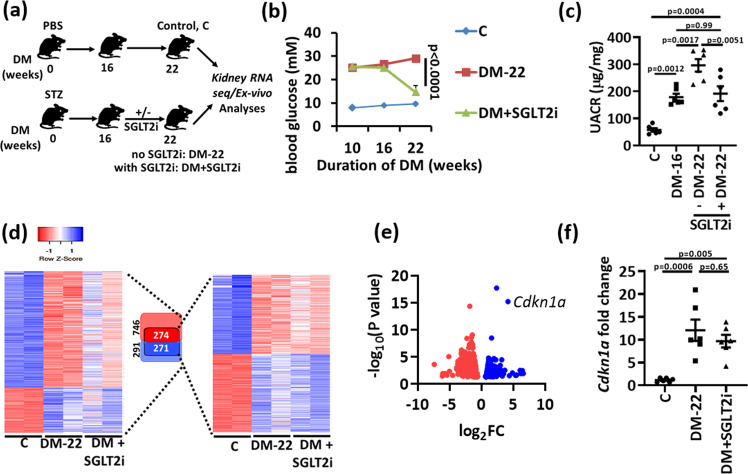
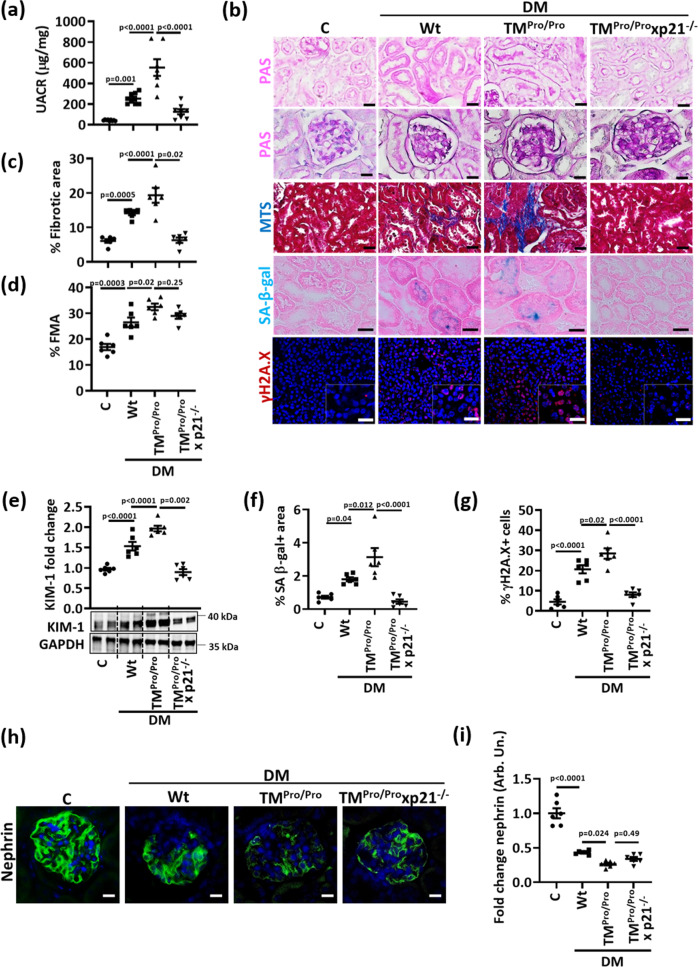
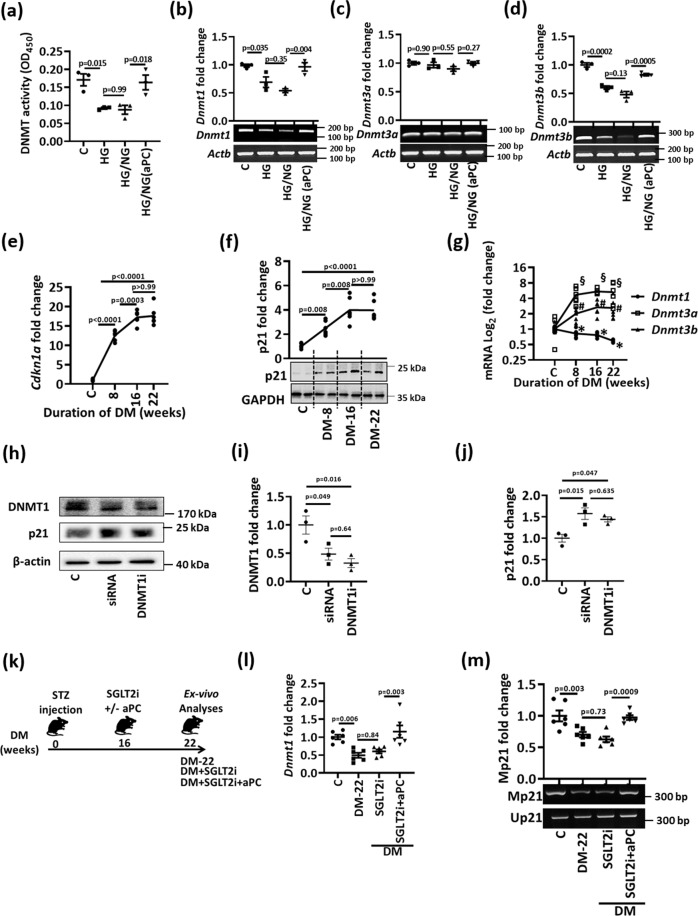
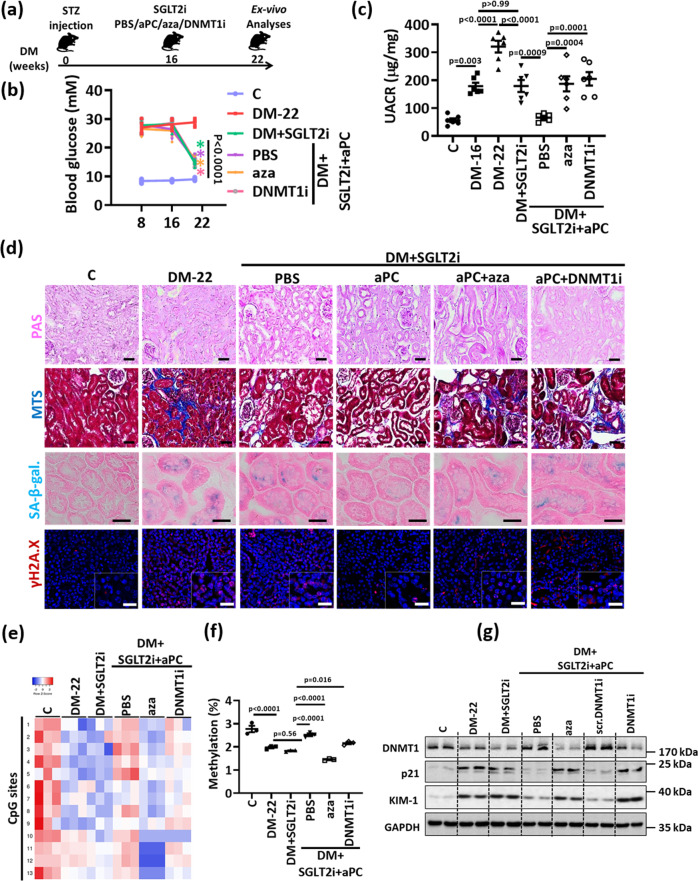
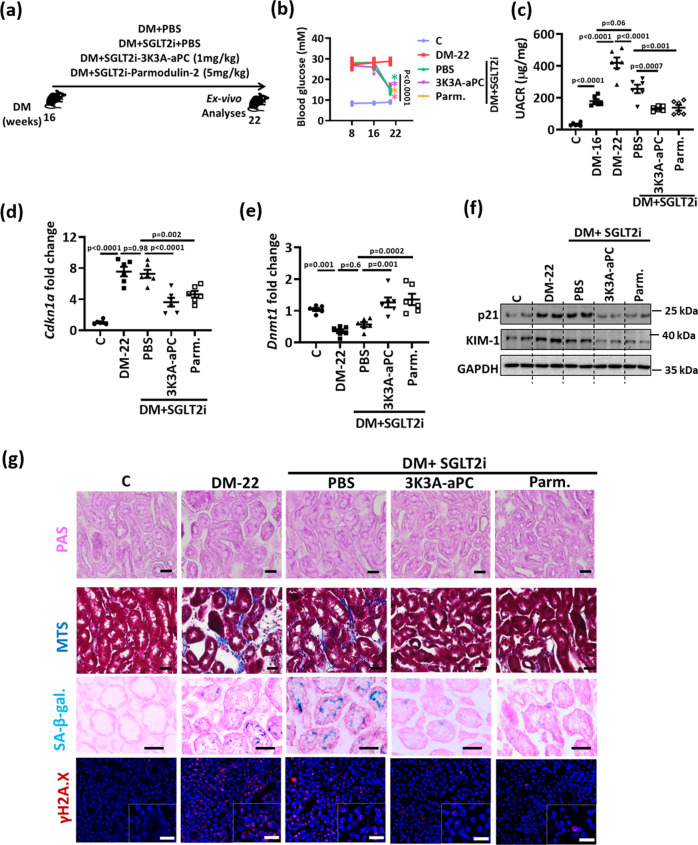
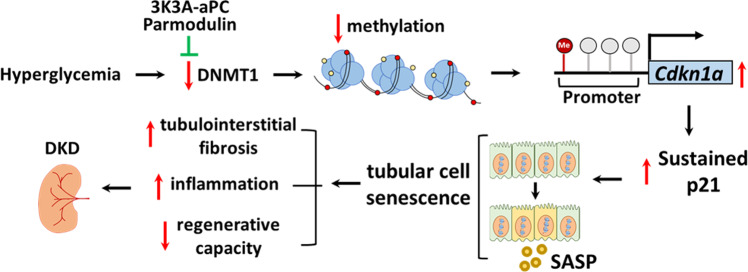
A major obstacle in diabetes is the metabolic or hyperglycemic memory, which lacks specific therapies. Here we show that glucose-mediated changes in gene expression largely persist in diabetic kidney disease (DKD) despite reversing hyperglycemia. The senescence-associated cyclin-dependent kinase inhibitor p21 (Cdkn1a) was the top hit among genes persistently induced by hyperglycemia and was associated with induction of the p53-p21 pathway. Persistent p21 induction was confirmed in various animal models, human samples and in vitro models. Tubular and urinary p21-levels were associated with DKD severity and remained elevated despite improved blood glucose levels in humans. Mechanistically, sustained tubular p21 expression in DKD is linked to demethylation of its promoter and reduced DNMT1 expression. Two disease resolving agents, protease activated protein C (3K3A-aPC) and parmodulin-2, reversed sustained tubular p21 expression, tubular senescence, and DKD. Thus, p21-dependent tubular senescence is a pathway contributing to the hyperglycemic memory, which can be therapeutically targeted.


Conflict of interest statement

C.D. is an inventor on patent applications and patents describing parmodulin compounds. The other authors declare no competing interests.

Figures

Fig. 1
Fig. 1. Identification of genes and pathways associated with hyperglycemic memory.
a Experimental scheme showing non-diabetic control (C) or diabetic mice without (DM-22) or with intervention to reduce blood glucose levels by sodium/glucose cotransporter-2 inhibitor (Dapagliflozin®, DM + SGLT2i). Mice were age matched and SGLT2i treatment was started after 16 weeks of persistent hyperglycemia (streptozotocin; STZ-induced hyperglycemia). b Average blood glucose levels in the experimental groups after 10, 16 or 22 weeks. c Dot plot summarizing albuminuria (urinary albumin-creatinine ratio, µg albumin/mg creatinine; UACR) in non-diabetic (C) or diabetic mice without (DM-16 and DM-22) or with intervention to reduce blood glucose levels (DM + SGLT2i). d Heat map summarizing gene-expression in experimental groups (C, DM-22, DM + SGLT2i). All genes with significantly changed expression between control and diabetic mice are shown on the left side of the panel and are illustrated by lightly colored boxes in the middle (number of genes shown in black). The subset of genes with persistently changed expression despite reduced blood glucose levels are shown on the right side of the panel and illustrated by the darker colored smaller boxes in the middle (number of genes shown in white). e Volcano plot summarizing the persistently induced and repressed genes in diabetic mice after blood glucose reduction based on Log FC values and FDR. Ckdn1a (p21) belongs to the top persistently induced genes. f Sustained renal p21 mRNA expression (Cdkn1a, qRT-PCR) in vivo (DM-22; T1DM, STZ-model) despite reducing glucose levels (DM + SGLT2i; T1DM, STZ-model) as compared to mice with persistently elevated glucose levels (DM-22) or normoglycemic controls (C). Line graph and dot plots reflecting mean ± SEM of six mice per group; one-way ANOVA with Sidak’s multiple comparison test. Source data are provided as a Source Data file-Fig-1.
Fig. 2
Fig. 2. Sustained p21 expression despite glucose lowering in experimental DKD.
a, b Sustained p21 expression in vivo (DM-22; T1DM, STZ-model, (a); T2DM, db/db-model, (b) despite reducing glucose levels (DM + SGLT2i, (a); db/db+SGLT2i, (b) as compared to mice with persistently elevated glucose levels (DM-22, (a); db/db, (b) or normoglycemic controls (C, a; db/m, b). Exemplary immunoblots (a, b). GAPDH: loading control (bottom, a, b) and dot plots summarizing results (top, a, b). c Immunohistochemical images of sustained p21 expression in kidneys of T1DM (STZ-model, top) and T2DM (db/db model, bottom) diabetic mice despite reducing glucose levels (DM + SGLT2i) as compared to mice with persistenly elevated blood glucose levels (DM-22); C: normoglycemic controls. p21 is detected by HRP-DAB reaction, brown; hematoxylin nuclear counter stain, blue. Scale bars represent 20 µm. d Exemplary p21immunoblot (bottom; loading control: β-actin) and dot plot summarizing results (top) in mouse primary tubular cells (PTC), mouse mesangial cells (MES), mouse glomerular endothelial cells (GEC), or mouse podocytes (Pod) maintained under normo- (5 mM; C) or high glucose (25 mM; HG) conditions. e Sustained p21 expression in vitro (Human kidney cells, HEK293) despite reducing glucose levels. HEK-293 cells were maintained under normal glucose (5 mM, C), high glucose (48 h of 25 mM, HG), or high glucose followed by normal glucose (25 and 5 mM, each for 24 h, HG/NG). Exemplary immunoblots (bottom, GAPDH: loading control) and dot plots summarizing results (top). f Sustained p21 expression in vivo (STZ-model) despite reducing glucose levels using insulin (DM + INS) as compared to mice with persistently elevated glucose levels (DM-22) and normoglycemic controls (C). Exemplary immunoblots (bottom, GAPDH: loading control) and dot plots summarizing results (top). g Exemplary histological images of SA-β-gal stain (senescence associated β-galactosidase, blue; eosin counterstain) in T1DM (STZ-model, top and bottom) and T2DM (db/db model, middle) despite reducing glucose levels (DM + intervention; SGLT2i, top and middle or insulin, INS, bottom) as compared to mice with persistently elevated glucose levels (DM-22) or normoglycemic controls (C). Scale bars represent 20 µm. Dot plots reflecting mean ± SEM of 6 mice per group or 3 independent experiments; one-way ANOVA with Sidak’s multiple comparison test (a,b,e,f); t-test comparing C versus HG for each cell line (d) Gels/blots were processed in parallel; source data are provided as a Source Data file-Fig-2.
Fig. 3
Fig. 3. Sustained tubular p21 expression in human DKD.
ac Exemplary histological images of human kidney sections stained for p21 (top) or γ-H2A.X (histone H2A family X, bottom) obtained from non-diabetic controls (C; n = 6) or diabetic patients without (DM-DKD; n = 6) or with (DM + DKD; n = 5) DKD; p21 is detected by HRP-DAB reaction, brown; hematoxylin nuclear counter stain, blue; γ-H2A.X is immunofluorescently detected, red; DAPI nuclear counterstain, blue. Dot plots summarizing results for p21 (b) and γ-H2A.X (c); Scale bars represent 20 μm. one-way ANOVA with Sidak’s multiple comparison test. d, e Urinary p21, detected by immunoblotting (d) or ELISA (e; pg/ml) is markedly increased in patients with DKD (n = 26) compared to non-diabetic controls with normal kidney function (C; n = 22). Urinary p21 levels in patients with other causes of chronic kidney disease (oCKD; n = 18) are comparable to those in patients with DKD. Exemplary immunoblot (d) and dot plots reflecting mean ± SD showing the distribution of the urinary levels of p21 (e, Kruskal–Wallis test with Dunn’s multiple comparison test. f Violin plots showing the distribution of the urinary levels of p21 (pg/ml; ELISA) in normoglycemic controls (C; n = 36) and diabetic individuals which are classified according to KDIGO criteria from the LIFE-adult cohort (low risk, n = 52; moderate risk, n = 53; high risk, n = 29 and very high risk, n = 18). Kruskal-Wallis test with Dunn’s multiple comparison test. g Receiver operating characteristic (ROC) analyses of urinary p21 (pg/ml; ELISA) in diabetic individuals with low or moderate risk of CKD (blue) and in diabetic patients with high or very high risk of CKD (red) compared to non-diabetic controls (C). AUC: area under the curve. hj Negative correlation of urinary p21 (pg/ml, ELISA) with estimated glomerular filtration rate (eGFR, ml/min/1.73 m², (h) and positive correlation with urinary albumin creatinine ration (UACR, mg albumin /g creatinine, (i) or with cystatin C serum levels (Cyt. C, mmol/l, j) in diabetic individuals from the LIFE-adult cohort. Pearson’s correlation. kn line-graphs illustrating individual changes of urinary p21 (k; ELISA, pg/ml, m; immunoblot) or HbA1c (l, n) in diabetic patients with known DKD (n = 10) before (−) and after (+) SGLT2i treatment (k, l) or before (−) and after (+) fasting mimicking diet (FMD, m, n). Paired t-test. Gels/blots were processed in parallel; source data are provided as a Source Data file-Fig-3.
Fig. 4
Fig. 4. Impaired protein C activation increases tubular p21 expression and senescence in vivo.
a Experimental scheme of in vitro experiments with human kidney cells (HEK-293) or mouse primary tubular cells (PTCs). Experimental conditions: control with continuously normal glucose (C, 5 mM glucose), continuously high glucose (HG, 25 mM, 48 h), high glucose for 24 h followed by normal glucose (NG, 5 mM glucose) for 24 h without aPC-exposure (HG/NG), with aPC (20 nM) during the high glucose exposure (HG(aPC)/NG), or with aPC (20 nM) upon returning cells to normal glucose (HG/NG(aPC)). b Exemplary immunoblots of p21 (bottom; loading control: GAPDH) in HEK-293 cells and mouse PTCs and dot plots summarizing results (top). Experimental conditions as described in (a). c, d Exemplary images (bottom) and dot plots summarizing results (top) of p21 (Cdkn1a) mRNA-levels determined by semiquantitative RT-PCR (control: β-actin, Actb; c) and methylation-specific PCR (d) of the p21-promoter (Mp21; control: unmethylated p21, Up21) in HEK-293 cells (experimental conditions as described in a). e Exemplary histological images from non-diabetic (C) or diabetic (DM) wild-type (Wt) and TMPro/Pro mice for p21 (immunohistochemically detected by HRP-DAB-reaction, brown, examples illustrated by arrows; hematoxylin counterstain), interstitial fibrosis (Masson’s trichrome stain, MTS), periodic acid Schiff stain (PAS), SA-β-gal. stain (senescence associated β-galactosidase, blue; eosin counterstain), and γ-H2A.X immunohistochemistry (histone H2A family X, red; DAPI nuclear counterstain, insets: larger magnification); all scale bars represent 20 μm. f, g Dot plots summarizing tubular fibrotic area (f) and tubular cell size (g) in experimental groups (as described in (e). h Dot plot summarizing renal p21 (Cdkn1a) and KIM-1 (Havcr1) expression (mRNA, qRT-PCR) in experimental groups (as described in e). i Representative immunoblots (bottom; loading control: GAPDH) and dot plot summarizing results (top) for renal p21 and KIM-1 expression in experimental groups (as described in e). Dot plots reflecting mean ± SEM of 3 independent experiments (bd) or 6 mice per group (fi); one-way ANOVA with Sidak’s multiple comparison test (bd) or two-way ANOVA with Sidak’s multiple comparison test (fi). Gels/blots were processed in parallel; source data are provided as a Source Data file-Fig-4.
Fig. 5
Fig. 5. p21 mediates enhanced tubular senescence in aPC-deficient mice.
a Dot plot summarizing albuminuria (urinary albumin-creatinine ratio, µg albumin/mg creatinine; UACR) in non-diabetic (C, n = 9) or diabetic (DM) wild-type (Wt, n = 8), TMPro/Pro (n = 7) and TMPro/Pro x p21−/− (n = 8) mice. b Exemplary histological images of periodic acid Schiff stains (PAS) showing tubuli (top) or glomeruli (2nd row), interstitial fibrosis (Masson’s trichrome stain, MTS), SA-β-gal. stain (senescence associated β-galactosidase, blue; eosin counterstain), and γ-H2A.X immunohistochemistry (histone H2A family X, red; DAPI nuclear counterstain, insets: larger magnification) in experimental groups (as described in a); all scale bars represent 20 μm. c, d Dot plots summarizing tubular fibrotic area (c) and fractional mesangial area (FMA, d), the latter reflecting glomerulosclerosis in experimental groups (as described in a). e Exemplary immunoblot (bottom; loading control: GAPDH) and dot plot summarizing results (top) of renal KIM-1 expression in experimental groups (as described in a). f, g Dot plots summarizing percentage of SA-β-gal. positive area (f) and percentage of γ-H2A.X positive cells (g) in experimental groups (as described in a). h, i Exemplary histological images of glomerular nephrin expression (green, DAPI nuclear counterstain, blue, h), and dot plot summarizing nephrin staining intensity fold change (i) in experimental groups (as described in a). Dot plots reflecting mean ± SEM of six mice per group; one-way ANOVA with Sidak’s multiple comparison test. Source data are provided as a Source Data file-Fig-5.
Fig. 6
Fig. 6. aPC regulates p21 promoter methylation and DNMT1 in tubular cells.
a Dot-plot summarizing total DNMT-activity in HEK-293 cells. Experimental conditions: control with continuously normal glucose (C, 5 mM glucose), continuously high glucose (HG, 25 mM, 48 h), high glucose for 24 h followed by normal glucose (NG, 5 mM glucose) for 24 h without aPC-exposure (HG/NG), or with aPC (20 nM) upon returning cells to normal glucose (HG/NG(aPC)). bd Exemplary gel-images of Dnmt1 (b), Dnmt3a (c), and Dnmt3b (d); (bottom; semi-quantitative RT-PCR, loading control: β-actin, Actb) expression and dot-plots summarizing results (top) in experimental conditions (as described in a). eg Kinetics of renal p21 (Cdkn1a) expression (e, mRNA, qRT-PCR; f, protein expression). Exemplary immunoblot (f, bottom; GAPDH: loading control) and line-graph summarizing results (top). Line-graph summarizing Dnmt1, Dnmt3a and Dnmt3b expression in vivo (g, mRNA, qRT-PCR). Diabetic wild-type mice (STZ model, age 8, 16, or 22 weeks) were compared to non-diabetic mice (C, age 30 weeks). *P = 0.022 (C vs 8), *P = 0.002 (C vs 16), *P < 0.0001 (C vs 22). #P = 0.001 (C vs 8), #P = 0.0002 (C vs 16), #P = 0.0003 (C vs 22). §P = 0.15 (C vs 8), §P = 0.007 (C vs 16), §P = 0.011 (C vs 22). hj Exemplary immunoblots of DNMT1 and p21 (β-actin: loading control) in murine primary tubular cells (h) and dot-plots summarizing results of DNMT1 (i) and p21 (j). Experimental conditions: control (C), DNMT1 siRNA (24 h, siRNA), and DNMT1 vivo morpholino (10 µM, 24 h, DNMT1(i). k Experimental scheme: 16 weeks after induction of persistent hyperglycemia with STZ, diabetic mice were treated with PBS (DM-22), sodium/glucose cotransporter 2-inhibitor (Dapagliflozin®, DM + SGLT2i) or a combination of SGLT2i and aPC (DM + SGLT2i + aPC) for further 6 weeks. l, m Dot-plots summarizing renal Dnmt1 expression (i, mRNA, qRT-PCR), and exemplary images of methylation-specific PCR (j, bottom) and dot-plot summarizing results (j, top) of p21-promoter (Mp21; control: unmethylated p21, Up21) in experimental groups (as described in h). Dot-plots or line-graphs reflecting mean ± SEM of three independent experiments (ad, i, j), 4 mice per group (eg), or 6 mice per group (i, m); one-way ANOVA with Sidak’s multiple comparison test. Gels/blots were processed in parallel; source data are provided as a Source Data file-Fig-6.
Fig. 7
Fig. 7. aPC reverses epigenetically sustained renal p21 expression and tubular senescence.
a Experimental scheme: 16 weeks after induction of persistent hyperglycemia, diabetic mice were treated with PBS (DM-22), sodium/glucose cotransporter 2-inhibitor (Dapagliflozin®, DM + SGLT2i), a combination of SGLT2i and aPC (DM + SGLT2i + aPC), a combination of SGLT2i, aPC and the pan DNMTs-inhibitor 5-aza-deoxycytidine (DM + SGLT2i + aPC+aza), or a combination of SGLT2i, aPC and a vivo morpholino targeting DNMT1 (DM + SGLT2i-aPC-DNMT1i) for further 6 weeks. b Average blood glucose levels in experimental groups (as described in a) after 8 or 16 weeks of persistent hyperglycemia and at 22 weeks. c Dot plot summarizing albuminuria (urinary albumin-creatinine ratio, µg albumin/mg creatinine; UACR) in experimental groups (as described in a). Baseline albuminuria before interventions was determined after 16 weeks of hyperglycemia (DM-16). d Exemplary histological images of periodic acid Schiff stains (PAS), interstitial fibrosis (Masson’s trichrome stain, MTS), SA- β-gal. stain (senescence associated β-galactosidase, blue; eosin counterstain), and γ-H2A.X (histone H2A, family X, immunohistochemistry, red; DAPI: nuclear counterstain, insets: larger magnification) in experimental groups (as described in a); scale bars represent 20 μm; all scale bars represent 20 μm. e, f Heat map summarizing methylation status of CpG sites in the p21 promotor region (e, the degree of methylation at each CpG site is represented according to the color code.) and dot plot summarizing cumulative quantification CpG islands’ methylation (f) in kidneys of experimental groups (as described in a). g Expression of renal p21, DNMT1 and KIM-1 protein (exemplary immunoblot, g; loading control: GAPDH in experimental groups (as described in a). A nonspecific scrambled vivo morpholino (scr. DNMT1i) has no effect. Line graph and dot plots reflecting mean ± SEM of 6 mice per group; one-way ANOVA with Sidak’s multiple comparison test. Gels/blots were processed in parallel; source data are provided as a Source Data file-Fig-7.
Fig. 8
Fig. 8. aPC regulates epigenetically sustained p21 expression independent of its anticoagulant function.
a Experimental scheme: 16 weeks after induction of persistent hyperglycemia, diabetic mice were treated with PBS (DM + PBS), sodium/glucose cotransporter 2-inhibitor (Dapagliflozin®, DM + SGLT2i), a combination of SGLT2i and 3K3A-aPC (DM + SGLT2i + 3K3A-aPC) or a combination of SGLT2i, aPC and parmodulin-2 (DM + SGLT2i + Parm.) for further 6 weeks. b Average blood glucose levels after 8 and and16 weeks of persistent hyperglycemia and at 22 weeks in experimental groups (as described in a). c Dot plot summarizing albuminuria (urinary albumin-creatinine ratio, µg albumin/mg creatinine; UACR) in experimental groups (as described in a). Baseline albuminuria before interventions was determined after 16 weeks of hyperglycemia (DM-16). df Expression of renal p21 mRNA (Cdkn1a, qRT-PCR, d; and protein, f), renal DNMT1 mRNA (Dnmt1, qRT-PCR, e), and renal KIM-1 (protein, f) in experimental groups (as described in a). Exemplary immunoblots (f; GAPDH: loading control). g Exemplary histological images of periodic acid Schiff stain (PAS), interstitial fibrosis (Masson’s trichrome stain, MTS), SA- β-gal. stain (senescence associated β-galactosidase), and γ-H2A.X (histone H2A, family X, red, immunofluorescent, DAPI nuclear counterstain, insets: larger magnification) in experimental groups (as described in a); all scale bars represent 20 μm. Line graph or dot plots reflecting mean ± SEM of six mice per group; one-way ANOVA with Sidak’s multiple comparison test. Gels/blots were processed in parallel; source data are provided as a Source Data file-Fig-8.
Fig. 9
Fig. 9. Proposed model summarizing the p21-dependent regulation of the hyperglycemic memory and possible interventions.
Hyperglycemia suppresses DNMT1 expression in the tubular compartment, inducing hypomethylation of the p21 promoter, p21 expression, and tubular senescence. The latter is associated with inflammation, impairs the endogenous tubular repair capability and induces tubulointerstitial fibrosis, promoting tubulointerstitial damage and DKD. Exploiting aPC-signaling (Parmodulin, 3K3A-aPC) reverses the epigenetically sustained p21 expression.

Similar articles

Cited by

References

    1. Fouli, G. E. & Gnudi, L. The future: experimental therapies for renal disease in Diabetes. Nephron, 1–5, 10.1159/000492825 (2018). - PubMed
    1. Wyatt CM, Cattran DC. Intensive glycemic control and the risk of end-stage renal disease: an ADVANCE in the management of diabetes. Kidney Int. 2016;90:8–10. doi: 10.1016/j.kint.2016.05.002. - DOI - PubMed
    1. Barutta F, Bernardi S, Gargiulo G, Durazzo M, Gruden G. SGLT2 inhibition to address the unmet needs in diabetic nephropathy. Diabetes Metab. Res Rev. 2019;35:e3171. doi: 10.1002/dmrr.3171. - DOI - PMC - PubMed
    1. Kato M, Natarajan R. Epigenetics and epigenomics in diabetic kidney disease and metabolic memory. Nat. Rev. Nephrol. 2019;15:327–345. doi: 10.1038/s41581-019-0135-6. - DOI - PMC - PubMed
    1. Reidy K, Kang HM, Hostetter T, Susztak K. Molecular mechanisms of diabetic kidney disease. J. Clin. Investig. 2014;124:2333–2340. doi: 10.1172/JCI72271. - DOI - PMC - PubMed

Publication types

Substances