. 2022 Aug 27;79(9):500.
doi: 10.1007/s00018-022-04513-w.

Misfolded protein oligomers induce an increase of intracellular Ca2+ causing an escalation of reactive oxidative species

Affiliations

Misfolded protein oligomers induce an increase of intracellular Ca2+ causing an escalation of reactive oxidative species

Giulia Fani et al. Cell Mol Life Sci. .

Abstract

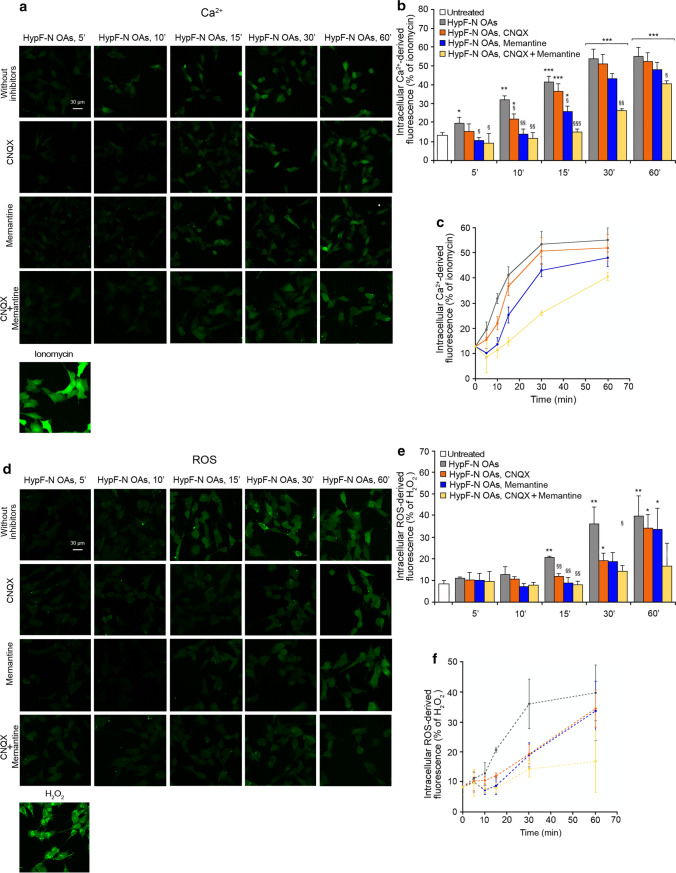
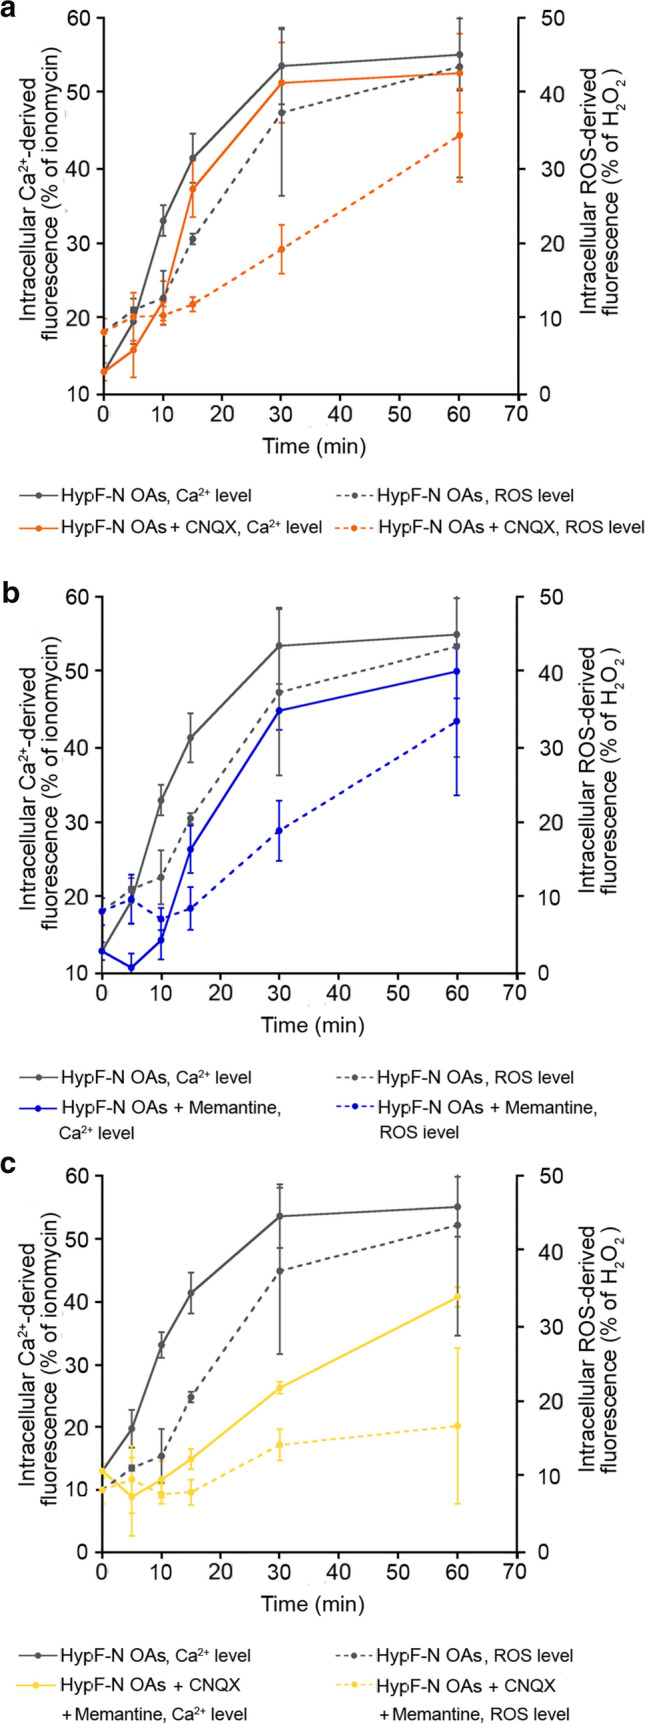
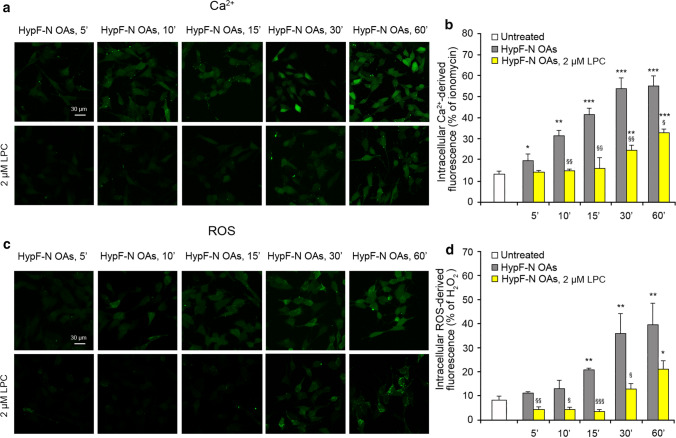
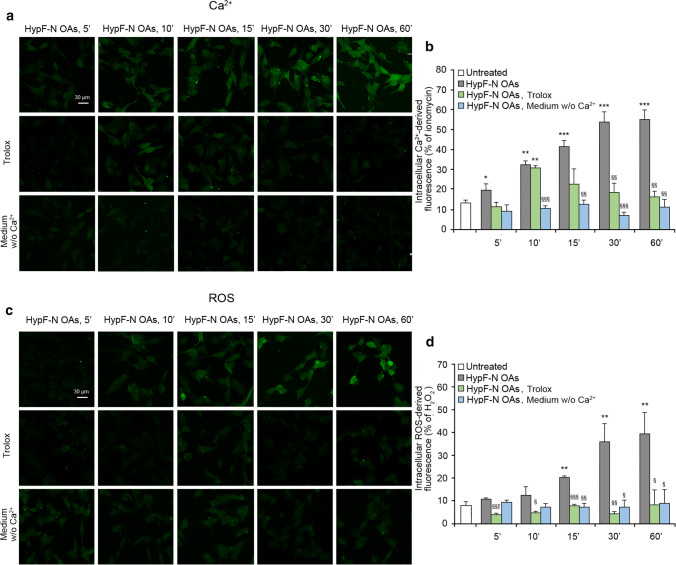
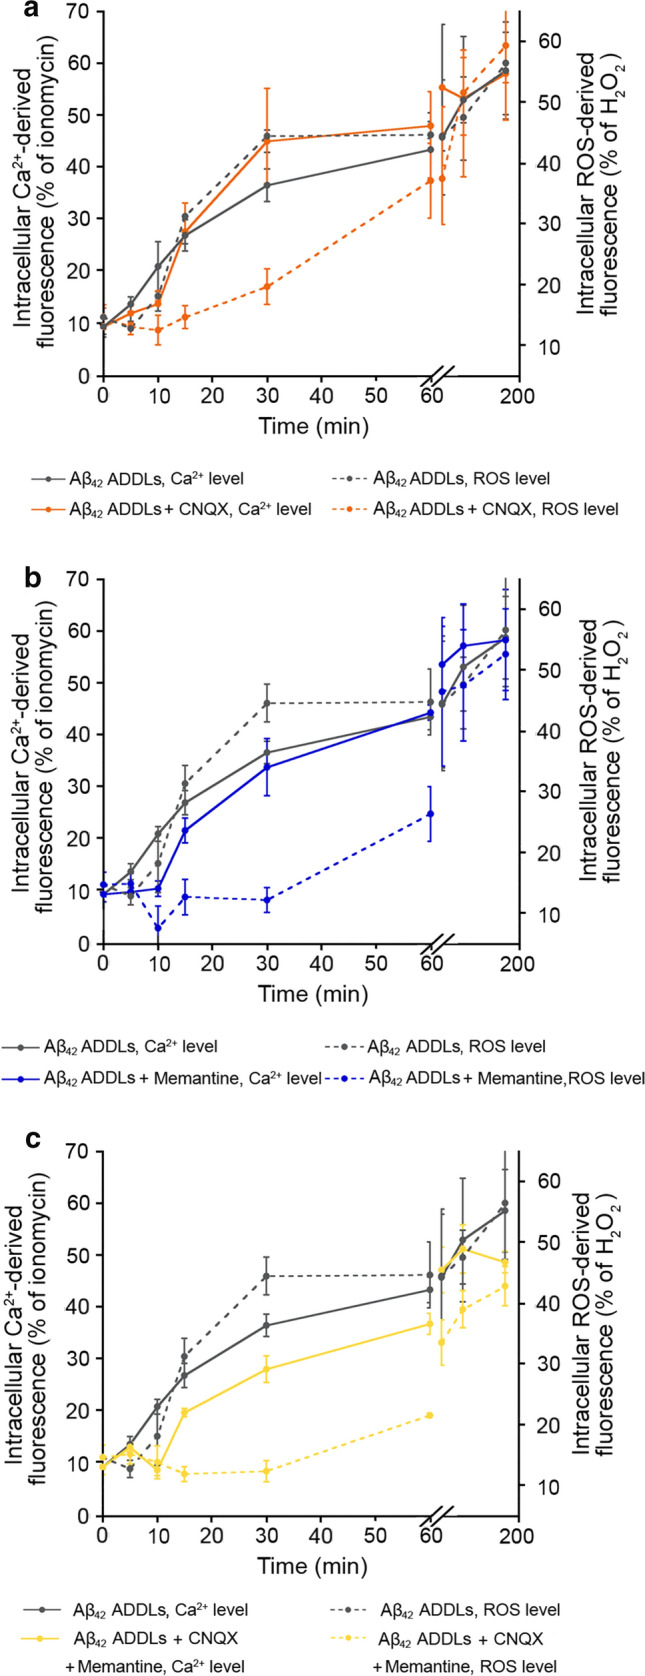
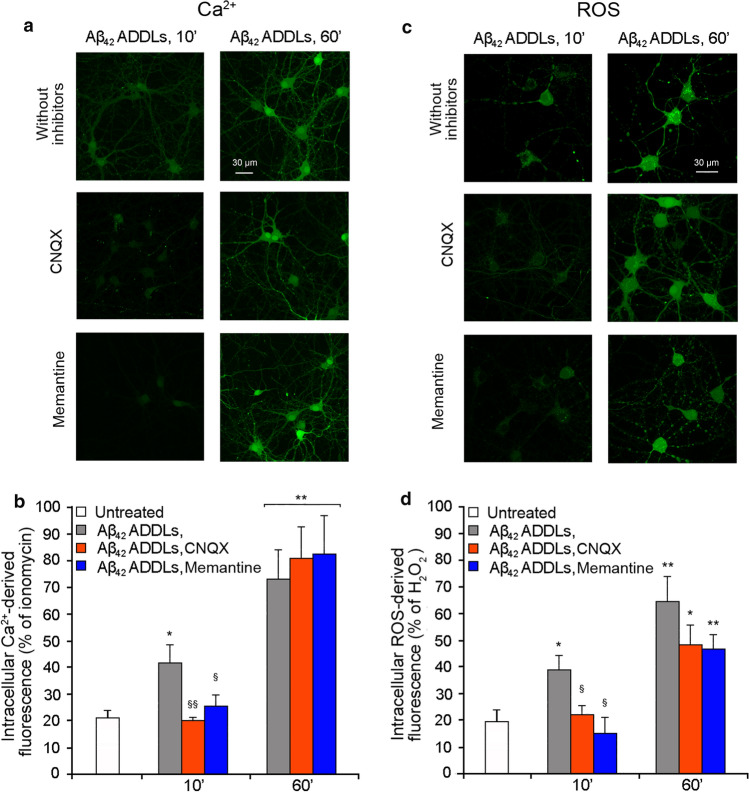
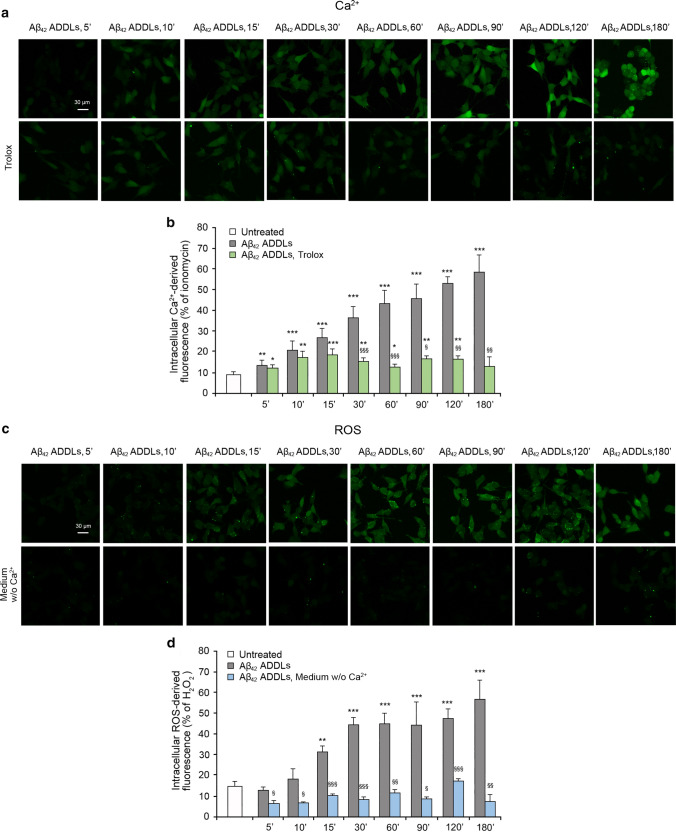
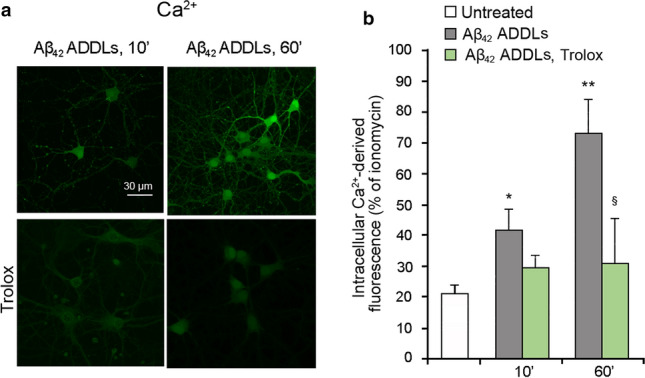
Alzheimer's disease is characterized by the accumulation in the brain of the amyloid β (Aβ) peptide in the form of senile plaques. According to the amyloid hypothesis, the aggregation process of Aβ also generates smaller soluble misfolded oligomers that contribute to disease progression. One of the mechanisms of Aβ oligomer cytotoxicity is the aberrant interaction of these species with the phospholipid bilayer of cell membranes, with a consequent increase in cytosolic Ca2+ levels, flowing from the extracellular space, and production of reactive oxygen species (ROS). Here we investigated the relationship between the increase in Ca2+ and ROS levels immediately after the exposure to misfolded protein oligomers, asking whether they are simultaneous or instead one precedes the other. Using Aβ42-derived diffusible ligands (ADDLs) and type A HypF-N model oligomers (OAs), we followed the kinetics of ROS production and Ca2+ influx in human neuroblastoma SH-SY5Y cells and rat primary cortical neurons in a variety of conditions. In all cases we found a faster increase of intracellular Ca2+ than ROS levels, and a lag phase in the latter process. A Ca2+-deprived cell medium prevented the increase of intracellular Ca2+ ions and abolished ROS production. By contrast, treatment with antioxidant agents prevented ROS formation, did not prevent the initial Ca2+ flux, but allowed the cells to react to the initial calcium dyshomeostasis, restoring later the normal levels of the ions. These results reveal a mechanism in which the entry of Ca2+ causes the production of ROS in cells challenged by aberrant protein oligomers.

Keywords: AMPA receptors; Calcium homeostasis; Membrane destabilization; NMDA receptors; Neurodegenerative diseases; Oxidative stress; Protein misfolding.


Conflict of interest statement

The authors have no relevant financial or non-financial interests to disclose.

Figures

Fig. 1
Fig. 1
Toxic HypF-N oligomers increase intracellular Ca2+ levels and ROS production. a Representative confocal scanning microscopy images of free Ca2+ levels in SH-SY5Y cells following the treatment with no inhibitors (first row), 5 µM CNQX (second row), 10 µM memantine (third row), and both inhibitors (fourth row), and analysed after 5, 10, 15, 30 and 60 min of treatment with 12 µM (monomer equivalents) HypF-N OAs. A positive control of Ca2+ influx following treatment with 1 µM ionomycin for 1 h is shown at the bottom. b Semi-quantitative analysis of intracellular free Ca2+-derived fluorescence. The Ca2+ levels for untreated cells were not found to vary with time (Fig. S1a–c) and for simplicity the value recorded at time 0 min was reported, here and in other figures. c Kinetic plots showing the fluorescence versus time as reported in panel b. d Representative confocal scanning microscopy images of intracellular ROS levels in SH-SY5Y cells following the treatment with no inhibitors (first row), 5 µM CNQX (second row) 10 µM memantine (third row) and both inhibitors (fourth row), and analysed after 5, 10, 15, 30 and 60 min of treatment with 12 µM (monomer equivalents) HypF-N OAs. A positive control of ROS production following treatment with 250 µM H2O2 for 1 h is shown at the bottom. e Semi-quantitative analysis of intracellular ROS-derived fluorescence. The ROS levels for untreated cells were not found to vary with time (Fig. S1d–f) and for simplicity the value recorded at time 15 min was reported, here and in other figures. f Kinetic plots showing the fluorescence versus time as reported in panel e. Three different experiments were carried out, with 10–22 cells each, for each condition. Data are represented as mean ± SEM (n = 3). The single (*), double (**) and triple (***) asterisks refer to p values < 0.05, < 0.01 and < 0.001, respectively, relative to untreated cells. The single (§), double (§§) and triple (§§§) symbols refer to p values < 0.05, < 0.01 and < 0.001, respectively, relative to HypF-N OAs without inhibitors at corresponding time points
Fig. 2
Fig. 2
Increase of intracellular Ca2+ levels precedes ROS production. ac Kinetic plots showing the fluorescence associated with intracellular Ca2+ and ROS versus time after treatment with HypF-N OAs. The time courses refer to Ca2+ levels (solid lines) and ROS levels (dotted lines) without inhibitors (grey), with CNQX (orange), with memantine (blue) and with both CNQX and memantine (yellow)
Fig. 3
Fig. 3
Lysophosphatidylcholine (LPC) enrichment reduces both the Ca2+ level increase and ROS production. a Representative confocal scanning microscopy images of intracellular free Ca2+ levels in SH-SY5Y cells following no treatment (first row) and treatment with 2 µM LPC (second row), and analysed after 5, 10, 15, 30, and 60 min of treatment with 12 µM (monomer equivalents) HypF-N OAs. b Semi-quantitative analysis of intracellular Ca2+-derived fluorescence. The value for untreated cells refers to 0 min and did not change with time. c Representative confocal scanning microscopy images of intracellular ROS levels in SH-SY5Y cells following no treatment (first row) and treatment with 2 µM LPC (second row), and analysed after 5, 10, 15, 30, and 60 min of treatment with 12 µM (monomer equivalents) HypF-N OAs. d Semi-quantitative analysis of intracellular ROS-derived fluorescence. The value for untreated cells refers to 15 min and did not change with time. Three different experiments were carried out, with 10–22 cells each, for each condition. Data are represented as mean ± SEM (n = 3). The single (*), double (**) and triple (***) asterisks refer to p values < 0.05, < 0.01 and < 0.001, respectively, relative to untreated cells. The single (§), double (§§) and triple (§§§) symbols refer to p values < 0.05, < 0.01 and 0.001, respectively, relative to HypF-N OAs without treatment with LPC at corresponding time points
Fig. 4
Fig. 4
Intracellular Ca2+ influx and ROS production induced by HypF-N OAs are connected. a Representative confocal scanning microscopy images of intracellular free Ca2+ levels in SH-SY5Y cells following no treatment (first row), pre-treatment with 30 µM Trolox (second row), and in a medium without Ca2+ (third row), and analysed after 5, 10, 15, 30, and 60 min of treatment with 12 µM (monomer equivalents) HypF-N OAs. b Semi-quantitative analysis of intracellular Ca2+-derived fluorescence. The value for untreated cells refers to 0 min and did not change with time. c Representative confocal scanning microscopy images of intracellular ROS levels in SH-SY5Y cells following no treatment (first row), pre-treatment with 30 µM Trolox (second row), and in a medium without Ca2+ (third row), and analysed after 5, 10, 15, 30, and 60 min of treatment with 12 µM (monomer equivalents) HypF-N OAs. d Semi-quantitative analysis of intracellular ROS-derived fluorescence. The value for untreated cells refers to 15 min and did not change with time. Three different experiments were carried out, with 10–22 cells each, for each condition. Data are represented as mean ± SEM (n = 3). The single (*), double (**) and triple (***) asterisks refer to p values < 0.05, < 0.01 and < 0.001, respectively, relative to untreated cells. The single (§), double (§§) and triple (§§§) symbols refer to p values < 0.05, < 0.01 and 0.001, respectively, relative to HypF-N OAs without treatment with Trolox or Ca2+-deprived medium at corresponding time points
Fig. 5
Fig. 5
42 ADDLs oligomers increase intracellular Ca2+ levels and ROS production in SH-SY5Y cells. a Representative confocal scanning microscopy images of free Ca2+ levels in SH-SY5Y cells following the treatment with no inhibitors (first row), 5 µM CNQX (second row), 10 µM memantine (third row), and both inhibitors (fourth row), and analysed after 5, 10, 15, 30, 60, 90, 120 and 180 min of treatment with 1 µM (monomer equivalents) Aβ42 ADDLs oligomers. b Semi-quantitative analysis of intracellular free Ca2+-derived fluorescence. The value for untreated cells refers to 0 min and did not change with time. c Kinetic plots showing the fluorescence versus time as reported in panel b. d Representative confocal scanning microscopy images of intracellular ROS levels in SH-SY5Y cells following the treatment with no inhibitors (first row), 5 µM CNQX (second row), 10 µM memantine (third row), and both inhibitors (fourth row), and analysed after 5, 10, 15, 30, 60, 90, 120 and 180 min of treatment with 1 µM (monomer equivalents) Aβ42 ADDLs oligomers. e Semi-quantitative analysis of intracellular ROS-derived fluorescence. The value for untreated cells refers to 15 min and did not change with time. f Kinetic plots showing the fluorescence versus time as reported in panel e. Three different experiments were carried out, with 10–22 cells each, for each condition. Data are represented as mean ± SEM (n = 3). The single (*), double (**) and triple (***) asterisks refer to p values < 0.05, < 0.01 and < 0.001, respectively, relative to untreated cells. The single (§), double (§§) and triple (§§§) symbols refer to p values < 0.05, < 0.01 and 0.001, respectively, relative to Aβ42 ADDLs oligomers without inhibitors at corresponding time points
Fig. 6
Fig. 6
Increase of intracellular Ca2+ levels anticipates ROS production in SH-SY5Y cells. a–c Kinetic plots showing the fluorescence associated with intracellular Ca2+ and ROS versus time after treatment with Aβ42 ADDLs. The time courses refer to Ca.2+ levels (solid lines) and ROS levels (dotted line) without inhibitors (grey), with CNQX (orange), with memantine (blue) and with both CNQX and memantine (yellow)
Fig. 7
Fig. 7
42 ADDLs oligomers increase intracellular Ca2+ levels and ROS production in primary rat cortical neurons. a Representative confocal scanning microscopy images of intracellular free Ca2+ levels in primary rat cortical neurons treated with no inhibitors (first row), 5 µM CNQX (second row) and 10 µM memantine (third row), and analysed after 10 and 60 min of treatment with 1 µM (monomer equivalents) Aβ42 ADDLs oligomers. b Semi-quantitative analysis of intracellular free Ca2+-derived fluorescence. c Representative confocal scanning microscopy images of intracellular ROS levels in primary rat cortical neurons treated with no inhibitors (first row), 5 µM CNQX (second row) and 10 µM memantine (third row), and analysed after 10 and 60 min of treatment with 1 µM (monomer equivalents) Aβ42 ADDLs oligomers. d Semi-quantitative analysis of intracellular ROS-derived fluorescence. Three different experiments were carried out, with 10–22 cells each, for each condition. Data are represented as mean ± SEM (n = 3). The single (*) and double (**) asterisks refer to p values < 0.05 and < 0.01, respectively, relative to untreated cells. The single (§) and double (§§) symbols refer to p values < 0.05 and < 0.01, respectively, relative to Aβ42 ADDLs oligomers without inhibitors at corresponding time points
Fig. 8
Fig. 8
Intracellular Ca2+ influx and ROS production induced by Aβ42 ADDLs are connected in SH-SY5Y cells. a Representative confocal scanning microscopy images of intracellular free Ca2+ levels in SH-SY5Y cells following no treatment (first row), and pre-treatment with 30 µM Trolox (second row), and analysed after 5, 10, 15, 30, 60, 90, 120 and 180 min of treatment with 1 µM (monomer equivalents) Aβ42 ADDLs oligomers. b Semi-quantitative analysis of intracellular Ca2+-derived fluorescence. The value for untreated cells refers to 0 min and did not change with time. c Representative confocal scanning microscopy images of intracellular ROS levels in SH-SY5Y cells following no treatment (first row), and treatment in a medium without Ca2+ (second row), and analysed after 5, 10, 15, 30, 60, 90, 120 and 180 min of treatment with 1 µM (monomer equivalents) Aβ42 ADDLs oligomers. d Semi-quantitative analysis of intracellular ROS-derived fluorescence. The value for untreated cells refers to 15 min and did not change with time. Three different experiments were carried out, with 10–22 cells each, for each condition. Data are represented as mean ± SEM (n = 3). The double (**) and triple (***) asterisks refer to p values < 0.01 and < 0.001, respectively, relative to untreated cells. The single (§), double (§§) and triple (§§§) symbols refer to p values < 0.05, < 0.01 and < 0.001, respectively, relative to Aβ42 ADDLs oligomers without treatment with Trolox or Ca2+-deprived medium at corresponding time points
Fig. 9
Fig. 9
Intracellular Ca2+ influx and ROS production induced by Aβ42 ADDLs are connected in primary rat cortical neurons. a Representative confocal scanning microscopy images of intracellular free Ca2+ levels in primary rat cortical neurons with no treatment (first row), and pre-treatment with 30 µM Trolox (second row), and analysed after 10 and 60 min of treatment with 1 µM (monomer equivalents) Aβ42 ADDLs oligomers. b Semi-quantitative analysis of intracellular free Ca2+-derived fluorescence. Three different experiments were carried out, with 10–22 cells each, for each condition. Data are represented as mean ± SEM (n = 3). The single (*) and double (**) asterisks refer to p values < 0.05 and < 0.01, respectively, relative to untreated cells. The single (§) symbol refers to p values < 0.05 relative to Aβ42 ADDLs oligomers without pre-treatment with Trolox at corresponding time points

Similar articles

Cited by

References

    1. Selkoe DJ, Hardy J. The amyloid hypothesis of Alzheimer's disease at 25 years. EMBO Mol Med. 2016;8:595–608. doi: 10.15252/emmm.201606210. - DOI - PMC - PubMed
    1. Stancu IC, Vasconcelos B, Terwel D, Dewachter I. Models of β-amyloid induced Tau-pathology: the long and “folded” road to understand the mechanism. Mol Neurodegener. 2014;9:51. doi: 10.1186/1750-1326-9-51. - DOI - PMC - PubMed
    1. Chiti F, Dobson CM. Protein misfolding, amyloid formation, and human disease: a summary of progress over the last decade. Annu Rev Biochem. 2017;86:27–68. doi: 10.1146/annurev-biochem-061516-045115. - DOI - PubMed
    1. Haass C, Selkoe DJ. Soluble protein oligomers in neurodegeneration: lessons from the Alzheimer's amyloid beta-peptide. Nat Rev Mol Cell Biol. 2007;8:101–112. doi: 10.1038/nrm2101. - DOI - PubMed
    1. Benilova I, Karran E, De Strooper B. The toxic Aβ oligomer and Alzheimer’s disease: an emperor in need of clothes. Nat Neurosci. 2012;15:349–357. doi: 10.1038/nn.3028. - DOI - PubMed

Substances