. 2022 Aug;12(8):e988.
doi: 10.1002/ctm2.988.

IL-34 deficiency impairs FOXP3+ Treg function in a model of autoimmune colitis and decreases immune tolerance homeostasis

Affiliations

IL-34 deficiency impairs FOXP3+ Treg function in a model of autoimmune colitis and decreases immune tolerance homeostasis

Antoine Freuchet et al. Clin Transl Med. 2022 Aug.

Abstract

Background: Immune homeostasis requires fully functional Tregs with a stable phenotype to control autoimmunity. Although IL-34 is a cytokine first described as mainly involved in monocyte cell survival and differentiation, we recently described its expression by CD8+ Tregs in a rat model of transplantation tolerance and by activated FOXP3+ CD4+ and CD8+ Tregs in human healthy individuals. However, its role in autoimmunity and potential in human diseases remains to be determined.

Methods: We generated Il34-/- rats and using both Il34-/- rats and mice, we investigated their phenotype under inflammatory conditions. Using Il34-/- rats, we further analyzed the impact of the absence of expression of IL-34 for CD4+ Tregs suppressive function. We investigated the potential of IL-34 in human disease to prevent xenogeneic GVHD and human skin allograft rejection in immune humanized immunodeficient NSG mice. Finally, taking advantage of a biocollection, we investigated the correlation between presence of IL-34 in the serum and kidney transplant rejection.

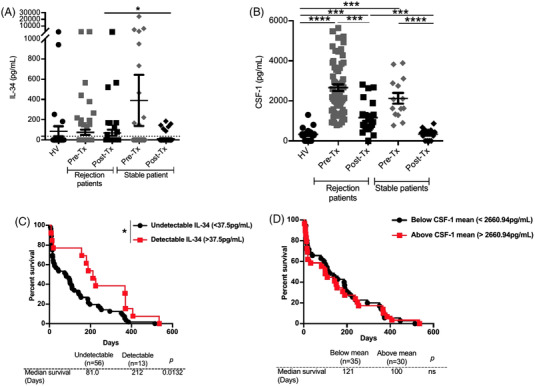
Results: Here we report that the absence of expression of IL-34 in Il34-/- rats and mice leads to an unstable immune phenotype, with production of multiple auto-antibodies, exacerbated under inflammatory conditions with increased susceptibility to DSS- and TNBS-colitis in Il34-/- animals. Moreover, we revealed the striking inability of Il34-/- CD4+ Tregs to protect Il2rg-/- rats from a wasting disease induced by transfer of pathogenic cells, in contrast to Il34+/+ CD4+ Tregs. We also showed that IL-34 treatment delayed EAE in mice as well as GVHD and human skin allograft rejection in immune humanized immunodeficient NSG mice. Finally, we show that presence of IL-34 in the serum is associated with a longer rejection-free period in kidney transplanted patients.

Conclusion: Altogether, our data emphasize on the crucial necessity of IL-34 for immune homeostasis and for CD4+ Tregs suppressive function. Our data also shows the therapeutic potential of IL-34 in human transplantation and auto-immunity.

Highlights: -Absence of expression of IL-34 in Il34-/- rats and mice leads to an unstable immune phenotype, with a production of multiple auto-antibodies and exacerbated immune pathology under inflammatory conditions. -Il34-/- CD4+ Tregs are unable to protect Il2rg-/- rats from colitis induced by transfer of pathogenic cells. -IL-34 treatment delayed EAE in mice, as well as acute GVHD and human skin allograft rejection in immune-humanized immunodeficient NSG mice.

Keywords: CRISPR/Cas9; Foxp3; IL-34; Treg; autoimmunity; immunotherapy; knockout; rat; tolerance.


Conflict of interest statement

C.G., I.A. and S.B. have patents registered on IL‐34.

Figures

FIGURE 1
FIGURE 1
Generation of Il34 / rats by CRISPR/Cas9 and characterization. (A) Schematic representing the Cas9/sgRNA targeting the exon three of the Il34 gene inducing a genomic DNA cut (arrow). PAM sequence is in red. (B) Il34 mRNA expression was assessed by quantitative real‐time PCR in spleen, liver and brain of Il34+/+ (n = 7–10) and Il34 / rats (n = 7–9). Results are normalized to Hprt and expressed as 2−ΔΔ CT  ± SEM. (C) Confocal microscopy was performed on Il34 +/+ and Il34 / rats frozen brains stained with an antibody directed against CD11b/c (green) to identify microglia and DAPI (blue). Arrows indicate a representative stained cell. Original magnification, ×800. Scale bar 50 μm. (D) Quantification of positive CD11b/c staining areas in Il34 +/+ and Il34 / rats’ hippocampus (Il34 +/+, n = 8; Il34 −/−, n = 8) and cerebellum (Il34 +/+, n = 3; Il34 −/−, n = 3) slices. Each dot represents an individual animal and results are expressed as mean ± SEM. (E) Plasma from 4‐month‐old Il34+/+ (n = 9) and Il34 / (n = 14) rats was used to quantify AST, ALT, ALT/LDH ratio and alkaline phosphatase. (F) Auto‐antibodies against interferon (IFN)‐α1, α2, α4, α7, α11 and IL‐22 were assessed in sera by luciferase immunoprecipitation systems (LIPS) assay (>6‐month‐old Il34 +/+ rat, n = 10 and Il34 / rat, n = 16). (G) Eotaxin, TGF‐β3 and MIP‐2 protein levels were quantified by Luminex assay in the sera of >6‐month‐old Il34 +/+ (n = 10) and Il34 / (n = 16) rats. (H) CSF‐1 protein was quantified by ELISA in the sera of >6‐month‐old Il34 +/+ (n = 8) versus Il34 / rats (n = 12). Results are expressed as mean ± SEM. Mann–Whitney U test, *p < .05, **p < .01, ***p < .001, ****p < .0001
FIGURE 2
FIGURE 2
IL‐34 global deficiency increases CD8+ T cells proliferation capacity and colitis severity. (A) Absolute numbers of cells were analysed in thymus (2‐month old), spleen and blood (>10‐month old) of Il34 +/+ (n = 5–10) and Il34 / (n = 6–11) rats. (B) Absolute numbers of T cell subsets were analysed in spleen (left) and blood (right) of >10‐month‐old Il34 +/+ (n = 5–10) and Il34 / (n = 6–11) rats using markers described in the Supporting Information section. (C) Effector TCRαβ+CD4+CD25 (CD4+ Teffs) and TCRαβ+CD4CD45RChigh (CD8+ Teffs) from Il34 +/+ (n = 7–8) or Il34 / (n = 5–7) rats were sorted and tested for proliferation capacity over 2‐day culture with an increasing concentration of anti‐CD3 (.25–.5–1 μg/ml) and anti‐CD28 (10 μg/ml) mAbs. Results are represented as mean ± SEM. (D) Left panel: Schematic of the acute DSS model: 5.5% of DSS in drinking water was given for 7 days to 9‐week‐old male Il34 +/+ (n = 8) or Il34 / rats (n = 11). Il34 +/+ control rats were given regular water (n = 8). Right panel: A clinical score of colitis severity was established and followed every day. (E) At day 7, rats were sacrificed and the colon length measured and H&E stained. Results are represented as mean ± SEM and representative of two independent experiments. Colon sections of Il34+/+ and Il34−/− rats treated or not with 5.5% of DSS were stained with H&E. Histopathological enlarged images (upper panel, scale bar = 1000 μm) and focused on epithelial injury (lower panel, scale bar = 250 μm) are presented. In colon, crypts rarefaction and/or cell infiltration of the lamina propria and the submucosa were present (indicated by arrows). Data are representative of eight animals in each group. Mann–Whitney U test, a two‐way ANOVA with a Bonferroni post‐test for clinical score and log‐rank test for survival analysis, *p < .05, ****p < .0001
FIGURE 3
FIGURE 3
Il34 / CD4 Tregs fail to protect from the wasting disease. (A) Schematic showing the wasting disease model induction. (B) Six‐week‐old Il2rg / rats were injected i.v. with 2.5 × 106 TCRαβ+CD4+CD45RChigh Teffs from Il34+/+ rats (Teffs; n = 12) in association or not with TCRαβ+CD4+CD25+CD127low Tregs (CD4+ Tregs; 3.5:1 Teffs:Tregs ratio) from Il34+/+ (n = 8) or Il34−/− (n = 8) rats in seven independent experiments. (C) Liver and colon sections of injected Il2rg / rats were stained with haematoxylin eosin saffron (HES) (original magnification ×10, scale bar 20 μm). Data are representative of six animals in each group. (D) Six‐week‐old Il2rg / rats were injected i.v. with TCRαβ+CD4+CD45RChigh Teffs from Il34+/+ rats (Teffs) in association with or not with TCRαβ+CD4CD45RClow/− Tregs (CD8+ Tregs; 2.1:1 Teffs:Tregs ratio) from Il34+/+ (n = 7) or Il34−/− (n = 7) rats in five independent experiments. (E) Liver and colon sections of injected Il2rg / rats were stained with HES (original magnification ×10). Data are representative of six animals in each group. (F) (left) 3′ DGE‐RNA sequencing analysis was performed on sorted and non‐stimulated TCRαβ+CD4+CD25+CD127low Tregs (CD4+ Tregs) and TCRαβ+CD4CD45RClow/− Tregs (CD8+ Tregs) from 8–10‐week‐old Il34+/+ (n = 7) and Il34−/− rats (n = 8–9). The table recapitulates the results of Dnaja1, the only gene differentially expressed between Il34−/− versus Il34+/+ CD4+ Tregs and Il34−/− versus Il34+/+ CD8+ Tregs. (Right) Transcript levels of Dnaja1 (UPM) log scale in CD4+ and CD8+ Treg in Il34+/+ or Il34−/− rats. Mann–Whitney U test, a two‐way ANOVA with a Bonferroni post‐test for clinical score and log‐rank test for survival analysis, *p < .05, **p < .01, ***p < .001, ****p < .0001
FIGURE 4
FIGURE 4
Il34 / mice are more susceptible to autoimmune diseases. (A) Schematic showing the TNBS‐induced colitis. The model was performed on Il34+/+ versus Il34−/− mice (n = 11–13) via the intrarectal administration of TNBS (100 mg/kg) in 50% ethanol. Control Il34+/+ mice were injected with 50% ethanol alone or not treated. Mice colon length was measured at day 3 post‐injection. Each dot represents an animal. Results are represented as mean ± SEM. (B) Schematic showing the MOG‐induced experimental autoimmune encephalomyelitis (EAE) model in mice. Adult Il34 +/+ (n = 14) and Il34 / (n = 10) C57BL/6J mice of 8‐week old were immunized with the peptide MOG35–55 and mycobacterium for EAE induction. The development of the disease was followed by a daily weight and scoring assessment. (C) Schematic showing the IL‐34 overexpression in the MOG‐induced EAE model. Adult Il34+/+ mice of 8‐week old were i.v. injected with an adenovirus coding for mouse IL‐34 (Ad‐IL‐34) or a control (Ad‐null) 2 days before inducing the EAE. Rapamycin was administered or not every day for 15 days at a dose of .25 mg/kg/d (i.p. injection; grey area). The development of the disease was followed by a daily weight and scoring assessment. Results are represented as mean ± SEM. Mann–Whitney U test or two‐way ANOVA and a Bonferroni posttest for the score analyses. *p < .05; **p < .01, ***p < .001, ****p < .0001
FIGURE 5
FIGURE 5
Human IL‐34 recombinant protein administration delays graft‐versus‐host‐disease (GVHD) as well as skin allograft rejection in humanized NSG mice. The therapeutic potential of IL‐34 was tested in (A) GVHD and (B) human skin graft allogeneic rejection models in humanized immunodeficient NSG mice. (A) IL‐34 was administered with a mini‐osmotic pump delivering a constant rate for 14 days (.42 μg/h) with or without rapamycin (.4 mg/kg/d for 10 days). (A) For GVHD, 1.5 × 107 fresh PBMCs were i.v. injected in 1.5‐Gy irradiated 8–12‐week‐old NOD/SCID/IL2rg−/− (NSG) mice, and the survival of mice was measured by weight loss. (B) For skin allograft rejection, 5 × 106 fresh PBMCs were i.v. injected in mice grafted with human skin 4 weeks before. Graft survival was scored on macroscopic signs of rejection from 0 to 5 and considered rejected at a score of 3. Log‐rank tests for survival analysis. *p > .05, **p < .01 and ***p < .001
FIGURE 6
FIGURE 6
Pre‐transplantation IL‐34 levels as a marker of higher rejection‐free episodes in human kidney transplant patients. (A) IL‐34 and (B) CSF‐1 were quantified in the serum of healthy volunteers (n = 30 and n = 20, respectively) and in patients before (Pre‐Tx) and after (Post‐Tx) transplantation with a stable graft function or having had ≥1 episode of acute rejection within the 18 months following Tx (see Table S3 for clinical characteristics; pre‐Tx: rejection patients n = 71 and n = 65, stable patients n = 101 and n = 14; post‐Tx: rejection patients n = 42 and n = 22, stable patients n = 71 and n = 15 for IL‐34 and CSF‐1 serum levels respectively). (C and D) Graft survival of patients with an acute rejection episode occurrence according to pre‐Tx IL‐34 detectability (undetectable: ≤37.5 vs. detectable: ≥37.5 pg/ml) (C) or CSF‐1 mean expression (below vs. above 2660.94 pg/ml) (D). Mann–Whitney U test and log‐rank tests for survival analysis. *p > .05, **p < .01, ***p < .001 and ****p < .0001

References

    1. Guillonneau C, Bézie S, Anegon I. Immunoregulatory properties of the cytokine IL‐34. Cell Mol Life Sci. 2017;74:2569‐2586. doi:10.1007/s00018-017-2482-4 - DOI - PMC - PubMed
    1. Baghdadi M, Umeyama Y, Hama N, et al. Interleukin‐34, a comprehensive review. J Leukoc Biol. 2018;104:931‐951. doi:10.1002/JLB.MR1117-457R - DOI - PubMed
    1. Lin H, Lee E, Hestir K, et al. Discovery of a cytokine and its receptor by functional screening of the extracellular proteome. Science. 2008;320:807‐811. doi:10.1126/science.1154370 - DOI - PubMed
    1. Foucher ED, Blanchard S, Preisser L, et al. IL‐34 induces the differentiation of human monocytes into immunosuppressive macrophages. antagonistic effects of GM‐CSF and IFNγ. PLoS ONE. 2013;8:e56045. doi:10.1371/journal.pone.0056045 - DOI - PMC - PubMed
    1. Freuchet A, Salama A, Remy S, et al. IL‐34 and CSF‐1, deciphering similarities and differences at steady state and in diseases. Journal of Leukocyte Biology. 2021. doi:10.1002/JLB.3RU1120-773R - DOI - PubMed

Publication types

LinkOut - more resources