. 2022 Oct;9(29):e2202679.
doi: 10.1002/advs.202202679. Epub 2022 Aug 28.

New Deferric Amine Compounds Efficiently Chelate Excess Iron to Treat Iron Overload Disorders and to Prevent Ferroptosis

Affiliations

New Deferric Amine Compounds Efficiently Chelate Excess Iron to Treat Iron Overload Disorders and to Prevent Ferroptosis

Wenya Feng et al. Adv Sci (Weinh). 2022 Oct.

Abstract

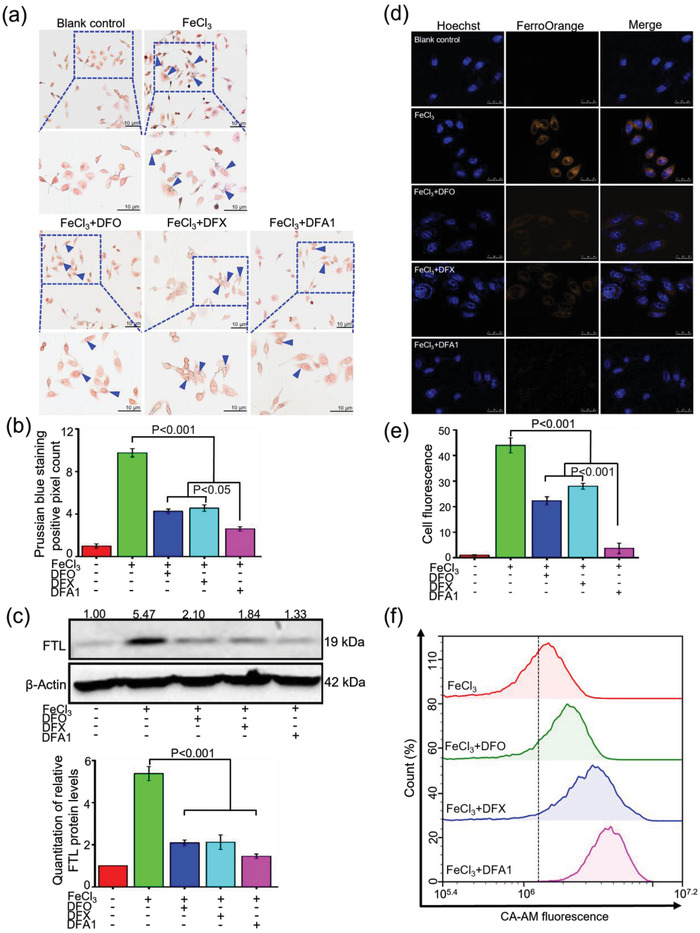
Excess iron accumulation occurs in organs of patients with certain genetic disorders or after repeated transfusions. No physiological mechanism is available to excrete excess iron and iron overload to promote lipid peroxidation to induce ferroptosis, thus iron chelation becomes critical for preventing ion toxicity in these patients. To date, several iron chelators have been approved for iron chelation therapy, such as deferiprone and deferoxamine, but the current iron chelators suffer from significant limitations. In this context, new agents are continuously sought. Here, a library of new deferric amine compounds (DFAs) with adjustable skeleton and flexibility is synthesized by adopting the beneficial properties of conventional chelators. After careful evaluations, compound DFA1 is found to have greater efficacy in binding iron through two molecular oxygens in the phenolic hydroxyl group and the nitrogen atom in the amine with a 2:1 stoichiometry. This compound remarkably ameliorates iron overload in diverse murine models through both oral and intravenous administration, including hemochromatosis, high iron diet-induced, and iron dextran-stimulated iron accumulation. Strikingly, this compound is found to suppress iron-induced ferroptosis by modulating the intracellular signaling that drives lipid peroxidation. This study opens a new approach for the development of iron chelators to treat iron overload.

Keywords: deferric amine compound; ferroptosis; iron chelator; iron overload; liver injury.


Conflict of interest statement

The authors declare no conflict of interest.

Figures

Figure 1
Figure 1
Synthesis and screening of the DFAs library. a) A diagram showing the synthesis of the library of the DFAs. A total of 7 DFAs were synthesized with formulas in comparison to DFX. b) Values of ΔG, Kb/M–1 and log P of newly synthesized compounds with ferric iron. c) The proposed complex structure of DFA1 in binding with ferric iron.
Figure 2
Figure 2
Screening of the DFAs in binding ferric iron. a) The UV–vis absorption spectra of DFAs upon incubation with FeCl3. b) Quantification of UV–vis absorption peaks at 550 nm for DFX and 7 DFAs after binding to ferric iron. c) Dendrogram display from an unsupervised hierarchical cluster with Ward's method based on the values of ΔG, Kb/M–1, log P, and UV–vis absorption.
Figure 3
Figure 3
Survey of iron chelation efficacy for DFAs in HepG2 cells. a) Prussian blue staining images of HepG2 cells after 3 h per incubation with FeCl3 at 100 µm, followed by treatment with DFO, DFX, and DFA1 at 20 µm for 12 h. The lower panels show the enlarged images. The quantified data of positive pixel counts of Prussian blue staining in HepG2 cells are shown in (b) (n = 3). c) Western blotting determination of FTL protein content in the above‐treated cells. The ratios of FTL to β‐actin were calculated, and the ratio of in the blank control is defined as 1.00. The corresponding ratios are presented above the autoradiograms. Quantified data for multiple biological replicates are shown in the lower panel (n = 3). d) Representative confocal microscopy images showing intracellular ferrous iron in the above‐treated cells, as reflected by FerroOrange probes. Cells were stained with FerroOrange probes (in brown color) to visualize the intracellular ferrous iron. Hoechst 33342 was used to stain nuclei (in blue color). Scale bar, 25 µm. Quantified data of cellular fluorescence were shown in (e) (n = 3). f) Determination of the intracellular ferrous iron concentration, namely LIP, with the Ca‐AM probes in the above‐treated HepG2 cells through flow cytometry.
Figure 4
Figure 4
Parenteral DFA1 relieved iron overload induced by iron dextran in wild‐type mice. a) A diagram of the experimental design. Here, wild‐type mice of 6‐weeks old were subjected to intraperitoneal injection of iron dextran at a dose of 150 mg kg−1 body weight for 1 week, followed by administration with DFO and DFA1 at a dose of 30 mg kg−1 body weight every other day for 2 weeks. b) Hepatic, c) splenic, and d) serum iron was then assayed (n = 5–6). Meanwhile, e) FTL protein levels were determined by Western blot analysis in liver specimens, and quantified data of FTL proteins relative to the internal control are shown in (f) (n = 3). g) Tissue iron staining of liver and spleen sections with Prussian blue (in blue). Scale bar, 100 µm.
Figure 5
Figure 5
Oral administration of DFA1 alleviated iron overload in Hfe–/– mice. a) A diagram depicting the experimental design. After oral treatment for Hfe–/– mice with DFX and DFA1 at a dose of 20 mg kg−1 body weight every other day for 4 weeks, b) hepatic, c) splenic and d) serum iron mass was then determined (n = 5–6). e) Hepatic FTL levels were assessed by Western blot analysis in liver specimens, and quantified data relative to the internal control are shown in (f) (n = 3). g) Tissue iron staining of liver and spleen sections with Prussian blue (in blue color). Scale bar, 100 µm.
Figure 6
Figure 6
DFA1 alleviated iron‐induced ferroptosis in vitro. a) Determination of lipid peroxidation levels in HepG2 cells with pretreatment of FeCl3 at 100 µm for 12 h, followed by treatment with DFO, DFX, and DFA1 at 20 µm for 12 h. Thereafter, lipid peroxidation was assessed by C11‐BODIPY581/591 probes through flow cytometry. b) Representative images of 4‐HNE immunofluorescent staining (in red color) through fluorescent microscopy. DAPI was used to stain nuclei (in blue). Quantification of cellular 4‐HNE fluorescence was shown in (c) (n = 3). d) Cellular MDA content was assayed in the above‐treated HepG2 cells (n = 4), and e) the protein levels of FTL, NOX1, and GPX4 were analyzed by Western blotting. The ratios of target proteins to the internal control are shown above the autoradiograms.
Figure 7
Figure 7
DFA1 mitigated liver cell ferroptosis in mice fed high‐iron diet. a) Representative immunofluorescent images of liver sections with staining of 4‐HNE from mice under high‐iron diet with or without oral administration of DFX and DFA1 at a dose of 20 mg kg−1 body weight every other day for 4 weeks. Scale bar, 100 µm. b) Quantification of hepatic 4‐HNE fluorescence by calculating 4 fields from 2 biological replicates. c) Hepatic MDA levels were measured (n = 6–8). d) Western bolt analysis of hepatic FTL, NOX1, and GPX4 levels in the above‐treated mice, and quantified data relative to the internal control are shown in (e) (n = 3).

Similar articles

Cited by

References

    1. a) Hentze M. W., Muckenthaler M. U., Galy B., Camaschella C., Cell 2010, 142, 24; - PubMed
    2. b) Camaschella C., Nai A., Silvestri L., Haematologica 2020, 105, 260. - PMC - PubMed
    1. a) Hohenberger J., Ray K., Meyer K., Nat. Commun. 2012, 3, 720; - PubMed
    2. b) Krebs C., Fujimori D. G., Walsh C. T., Bollinger J. M. Jr., Acc. Chem. Res. 2007, 40, 484. - PMC - PubMed
    1. a) Halliwell B., Annu. Rev. Nutr. 1996, 16, 33; - PubMed
    2. b) De Domenico I., McVey Ward D., Kaplan J., Nat. Rev. Mol. Cell Biol. 2008, 9, 72; - PubMed
    3. c) Zheng H., Jiang J., Xu S., Liu W., Xie Q., Cai X., Zhang J., Liu S., Li R., Nanoscale 2021, 13, 2266. - PubMed
    1. a) Adams P. C., Reboussin D. M., Barton J. C., McLaren C. E., Eckfeldt J. H., McLaren G. D., Dawkins F. W., Acton R. T., Harris E. L., Gordeuk V. R., Leiendecker‐Foster C., Speechley M., Snively B. M., Holup J. L., Thomson E., Sholinsky P., Acton R. T., Barton J. C., Dixon D., Rivers C. A., Tucker D., Ware J. C., McLaren C. E., McLaren G. D., Anton‐Culver H., Baca J. A., Bent T. C., Brunner L. C., Dao M. M., Jorgensen K. S., et al., N. Engl. J. Med. 2005, 352, 1769; - PubMed
    2. b) Allen K. J., Gurrin L. C., Constantine C. C., Osborne N. J., Delatycki M. B., Nicoll A. J., McLaren C. E., Bahlo M., Nisselle A. E., Vulpe C. D., Anderson G. J., Southey M. C., Giles G. G., English D. R., Hopper J. L., Olynyk J. K., Powell L. W., Gertig D. M., N. Engl. J. Med. 2008, 358, 221; - PubMed
    3. c) Pietrangelo A., N. Engl. J. Med. 2004, 350, 2383. - PubMed
    1. a) Fleming R. E., Ponka P., N. Engl. J. Med. 2012, 366, 348; - PubMed
    2. b) Townsend A., Drakesmith H., Lancet 2002, 359, 786; - PubMed
    3. c) Taher A. T., Weatherall D. J., Cappellini M. D., Lancet 2018, 391, 155. - PubMed

Publication types