. 2022 Oct;9(29):e2200927.
doi: 10.1002/advs.202200927. Epub 2022 Aug 28.

Extracellular Hydraulic Resistance Enhances Cell Migration

Affiliations

Extracellular Hydraulic Resistance Enhances Cell Migration

Debonil Maity et al. Adv Sci (Weinh). 2022 Oct.

Abstract

Cells migrating in vivo encounter microenvironments with varying physical properties. One such physical variable is the fluid viscosity surrounding the cell. Increased viscosity is expected to increase the hydraulic resistance experienced by the cell and decrease cell speed. The authors demonstrate that contrary to this expected result, cells migrate faster in high viscosity media on 2-dimensional substrates. Both actin dynamics and water dynamics driven by ion channel activity are examined. Results show that cells increase in area in high viscosity and actomyosin dynamics remain similar. Inhibiting ion channel fluxes in high viscosity media results in a large reduction in cell speed, suggesting that water flux contributes to the observed speed increase. Moreover, inhibiting actin-dependent vesicular trafficking that transports ion channels to the cell boundary changes ion channel spatial positioning and reduces cell speed in high viscosity media. Cells also display altered Ca2+ activity in high viscosity media, and when cytoplasmic Ca2+ is sequestered, cell speed reduction and altered ion channel positioning are observed. Taken together, it is found that the cytoplasmic actin-phase and water-phase are coupled to drive cell migration in high viscosity media, in agreement with physical modeling that also predicts the observed cell speedup in high viscosity environments.

Keywords: cancer; cell migration; osmotic engine model; tumor microenvironment; viscosity.


Conflict of interest statement

The authors declare no conflict of interest.

Figures

Figure 1
Figure 1
Cell migration speed and cell area increase with increasing extracellular fluid viscosity. A) Measured cell migration speed (instantaneous velocity magnitude) increases as the viscosity of the media is changed. Speeds of MDA‐MB 231 cells in DMEM (N=253), 0.25% MC (N=295), 0.5% MC (N=250), 1% MC (N=278) are shown, together with cell speeds in 1% low viscosity alginate (N = 167) and 1% medium viscosity alginate (N = 148). Cell speed is not significantly changed in media with 5% 70 kDa Dextran (N = 199). The table shows measured viscosity of media used. B,C) Representative cell trajectories of MDA‐MB 231 cells in DMEM and 1% MC, respectively. Cells traverse greater net distances in 1% MC media. D) Cell area, normalized with respect to the area immediately before switching to viscous media, as a function of time after the addition of 1% MC media (N = 79 cells). E) Representative DIC images of a single cell before (at t = −1 min) and after (at t = 10 and 30 min) media viscosity change (N = 79 cells). *p < 0.05, **p < 0.005, and ***p < 0.0005 across all plots. Error bars represent standard deviation of the data.
Figure 2
Figure 2
Total Filamentous‐actin (F‐Actin), Phospho‐Myosin Light Chain (pMLC), and Focal adhesion density do not change while actin retrograde flow speed reduces in high viscosity media. A) Representative fluorescence images of F‐Actin obtained from phalloidin staining, cell in DMEM (left), and cell in 1% MC (right). B,C) Comparisons of mean (intensity per unit area) and total F‐Actin for cells in DMEM (N = 300) and 1% MC (N = 250). Mean F‐Actin intensity reduces in high viscosity medium. D) Representative fluorescent images of live cells transfected with F‐Tractin in DMEM (left) and in 1% MC (right). Live cell movies are used to obtain actin retrograde flow analysis (see Experimental Section). E) Comparisons of actin retrograde flow speeds in DMEM (N = 44) and 1% MC (N = 19). F) Representative immunofluorescence images of vinculin, which are used to quantify cell focal adhesions in DMEM (left) and in 1% MC (right). G) Focal adhesion density (# per area) in cells in DMEM (N = 74) and 1% MC (N = 75). H) Representative immunofluorescence images of pMLC in cells in DMEM (left) and in 1% MC (right). I) Total intensity of pMLC in cells in DMEM (N = 142) and 1% MC (N = 124). *p < 0.05, **p < 0.005, and ***p < 0.0005 across all plots. Error bars represent standard deviation of the data.
Figure 3
Figure 3
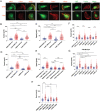
Inhibiting ion‐channel activity significantly reduces cell migration speed in high viscosity media. A) Representative immunofluorescence images of NKCC1, NHE1, NaK and F‐Actin of cells in DMEM and 1% MC. B) Cell speed upon inhibition of NKCC1 via 30 µm Bumetanide (DMEM+DMSO Ctrl N = 182; 1% MC DMSO Ctrl N = 411; DMEM 30 µm Bum N = 171; 1% MC 30 µm Bum N = 263). C) Cell speed upon inhibition of NHE1 via 20 µm EIPA (DMEM+DMSO Ctrl N = 182; 1% MC DMSO Ctrl N = 411; DMEM 20 µM EIPA N = 293; 1% MC 20 µm EipA N = 346). D) Cell speed upon dual‐ inhibition of NKCC1 and NHE1 via 30 µm Bumetanide and 20 µm EIPA (DMEM+DMSO Ctrl N = 182; 1% MC DMSO Ctrl N = 411; DMEM Dual N = 264; 1% MC Dual N = 461). E) Cell speed upon inhibition of NaK via 25 µm and 50 µm Ouabain (DMEM+DMSO Ctrl N = 182; 1% MC DMSO Ctrl N = 411; DMEM 25 µm Ouabain N = 202; 1% MC 25 µm Ouabain N = 288; DMEM 50 µm Ouabain N = 248; 1% MC 50 µm Ouabain N = 331). F) Cell speed upon NKCC1 knockdown from shRNA (DMEM Scr Ctrl N = 74; 1% MC Scr Ctrl N = 224; DMEM S1 N = 74; 1% MC S1 N = 301; DMEM S2 N = 71; 1% MC S2 N = 217; DMEM S3 N = 77; 1% MC S3 N = 133). G) Cell speed for NKCC1 knockdown cells with 20 µm EIPA (DMEM Scr Ctrl N = 14; 1% MC Scr Ctrl N = 17; DMEM S1 N = 13; 1% MC S1 N = 166; DMEM S2 N = 117; 1% MC S2 N = 188; DMEM S3 N = 84; 1% MC S3 N = 160). H) Cell Speed for NKCC1 and NHE1 double knockdown (dKD) (DMEM Scr Ctrl N = 107; 1% MC Scr Ctrl N = 126; DMEM dKD1 N = 125; 1% MC dKD1 N = 126; DMEM dKD2 N = 116; 1% MC dKD2 N = 123). *p < 0.05, **p < 0.005 and ***p < 0.0005 across all plots. Error bars represent standard deviation of the data.
Figure 4
Figure 4
Inhibiting ion‐channel localization at the cell leading edge via perturbation of vesicle trafficking reduces cell migration speed in high viscosity media. A) Cell speed upon Rab7 inhibition via CID 1067700 (DMEM DMSO Ctrl N = 216; 1% MC DMSO Ctrl N = 205; DMEM 250 µm CID 1067700 N=240; 1% MC 250 µm CID 1067700 N = 333). B) Cell speed upon Myosin V inhibition via MyoVinI (DMEM DMSO Ctrl N = 182; 1% MC DMSO Ctrl N = 411; DMEM 20 µm MyoVinI N = 160; 1% MC 20 µm MyoVinI N=265; DMEM 50 µm MyoVinI N = 145; 1% MC 50 µm MyoVinI N= 205). C) Cell speed upon Latrunculin A treatment (DMEM DMSO Ctrl N = 216; 1% MC DMSO Ctrl N = 205; DMEM 2.5 nm LatA N = 174; 1% MC 2.5 nm LatA N=166; DMEM 5nm LatA N = 240; 1% MC 5 nm LatA N=246; DMEM 10nm LatA N=218; 1% MC 10 nm LatA N = 212). D,E,F) Representative immunofluorescence images of ion‐channels and F‐actin in cells after various treatments. G) Pictorial representation of immunofluorescence analysis for ion channels at the cell edge. A line at the leading edge is drawn and intensity within the line is recorded. For analysis, the ratio I(signal)/I(noise) is taken as leading edge intensity. H) NKCC1 leading edge intensity (1% MC DMSO Ctrl N=79; 1% MC 2.5 nm LatA N = 100; 1% MC 50 µm MyoVinI N=83; 1% MC 2.5 µL DMSO Ctrl N = 86; 1% MC 250 µm CID 1067700 N=66). I) NHE1 leading edge intensity (1% MC DMSO Ctrl N=58; 1% MC 2.5 nm LatA N = 111; 1% MC 50 µm MyoVinI N=91; 1% MC 2.5 µL DMSO Ctrl N = 77; 1% MC 250 µm CID 1067700 N=84). J) NaK leading edge intensity (1% MC DMSO Ctrl N = 183; 1% MC 2.5 nm LatA N = 136; 1% MC 50 µm MyoVinI N = 104; 1% MC 2.5 µL DMSO Ctrl N = 85; 1% MC 250 µm CID 1067700 N = 114). *p < 0.05, **p < 0.005, and ***p < 0.0005 across all plots. Error bars represent standard deviation of the data.
Figure 5
Figure 5
Calcium (Ca2+) dynamics affect cell migration speed by regulating ion‐channel and F‐actin localization at the cell leading edge. Intracellular Ca2+ levels (measured as fluorescence signal from GCamp6m transfected live cells) in different media conditions. Representative GCamp6m fluorescent images in A) DMEM (immediately after addition), B) 1% MC (immediately after addition), and C) 1% MC (long term >3 h incubation). D) Cell speed under various levels of Ca2+ chelation via BAPTA‐AM (DMEM DMSO Ctrl N=182; 1% MC DMSO Ctrl N = 411; DMEM 5 µm BAPTA‐AM N=135; 1% MC 5 µm BAPTA‐AM N=144; DMEM 10 µm BAPTA‐AM N = 117; 1% MC 10 µm BAPTA‐AM N = 137; DMEM 20 µm BAPTA‐AM N=86; 1% MC 20 µm BAPTA‐AM N = 127). E) Cell speed upon non‐specific inhibition of mechano‐sensitive channels via GdCl3 (DMEM Water Ctrl N = 45; 1% MC Water Ctrl N = 102; DMEM 100 µm GdCl3 N=96; 1% MC 100 µm GdCl3 N = 157). F) Cell speed upon inhibition of TRPM7 via FTY (DMEM DMSO Ctrl N=77; 1% MC DMSO Ctrl N = 154; DMEM 2 µm FTY N = 83; 1% MC 2 µm FTY N = 120). G) Cell speed upon treatment with extracellular Ca2+ chelator BAPTA (DMEM DMSO Ctrl N = 162; 1% MC DMSO Ctrl N=152; DMEM 50 µm BAPTA N = 146; 1% MC 50 µm BAPTA N = 144). H) Cell speed upon treatment with 2‐APB and CAI (DMEM DMSO Ctrl N = 145; 1% MC DMSO Ctrl N = 149; DMEM 200 µm 2‐APB + 40 µm CAI N=169; 1% MC 200 µm 2‐APB + 40 µm CAI N = 178). Leading edge intensities of ion‐channels and F‐actin are reduced under BAPTA‐AM treatment as compared to DMSO Control: I) Leading edge intensities of NKCC1 (1% MC DMSO Ctrl N = 132; 1% MC 10 µm BAPTA‐AM N = 115), J) Leading edge intensities of NHE1 (1% MC DMSO Ctrl N = 132; 1% MC 10 µm BAPTA‐AM N = 171), K) Leading edge intensities of NaK (1% MC DMSO Ctrl N = 133; 1% MC 10 µm BAPTA‐AM N = 144), and L) Leading edge intensities of F‐actin (1% MC DMSO Ctrl N = 397; 1% MC 10 µm BAPTA‐AM N = 430). *p < 0.05, **p < 0.005 and ***p < 0.0005 across all plots. Error bars represent standard deviation of the data.
Figure 6
Figure 6
Mathematical modeling can explain cell speedup in high viscosity media. A) Model prediction of water‐driven cell migration velocity as a function of the coefficient of external hydraulic resistance (left panel) and the ratio of active ion flux at the leading and trailing edges of the cell (right panel). B) Model predictions of the water‐driven cell velocity as a function of active ion flux and the coefficient of external hydraulic resistance. Left panel: active ion flux at the back of the cell is fixed but the ratio of front‐to‐back ion flux is varied. The model predicts that the cell velocity increases with the flux ratio and the external hydraulic resistance. Right panel: the front‐to‐back active ion flux ratio is fixed while varying the ion flux at the back. This is to model the case when some ion transporters and pumps are inhibited in the experiment. The inhibition will reduce the ion flux across the cell boundary while the ratio may remain the same. The model predicts that the cell velocity reduction is more prominent at high hydraulic resistance when the overall ion flux is reduced, that is, velocity decrease by 2 µm h−1 when d g = 1 Pa s µm−1 versus velocity decrease by 49 µm h−1 when d g = 102 Pa s µm−1. C) Schematic representation of cell motility mechanism in high viscosity conditions. Water flux‐driven mode of cell migration is facilitated by ion‐channel localization at the cell leading edge. Actin tracks, Myosin V, and Rab7 facilitate trafficking of ion‐channels to the cell leading edge. Ca2+ influences ion‐channel localization at the cell leading edge by modulating actin polymerization and vesicle trafficking. The direction of water influx at the cell leading edge is opposite to the direction of cell migration. Increased media viscosity and hydraulic resistance alter cell ion channel polarization and increase cell speed.

Similar articles

Cited by

References

    1. Trepat X., Chen Z., Jacobson K., in Comprehensive Physiology, Vol. 176, John Wiley & Sons, Inc., 2012, pp. 139–148.
    1. Vicente‐Manzanares M., Webb D. J., Horwitz A. R., J. Cell Sci. 2005, 118, 4917. - PubMed
    1. de Lucas B., Pérez L. M., Gálvez B. G., J. Cell. Mol. Med. 2017, 22, 746. - PMC - PubMed
    1. Zhao R., Afthinos A., Zhu T., Mistriotis P., Li Y., Serra S. A., Zhang Y., Yankaskas C. L., He S., Valverde M. A., Sun S. X., Konstantopoulos K., Sci. Adv. 2019, 5, eaaw7243. - PMC - PubMed
    1. Maity D., Li Y., Chen Y., Sun S. X., Soft Matter 2019, 15, 2617. - PMC - PubMed

Publication types

LinkOut - more resources