. 2022 Oct;9(30):e2202706.
doi: 10.1002/advs.202202706. Epub 2022 Aug 28.

Tonsillar Microbiome-Derived Lantibiotics Induce Structural Changes of IL-6 and IL-21 Receptors and Modulate Host Immunity

Affiliations

Tonsillar Microbiome-Derived Lantibiotics Induce Structural Changes of IL-6 and IL-21 Receptors and Modulate Host Immunity

Jing Li et al. Adv Sci (Weinh). 2022 Oct.

Abstract

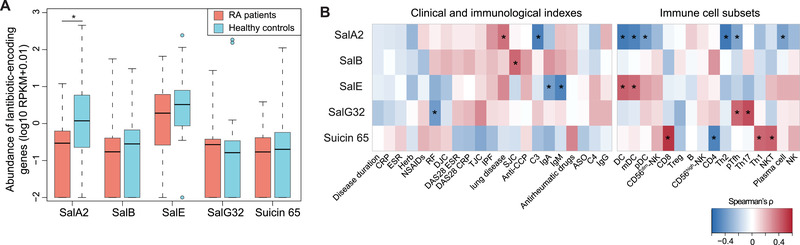
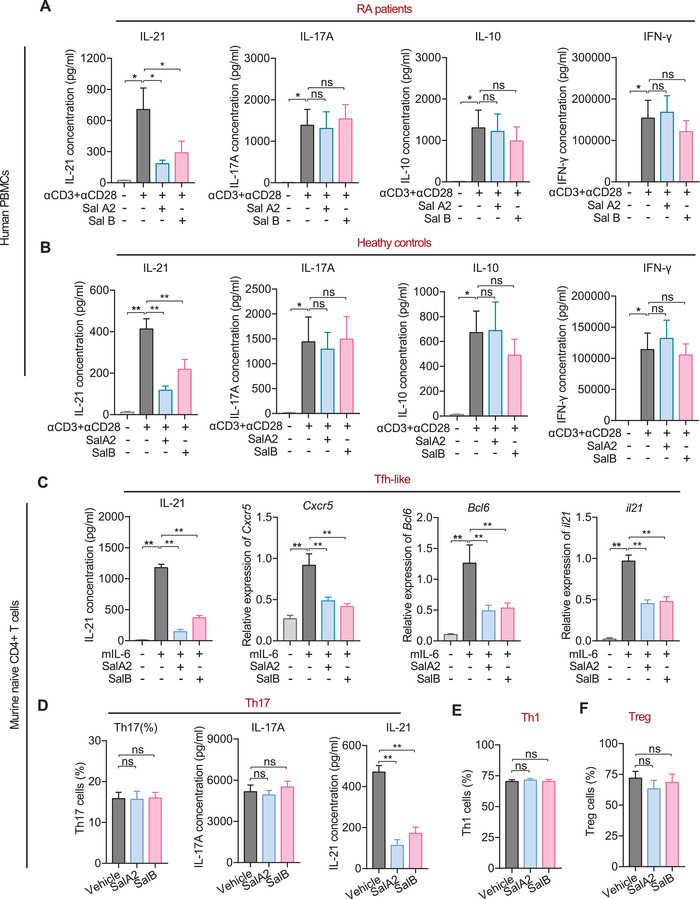
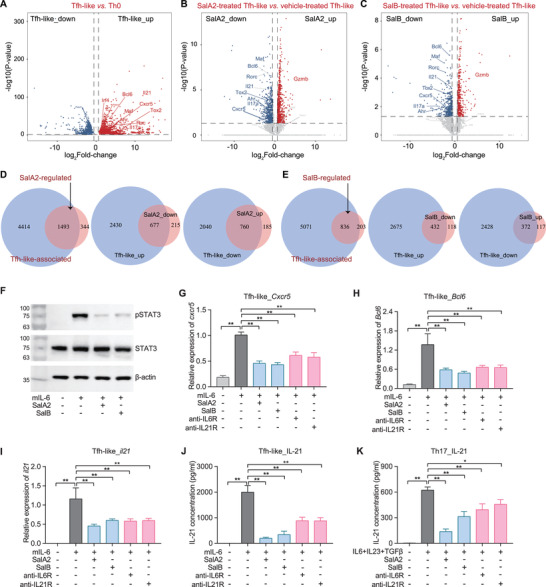
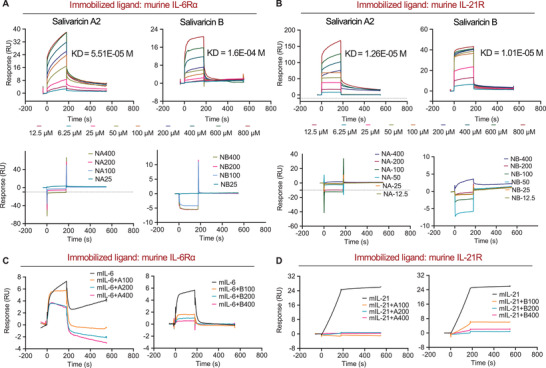
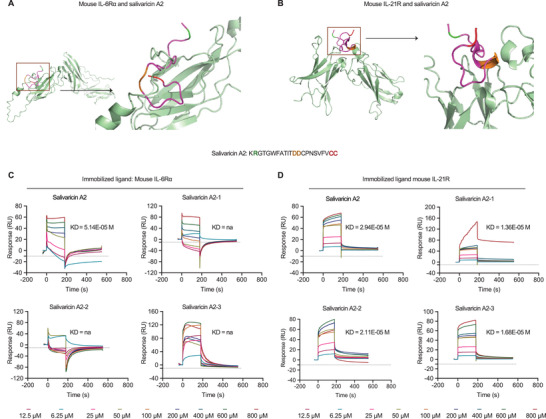
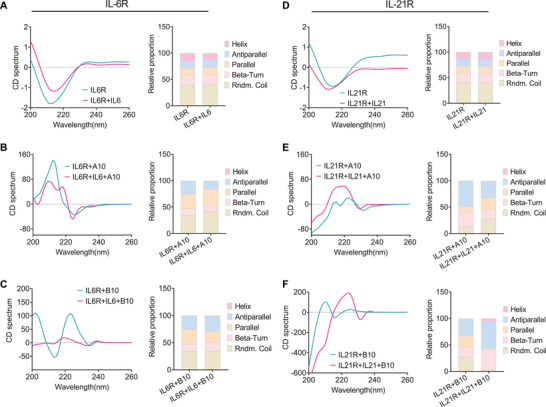
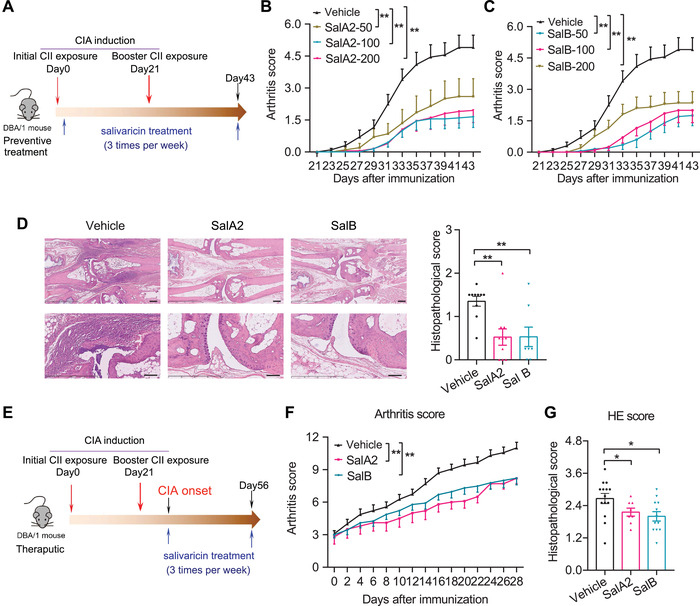
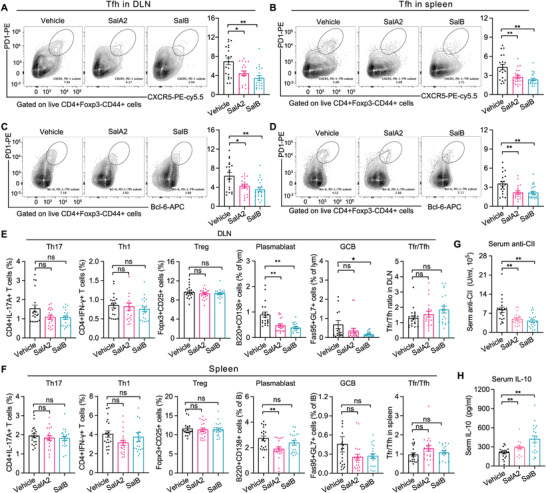
Emerging evidence emphasizes the functional impacts of host microbiome on the etiopathogenesis of autoimmune diseases, including rheumatoid arthritis (RA). However, there are limited mechanistic insights into the contribution of microbial biomolecules especially microbial peptides toward modulating immune homeostasis. Here, by mining the metagenomics data of tonsillar microbiome, a deficiency of the encoding genes of lantibiotic peptides salivaricins in RA patients is identified, which shows strong correlation with circulating immune cells. Evidence is provided that the salivaricins exert immunomodulatory effects in inhibiting T follicular helper (Tfh) cell differentiation and interleukin-21 (IL-21) production. Mechanically, salivaricins directly bind to and induce conformational changes of IL-6 and IL-21 receptors, thereby inhibiting the bindings of IL-6 and IL-21 to their receptors and suppressing the downstream signaling pathway. Finally, salivaricin administration exerts both prophylactic and therapeutic effects against experimental arthritis in a murine model of RA. Together, these results provide a mechanism link of microbial peptides-mediated immunomodulation.

Keywords: IL-6 and IL-21 receptor; lantibiotics; rheumatoid arthritis; salivaricins; tonsillar microbiome.


Conflict of interest statement

The authors declare no conflict of interest.

Figures

Figure 1
Figure 1
Tonsillar microbiome‐derived lantibiotic peptides salivaricins are deficient in RA patients and correlated to circulating immune cells. A) Boxplot showing the relative abundances of five lantibiotic genes (salivaricin A2, B, E, G32, and suicin 65) in the tonsillar microbiomes of rheumatoid arthritis (RA) patients and healthy controls. Boxes represented the interquartile range between the first and third quartiles and median (internal line). Whiskers denoted the lowest and highest values within 1.5 times the range of the first and third quartiles, respectively; and dots represented outlier samples beyond the whiskers. RPKM, reads per kilobase per million mapped reads. n = 32 for RA patients and n = 30 for healthy controls, Wilcoxon rank sum test, *P < 0.05. B) Heatmaps displaying the associations of lantibiotic‐encoding gene abundances from the tonsillar microbiome with RA‐related clinical and immunological indexes (left panel) and with circulating immune cell subsets (right panel). Spearman's rank correlation test, *P < 0.05.
Figure 2
Figure 2
Salivaricins inhibit IL‐21 production and Tfh cell differentiation in vitro. A,B) PBMCs are isolated from RA patients (A, n = 9‐11) and healthy individuals (B, n = 7). Subsequently, these cells are cultured with activation by αCD3 and αCD28 antibodies and are exposed to salivaricin A2 or B for 3 days. The interleukin‐21 (IL‐21), IL‐17A, IL‐10, and IFN‐γ levels are measured by enzyme‐linked immunosorbent assay (ELISA). SalA2: salivaricin A2 (200 µg mL−1); SalB: salivaricin B (200 µg mL−1). C–F) Naïve CD4+ T cells from wildtype C57BL/6 mice are sorted by FACS and cultured in the presence of plate‐bound αCD3 and αCD28 antibodies, with or without salivaricin under Tfh‐like (C, αIFN‐γ+αIL‐4+αIL‐2+IL‐6), Th17 (D, αIFN‐γ+αIL‐4+IL‐6+TGF‐β+IL‐23), Th1 (E, αIL‐4+IL‐12), or iTreg (F, IL‐2+TGF‐β) cell differentiation conditions for 5 days. Cxcr5, Bcl6, and il21 expression levels are measured by qPCR (c); the IL‐21 and IL‐17A levels are measured by ELISA kits (C,D); the proportions of Th17, Th1, and iTreg cells are assessed using flow cytometry (D–F). SalA2 = 50 µg mL−1; SalB = 50 µg mL−1. n = 12 for C; n = 10 for D; n = 11 for E; n = 8 for F. Data are expressed as the mean ± sem. Significance is assessed using one‐way ANOVA followed by Holm‐Sidak's multiple comparisons tests. *P < 0.05, **P < 0.01, ns, not‐significant.
Figure 3
Figure 3
Salivaricins inhibit IL‐6R/IL‐21R‐STAT3 signaling pathway. A–C) Volcano plots of genes upregulated (red) or downregulated (blue) for 1.5‐fold or more in Tfh‐like relative to Th0 cells (A) or salivaricin‐treated relative to vehicle‐treated Tfh‐like cells (B,C) assessed by RNA sequencing (RNA‐seq) analyses. n = 5‐6; SalA2 = 50 µg mL−1; SalB = 50 µg mL−1. D,E) Venn diagrams showing the overlaps of gene profiles regulated between the salivaricin‐treated and vehicle‐treated Tfh‐like cells. sal‐regulated: differentially expressed genes between salivaricin‐treated and vehicle‐treated Tfh‐like cells; Tfh‐like‐associated: differentially expressed genes between Tfh‐like and Th0 cells. F) Assessment of phosphorylation level of signal transducer and activator of transcription 3 (STAT3) by western blot in Tfh‐like cells with or without salivaricin‐treatment. n = 3. G–J) Assessment of the expressions of Cxcr5, Bcl6, and il21 (qPCR, (G–I)) and the IL‐21 level (ELISA, (J)) in Tfh‐like cells. SalA2 = 50 µg mL−1; SalB = 50 µg mL−1; anti‐IL6R = 50 µg mL−1; anti‐IL21R = 50 µg mL−1. n = 10. K) IL‐21 level (ELISA) in Th17 cells. n = 7–9. Data are expressed as the mean ± sem. Significance is assessed using one‐way ANOVA followed by Holm‐Sidak's multiple comparisons tests (B–F). *P < 0.05, **P < 0.01.
Figure 4
Figure 4
Salivaricins directly bind to IL‐6 and IL‐21 receptors. A) Surface plasmon resonance (SPR) sensorgram for the analyte salivaricin A2 or B binding to the immobilized murine IL‐6R, identifying dissociation constant (KD) values of 51.5 and 160 µM for salivaricin A2 and B with murine IL‐6R, respectively. IL‐6Rα: IL‐6 receptor subunits alpha (20 nM); A: salivaricin A2 (6.25–800 µM); B: salivaricin B (6.25–800 µM); NA: negative control peptide for salivaricin A2 (25–400 µM); NB: negative control peptide for salivaricin B (25–400 µM). B) SPR sensorgram for the analyte salivaricin A2 or B binding to the immobilized murine IL‐21R, identifying KD values of 12.6 and 10.1 µM for salivaricin A2 and B with murine IL‐21R, respectively. IL‐21R: IL‐21 receptor (20 nM); A: salivaricin A2 (6.25–800 µM); B: salivaricin B (6.25–800 µM); NA: negative control peptide A (12.5–400 µM); NB: negative control peptide B (12.5–400 µM). C) Competitive inhibition assays of salivaricin A2 or B with murine IL‐6. IL‐6Rα: 20 nM; mIL‐6: murine IL‐6 (50 nM); A: salivaricin A2 (100–400 µM); B: salivaricin B (100–400 µM). D) Competitive inhibition assays of salivaricin A2 or B with murine IL‐21. IL‐21R: 20 nM; mIL‐21: murine IL‐21 (1 nM). A: salivaricin A2 (100–400 µM); B: salivaricin B (100–400 µM).
Figure 5
Figure 5
Identification of binding sites of salivaricin A2 to receptors. A,B) Computational approach is used to predict the potential amino acid sites of salivaricin A2 binding to mouse IL‐6Rα and IL‐21R, identifying five residues according to the results generated by PISA (Proteins, Interfaces, Structures and Assemblies). C) SPR sensorgram for the bindings of salivaricin A2 mutants (12.5–800 µM) to the immobilized murine IL‐6R (20 nM). The KD values of salivaricin A2 is 55.1 µM, while salivaricin A2‐1 (mutation at the 2nd arginine residue), salivaricin A2‐2 (mutations at the 12th and 13th asparagine residues), and A2‐3 (mutations at 21st and 22nd cysteine residues) showed not‐available KD values to murine IL‐6Rα. D) SPR sensorgram for the bindings of salivaricin A2 mutants (12.5–800 µM) to the immobilized murine IL‐21R (20 nM), identifying KD values of 29.4 µM for salivaricin A2, 13.4 µM for salivaricin A2‐1, 21.1 µM for salivaricin A2‐2 and 16.8 µM for salivaricin A2‐3 to murine IL‐21R.
Figure 6
Figure 6
Salivaricins induce conformational changes in IL‐6 and IL‐21 receptors. A–C) The circular dichrois (CD)) spectrum and the statistical proportions of different secondary structures (e.g., alpha‐helix, beta‐barrels, and random coils) of IL‐6Rα in the presence or absence of IL‐6 (A) and salivaricins with or without IL‐6 (B,C). D–F) The CD spectrum and the statistical proportions of different secondary structures of IL‐21R in the presence or absence of IL‐21 (D) and salivaricins with or without IL‐21 (E,F). mIL‐6R: 0.1 mg mL−1; SalA2: 10 mg mL−1; SalB: 10 mg mL−1 mIL‐6R: 0.1 mg mL−1. mIL‐21R: 0.1 mg mL−1; SalA2: 10 mg mL−1; SalB: 10 mg mL−1; mIL‐21: 0.1 mg mL−1.
Figure 7
Figure 7
Salivaricins confer protection against experimental arthritis in mice. A) Experimental design schematic for testing salivaricins as a prophylactic regimen with the collagen‐induced arthritis (CIA) mouse model. B,C) Clinical arthritis scores in CIA mice with or without intral‐orally administration of salivaricin A2 (B) or B (C). SalA2: salivaricin A2 (50, 100, or 200 µg per mice); SalB: salivaricin B (50, 100, or 200 µg per mice); n = 20 for each group. D) Histopathological scoring of the paws showing significantly decreased inflammation in salivaricins‐treated mice. Vehicle, n = 10; SalA2 (100 µg per mice), n = 10; SalB (100 µg per mice), n = 8. Bar = 250 mm and 100 um for the upper and lower panel, respectively. E) Experimental design schematic for testing salivaricins as a therapeutic regimen with the CIA mouse model. F) Clinical scores of arthritis in the indicated groups. Vehicle, n = 23; SalA2 (100 µg per mice), n = 10; SalB (100 µg per mice), n = 23. G) Histopathological scoring of the paws. Vehicle = 14, SalA2 = 8, SalB = 12. Data are pooled from two independent experiments and expressed as mean ± sem. Significance determined using two‐way ANOVA followed by Tukey's multiple comparisons test (B,C,F) or Mann–Whitney U test (D,G), *P < 0.05, **P < 0.01.
Figure 8
Figure 8
Salivaricins inhibit immune responses in CIA mice. A–D) Representative flow cytometry plots with graphs showing frequencies of Tfh cells (CD4+CD44+CXCR5+PD1hiBcl6+) in the draining lymph nodes (DLNs) and spleens of the indicated groups. n = 20 per group. E,F) Graphs showing frequencies of Th17 cells (CD4+IL‐17A+IFN‐γ ), Th1 cells (CD4+IFN‐γ +IL‐17A), Treg cells (CD4+CD25+Foxp3+), plasmablast (B220+CD4CD138+), and GC B cell (B220+CD4Fas95+GL‐7+) and ratio of Tfr to Tfh cells in the DLNs and spleens of the indicated groups. n = 20 per group. G,H) Serum concentrations of anti‐IgG collagen type II (CII) antibody and IL‐10. n = 20 per group, SalA2 = 100 µg per mice and SalB = 100 µg per mice treated by intraorally. Data is pooled from two independent experiments and expressed as mean ± sem. Significance determined using Mann–Whitney test, *P < 0.05, **P < 0.01. ns: not‐significant.

Similar articles

Cited by

References

    1. a) Ruff W. E., Greiling T. M., Kriegel M. A., Nat. Rev. Microbiol. 2020, 18, 521; - PubMed
    2. b) Schluter J., Peled J. U., Taylor B. P., Markey K. A., Smith M., Taur Y., Niehus R., Staffas A., Dai A., Fontana E., Amoretti L. A., Wright R. J., Morjaria S., Fenelus M., Pessin M. S., Chao N. J., Lew M., Bohannon L., Bush A., Sung A. D., Hohl T. M., Perales M. A., van den Brink M. R. M., Xavier J. B., Nature 2020, 588, 303. - PMC - PubMed
    1. Skelly A. N., Sato Y., Kearney S., Honda K., Nat. Rev. Immunol. 2019, 19, 305. - PubMed
    1. Zaiss M. M., Joyce Wu H. J., Mauro D., Schett G., Ciccia F., Nat. Rev. Rheumatol. 2021, 17, 224. - PubMed
    1. Smolen J. S., Aletaha D., Barton A., Burmester G. R., Emery P., Firestein G. S., Kavanaugh A., McInnes I. B., Solomon D. H., Strand V., Yamamoto K., Nat. Rev. Dis. Primers 2018, 4, 18001. - PubMed
    1. a) Abdollahi‐Roodsaz S., Joosten L. A., Koenders M. I., Devesa I., Roelofs M. F., Radstake T. R., Heuvelmans‐Jacobs M., Akira S., Nicklin M. J., Ribeiro‐Dias F., van den W. B., Berg, J. Clin. Invest. 2008, 118, 205; - PMC - PubMed
    2. b) Teng F., Klinger C. N., Felix K. M., Bradley C. P., Wu E., Tran N. L., Umesaki Y., Wu H. J., Immunity 2016, 44, 875; - PMC - PubMed
    3. c) Maeda Y., Kurakawa T., Umemoto E., Motooka D., Ito Y., Gotoh K., Hirota K., Matsushita M., Furuta Y., Narazaki M., Sakaguchi N., Kayama H., Nakamura S., Iida T., Saeki Y., Kumanogoh A., Sakaguchi S., Takeda K., Arthritis Rheumatol. 2016, 68, 2646. - PubMed

Publication types

LinkOut - more resources