. 2022 Nov;9(32):e2203115.
doi: 10.1002/advs.202203115. Epub 2022 Aug 28.

Differential Oral Microbial Input Determines Two Microbiota Pneumo-Types Associated with Health Status

Affiliations

Differential Oral Microbial Input Determines Two Microbiota Pneumo-Types Associated with Health Status

Jingxiang Zhang et al. Adv Sci (Weinh). 2022 Nov.

Abstract

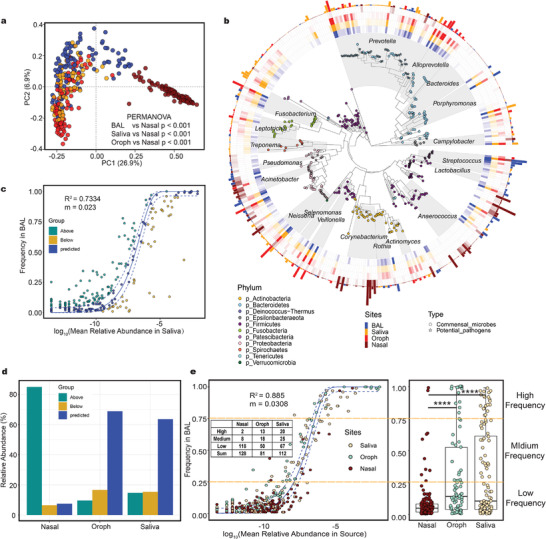
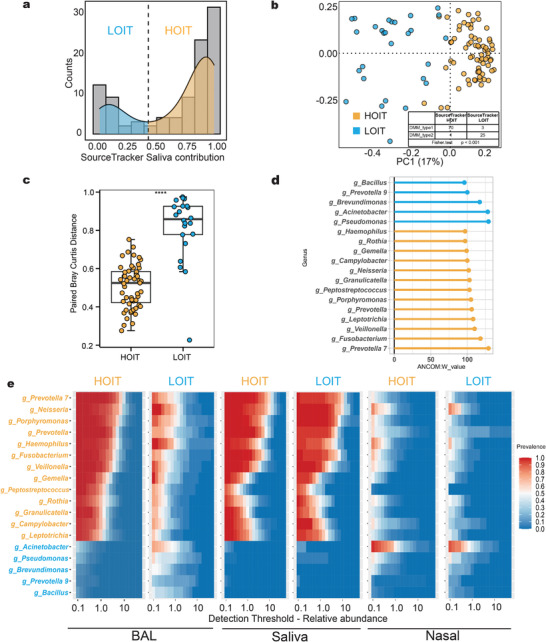
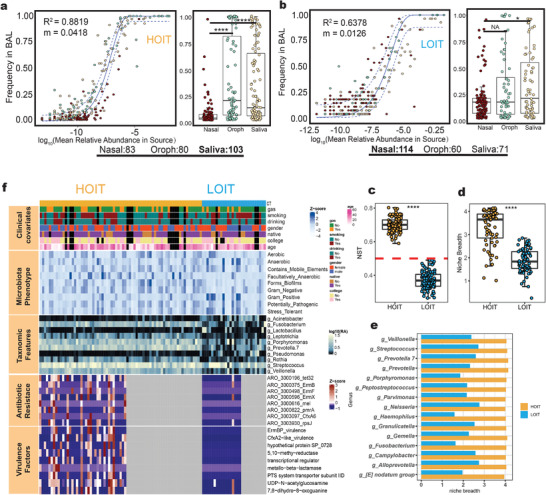
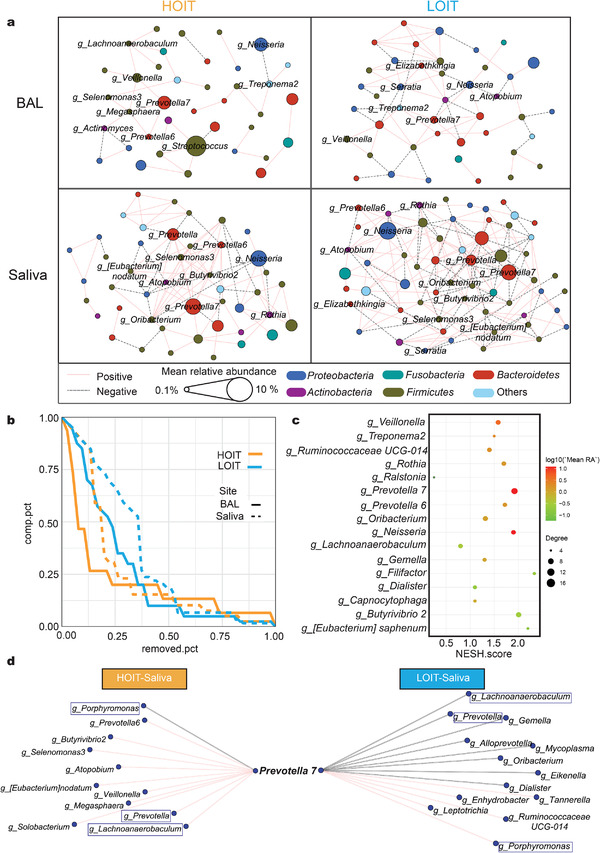
The oral and upper respiratory tracts are closely linked anatomically and physiologically with the lower respiratory tract and lungs, and the influence of oral and upper respiratory microbes on the lung microbiota is increasingly being recognized. However, the ecological process and individual heterogeneity of the oral and upper respiratory tract microbes shaping the lung microbiota remain unclear owing to the lack of controlled analyses with sufficient sample sizes. Here, the microbiomes of saliva, nasal cavity, oropharyngeal area, and bronchoalveolar lavage samples are profiled and the shaping process of multisource microbes on the lung microbiota is measured. It is found that oral and nasal microbial inputs jointly shape the lung microbiota by occupying different ecological niches. It is also observed that the spread of oral microbes to the lungs is heterogeneous, with more oral microbes entering the lungs being associated with decreased lung function and increased lung proinflammatory cytokines. These results depict the external shaping process of lung microbiota and indicate the great value of oral samples, such as saliva, in monitoring and assessing lung microbiota status in clinical settings.

Keywords: cytokines; lung function; lung microbiota; neutral model; oral microbiota; respiratory microbiome.


Conflict of interest statement

The authors declare no conflict of interest.

Figures

Figure 1
Figure 1
The taxonomic composition of various type samples and the results of neutral model fitting. a) PCoA based on Bray‐Curtis distance demonstrated that the community structures of the saliva (n = 81), oropharynx (n = 87) and BAL (n = 99) were similar, but the community composition of the nasal (n = 86) samples was specific. b) The phylogenetic tree of ASVs of which the shape of the tip points indicate the types of microbes (commensal microbes or potential pathogens). The transparency of the heatmap indicates the abundance of microbes, and the colors of the heatmap indicate different sites of the human body. The bar plot indicates the relative abundance of the most prevalent species at the body sites. c) Results of neutral model fitting with saliva as source. The solid blue line represents the fitting curve and the dashed blue line represents the 95% confidence interval. The coefficient of determination (R 2) was the goodness of fit of the neutral model. It ranged from ≤0 (no fit) to 1 (perfect fit). d) The relative abundance of bacteria in the neutral models. e) Results of multiple sources neutral model fitting. The colors of the dots represents the body sites that provided the bacteria. Bacteria were grouped according to their frequency in lungs (upper and lower quartiles). The numbers in the table represents the numbers of taxa contributed by each body site in each group. PCoA: principal coordinate analysis; PERMANOVA: permutational multivariate analysis of variation. Box plot: centerline, median; box limits, upper and lower quartiles; error bars, 95% CI. Differences between groups were assessed using Wilcoxon test, * p < 0.05, ** p < 0.01, *** p < 0.001, **** p < 0.0001.
Figure 2
Figure 2
The definition and microbiome characteristics of the pneumo‐types. a) SourceTracker was used to calculate the contribution value of saliva to BAL and show the kernel density map and frequency distribution histogram of the contribution value. The nuclear density map showed a bimodal distribution. b) PCoA based on Bray‐Curtis demonstrated that BAL samples of HOIT (n = 71) clustered separately from LOIT (n = 28) BAL samples. The contents of the table showed the distribution of results for the two methods. The four samples with inconsistent classification results are indicated by red circles in the figure. c) The paired Bray‐Curtis distances between the BAL and saliva samples between the pneumo‐types. d) ANCOM and LEfSe demonstrated distinct genera between the pneumo‐types. The larger the W value in ANCOM results, the more significant the difference between the pneumo‐types. e) Core microbiota heatmaps showing abundance of taxa and prevalence across difference samples from the LOIT and HOIT. Taxa listed were selected on the basis on the LEfSe and ANCOM results. ANCOM: analysis of composition of microbiomes; LEfSe: Linear discriminant analysis Effect Size. Box plot: centerline, median; box limits, upper and lower quartiles; error bars, 95% CI. Differences between pneumo‐types were assessed using Wilcoxon test, * p < 0.05, ** p < 0.01, *** p < 0.001, **** p < 0.0001.
Figure 3
Figure 3
Lung community assembly and microbial functional characteristics. a,b) Results of multiple sources neutral model fitting of HOIT (n = 71) or LOIT (n = 28). c) NTS were randomized 100 times to compare the proportion of random processes in the lung community assembly process. d) The top 15 taxa with the highest niche breadth in the HOIT showed significant differences in niche breadth between the pneumo‐types. f) Top‐to‐bottom modules of the heatmap represent clinical phenotype annotations, microbiota phenotypes, genus characteristics, resistant genes, and virulence genes, respectively. Box plot: centerline, median; box limits, upper and lower quartiles; error bars, 95% CI; NST: normalized stochasticity ratio. Differences between pneumo‐types were assessed using Wilcoxon test, * p < 0.05, ** p < 0.01, *** p < 0.001, **** p < 0.0001.
Figure 4
Figure 4
The interaction network of the BAL and saliva microbiome. a) A co‐occurrence network for genus‐level summarized taxa was built with SparCC as described in the Experimental Section. The four regions represent co‐occurrence networks of BAL (HOIT = 71, LOIT = 28) and saliva (HOIT = 59, LOIT = 22) samples in different pneumo‐types, respectively. The node colors represent the phyla to which the nodes belong. The node sizes represent the average relative abundance of the species. The colors of the lines represent interaction patterns. b) Robustness curves for the four networks. Attack robustness of a network was measured by sequentially removing nodes based on the nodes’ degrees selected and measuring the percentage of nodes that remained in the central connected component. Measurement of robustness was performed for each of our four networks and the results were plotted here with the percentage of nodes removed on the X‐axis and the percentage of remaining nodes in the central connected component on the Y‐axis. Each network is represented by a line on this graph. A larger area under the curve indicates a more robust network. The colors of the curves represent groups; the solid line BAL and the dashed line saliva. c) The nodes with significant differences in the network were screened by Netshift. The X‐axis represents NESH scores. The node sizes represent the degree numbers. The node colors represent the mean relative abundance. d) Co‐occurrence analysis highlighting the Prevotella 7‐interaction network in saliva. The taxa circled by the rectangles were common between the pneumo‐types. NESH: neighbor shift scores. Networks were produced by retaining edges (correlation coefficient R ranges between −0.4 and 0.4 and p < 0.05).
Figure 5
Figure 5
The characteristics of cross‐site interaction network between oral and lung microbiota. a,b) Network between oral and lung microbiota. The shapes of the nodes represent the body sites: triangle (saliva = 81) circle (BAL = 99). The colors of the nodes represent the phyla to which the nodes belong. The colors of the edges represent positive correlation (red) and negative correlation (gray). c) Key nodes in oral and lung communication network, and the values of the abscissa represent the sums of the numbers of edges of the nodes in the network. d) ROC curves of different classification levels. ROC: receiver operating characteristic.
Figure 6
Figure 6
The cytokine levels of BALF and clinical data of patients. a) DLCO.SB and DLCO.VA were significantly different between the pneumo‐types (HOIT = 36, LOIT = 16). b) The X‐axis represents the length of hospitalization, and the Y‐axis represents the proportion of discharged patients at this time point. c) The boxplot of cytokines with significant differences between the pneumo‐types (HOIT = 61, LOIT = 25). d) The squares indicate the coefficients corresponding, and the horizontal lines indicate the 95% confidence intervals. Box plot: centerline, median; box limits, upper and lower quartiles; error bars, 95% CI. Differences between pneumo‐types were assessed using Wilcoxon test, * p < 0.05, ** p < 0.01, *** p < 0.001, **** p < 0.0001.
Figure 7
Figure 7
The correlation between the microbiota and cytokines or clinical data. a) We used LEfSe and ANCOM to pick out the genus with the most significant differences (LDA > 3.5) and calculated their Spearman correlation with cytokines and lung function. The colors of the lines indicate positive and negative correlations; node shapes represent variable attributes; the colors of the circles represent the pneumo‐types in which the genus was enriched; the sizes of the circles represent the mean relative abundance of the genera. b) Correlation scatter plots of ST values with partial lung function and cytokines. The lines represent the linear fitting curves and the shadows represent the confidence intervals of the fitting curves. c) Correlation scatter plots of Prevotella 7 with hospitalization days, partial lung function and cytokines. The p and R values were calculated by Spearman correlation analysis. ST: SourceTracker value.

Similar articles

Cited by

References

    1. Pattaroni C., Watzenboeck M. L., Schneidegger S., Kieser S., Wong N. C., Bernasconi E., Pernot J., Mercier L., Knapp S., Nicod L. P., Marsland C. P., Roth‐Kleiner M., Marsland B. J., Cell Host Microbe 2018, 24, 857. - PubMed
    1. Morris A., Beck J. M., Schloss P. D., Campbell T. B., Crothers K., Curtis J. L., Flores S. C., Fontenot A. P., Ghedin E., Huang L., Jablonski K., Kleerup E., Lynch S. V., Sodergren E., Twigg H., Young V. B., Bassis C. M., Venkataraman A., Schmidt T. M., Weinstock G. M., Am J. Respir. Crit. Care Med. 2013, 187, 1067. - PMC - PubMed
    1. Erb‐Downward J. R., Thompson D. L., Han M. K., Freeman C. M., Mccloskey L., Schmidt L. A., Young V. B., Toews G. B., Curtis J. L., Sundaram B., Martinez F. J., Huffnagle G. B., PLoS One 2011, 6, e16384. - PMC - PubMed
    1. Wypych T. P., Wickramasinghe L. C., Marsland B. J., Nat. Immunol. 2019, 20, 1279. - PubMed
    1. Huffnagle G. B., Dickson R. P., Lukacs N. W., Mucosal Immunol. 2017, 10, 299. - PMC - PubMed

Publication types

LinkOut - more resources