. 2022 Aug 12:13:983632.
doi: 10.3389/fimmu.2022.983632. eCollection 2022.

Identification of prognostic gene expression signatures based on the tumor microenvironment characterization of gastric cancer

Affiliations

Identification of prognostic gene expression signatures based on the tumor microenvironment characterization of gastric cancer

Qingqing Sang et al. Front Immunol. .

Abstract

Increasing evidence has elucidated that the tumor microenvironment (TME) shows a strong association with tumor progression and therapeutic outcome. We comprehensively estimated the TME infiltration patterns of 111 gastric cancer (GC) and 21 normal stomach mucosa samples based on bulk transcriptomic profiles based on which GC could be clustered as three subtypes, TME-Stromal, TME-Mix, and TME-Immune. The expression data of TME-relevant genes were utilized to build a GC prognostic model-GC_Score. Among the three GC TME subtypes, TME-Stomal displayed the worst prognosis and the highest GC_Score, while TME-Immune had the best prognosis and the lowest GC_Score. Connective tissue growth factor (CTGF), the highest weighted gene in the GC_Score, was found to be overexpressed in GC. In addition, CTGF exhibited a significant correlation with the abundance of fibroblasts. CTGF has the potential to induce transdifferentiation of peritumoral fibroblasts (PTFs) to cancer-associated fibroblasts (CAFs). Beyond characterizing TME subtypes associated with clinical outcomes, we correlated TME infiltration to molecular features and explored their functional relevance, which helps to get a better understanding of carcinogenesis and therapeutic response and provide novel strategies for tumor treatments.

Keywords: CTGF; fibroblasts; gastric cancer; prognostic model; tumor microenvironment.


Conflict of interest statement

The authors declare that the research was conducted in the absence of any commercial or financial relationships that could be construed as a potential conflict of interest.

Figures

Figure 1
Figure 1
Flowchart of the study. The TME infiltration patterns of 111 GC and 21 normal stomach mucosa samples based on bulk transcriptomic profiles were estimated in this study, and a predictive model GC_Score for prognosis and drug responses with interpretability for carcinogenesis was developed. Furthermore, a TME-modulating gene, CTGF, was proposed to activate CAFs, thereby promoting the progression of GC.
Figure 2
Figure 2
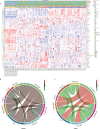
The landscape of the TME in GC. (A) Heatmap of 64 TME cells for 111 GC and 21 normal samples. pTNM, Borrmann classification, Tumor invasion depth, Regional lymph node, Distant metastasis, Tumor location, Tumor position, Gender, Age, Tissue differentiation, Histological type, Status, Cluster, and CellType were shown as patient annotations. (B, C) Correlation of cell proportion among the 12 survival-related cell populations in normal and tumor groups. Red, positive correlation; green, negative correlation; black, no correlation. The width of the connection line was correlated with the absolute value of its corresponding Spearman correlation coefficient. Note that the cell bar in panels (B) and (C) has a different scale.
Figure 3
Figure 3
The characteristics of TME subtypes. (A) Unsupervised clustering of GSE54129 cohort with matched xCell scores; the samples named in black font was the normal group. (B, C) Kaplan–Meier curves for overall survival (OS) and disease-free survival (DFS) of GC patients with the TME subtypes (log-rank test). (D–H) The distribution of five cell types included 64 TME cells in TME-Stromal and TME-Immune subtypes. TME-Stromal and TME-Immune were shown in blue and green, respectively. The cell types associated with poor clinical outcomes were circled in blue, while the cell types associated with good clinical outcomes were circled in green. The dominant cell types displayed a significant difference proportion in TME-Stromal and TME-Immune noted by the red rectangular frame. The thick line represented the median value. The bottom and top of the boxes were the 25th and 75th percentiles (interquartile range). The dotted line showed the average score of each cell type. The cells enclosed by the circle were significant for OS. The statistical difference was compared through the t-test. * p < 0.05; ** p < 0.01; *** p < 0.001; **** p < 0.0001.
Figure 4
Figure 4
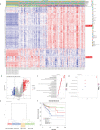
Investigation of the TME infiltration-dependent expression change. (A) Heatmap of the 345 differentially expressed genes (DEGs) between TME-Stromal and TME-Immune. (B) Volcano plot of the 345 DEGs. (C, D) GO enrichment analysis of the 345 DEGs: DEGs_Up and DEGs_Down. (E) Unsupervised hierarchical clustering of the 345 DEGs based on expression data to classify patients into four groups: DEG-Control, DEG-GoodP, DEG-IntermediateP, and DEG-PoorP. (F) Kaplan–Meier curves for overall survival (OS) of GC patients with the TME-dependent transcriptomic subtypes (log-rank test).
Figure 5
Figure 5
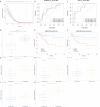
The GC_Score model and its prognostic significance. (A) Several cell types were involved in the LASSO model. (B, C) The GC_Score was measured by time-dependent receiver operating characteristic (ROC) curves in the training set and the test set. (D) The boxplot of GC_Score in DEG-GoodP and DEG-PoorP subtypes. The thick line represented the median value. The bottom and top of the boxes were the 25th and 75th percentiles (interquartile range). (E, F) Survival impact of the GC_Score, Kaplan–Meier curves for overall survival (OS) and disease-free survival (DFS) in the GSE54129 cohort. (G–K) The boxplot of drug sensitivity in the GC_Score_Low and the GC_Score_High group. (G) Axitinib, (H) methotrexate, (I) RDEA119, (J) trametinib, (K) vorinostat.
Figure 6
Figure 6
CTGF has the potential to induce PTFs to be CAFs. (A, B) Correlations between GC_Score and fibroblasts/CTGF and fibroblasts. The regression lines and confidence interval shadows were calculated by single-variable regression. (C) The boxplot of the CTGF expression in normal and cancer samples. The thick line represented the median value. The bottom and top of the boxes were the 25th and 75th percentiles (interquartile range). (D) Survival impact of the CTGF expression, Kaplan–Meier curves for overall survival (OS) in the GSE54129 cohort. (E) Representative IHC staining with CTGF antibody in GC and paired adjacent non-tumor tissues. Magnification ×200 and ×400. (F) The pie graph of IHC Score of CTGF in GC tissues and corresponding non-tumor tissues, Positive: IHC ≥8, Negative: IHC <8. (G) The boxplot of IHC Score of CTGF in normal and cancer samples. The thick line represented the median value. The bottom and top of the boxes were the 25th and 75th percentiles (interquartile range). (H) Survival impact of IHC Score of CTGF, Kaplan–Meier curves for OS. (I) Gene set enrichment analysis (GSEA) of CTGF. (J) qRT-PCR detection of FSP and FAP mRNA levels in PTFs, CAFs, and PTFs treated with different concentrations of rhCTGF protein for 50, 100, and 200 ng/ml. (K, L) Protein levels of FSP and FAP in PTFs, CAFs, and PTFs treated with different concentrations of rhCTGF protein were analyzed by Western blotting. These data were presented as the mean ± SD; n = 3 independent experiments.

Similar articles

Cited by

References

    1. Sung H, Ferlay J, Siegel RL, Laversanne M, Soerjomataram I, Jemal A, et al. . Global cancer statistics 2020: GLOBOCAN estimates of incidence and mortality worldwide for 36 cancers in 185 countries. CA Cancer J Clin (2021) 71:209–49. doi: 10.3322/caac.21660 - DOI - PubMed
    1. Achard C, Surendran A, Wedge ME, Ungerechts G, Bell J, Ilkow CS. Lighting a fire in the tumor microenvironment using oncolytic immunotherapy. EBioMedicine (2018) 31:17–24. doi: 10.1016/j.ebiom.2018.04.020 - DOI - PMC - PubMed
    1. Gong Z, Zhang J, Guo W. Tumor purity as a prognosis and immunotherapy relevant feature in gastric cancer. Cancer Med (2020) 9:9052–63. doi: 10.1002/cam4.3505 - DOI - PMC - PubMed
    1. Newman AM, Liu CL, Green MR, Gentles AJ, Feng W, Xu Y, et al. . Robust enumeration of cell subsets from tissue expression profiles. Nat Methods (2015) 12:453–7. doi: 10.1038/nmeth.3337 - DOI - PMC - PubMed
    1. Becht E, Giraldo NA, Lacroix L, Buttard B, Elarouci N, Petitprez F, et al. . Estimating the population abundance of tissue-infiltrating immune and stromal cell populations using gene expression. Genome Biol (2016) 17:218. doi: 10.1186/s13059-016-1070-5 - DOI - PMC - PubMed

Publication types