. 2022 Aug 11:13:945021.
doi: 10.3389/fimmu.2022.945021. eCollection 2022.

Antibodies against Spike protein correlate with broad autoantigen recognition 8 months post SARS-CoV-2 exposure, and anti-calprotectin autoantibodies associated with better clinical outcomes

Affiliations

Antibodies against Spike protein correlate with broad autoantigen recognition 8 months post SARS-CoV-2 exposure, and anti-calprotectin autoantibodies associated with better clinical outcomes

Rhiane Moody et al. Front Immunol. .

Abstract

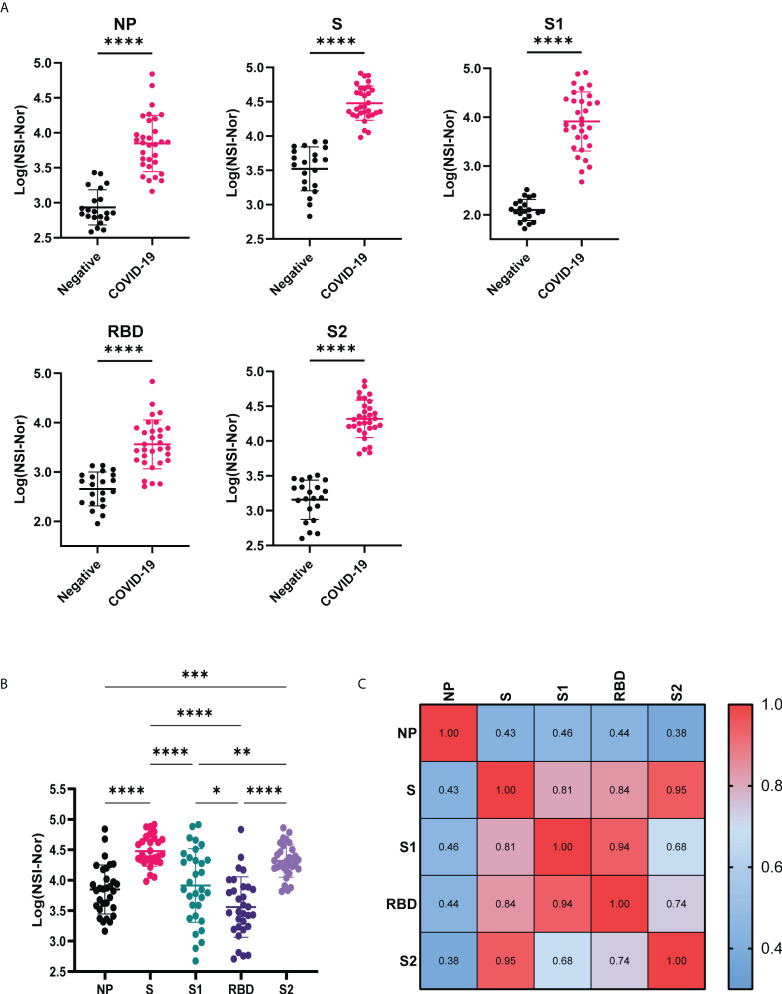
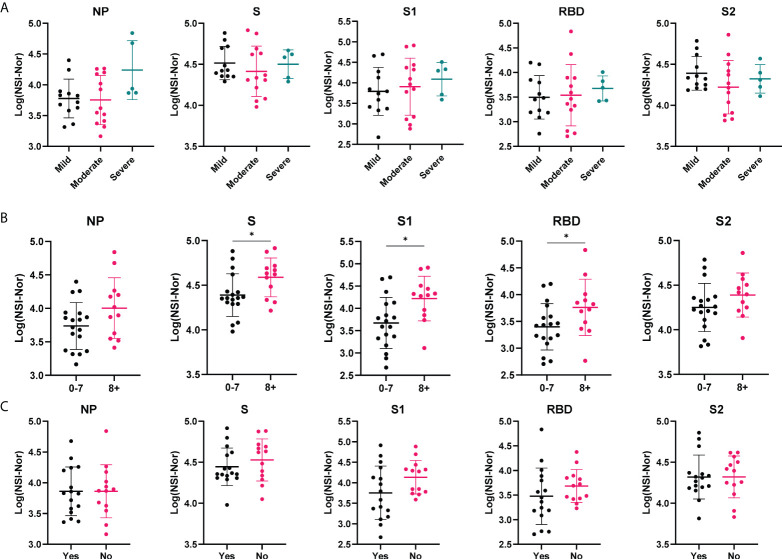
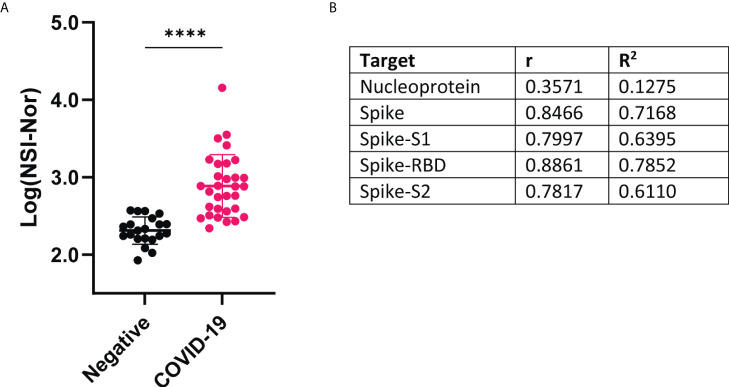
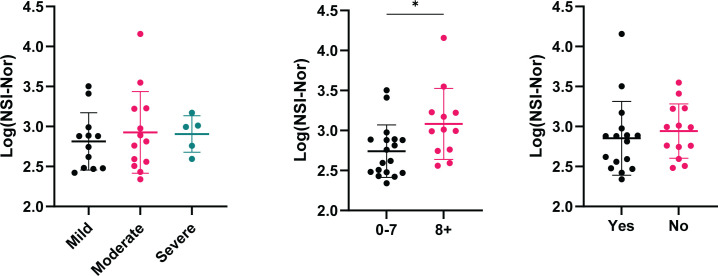
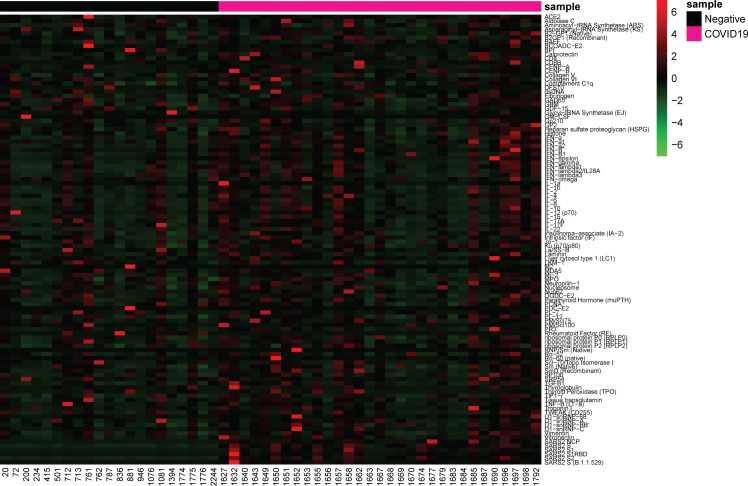
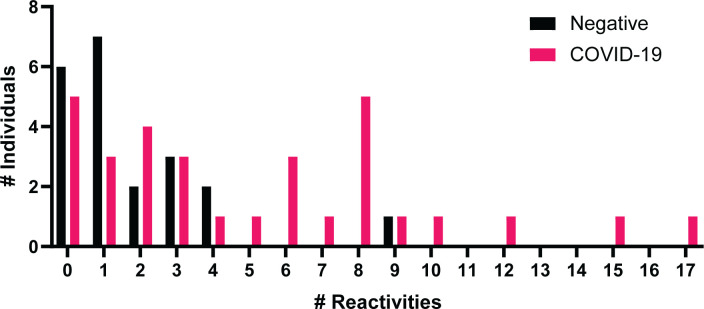
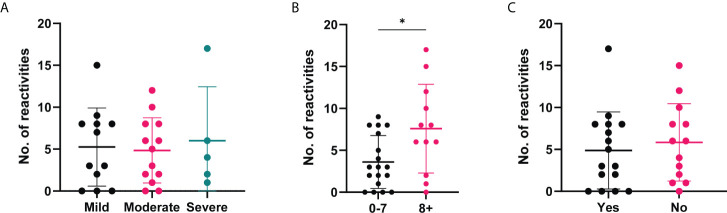
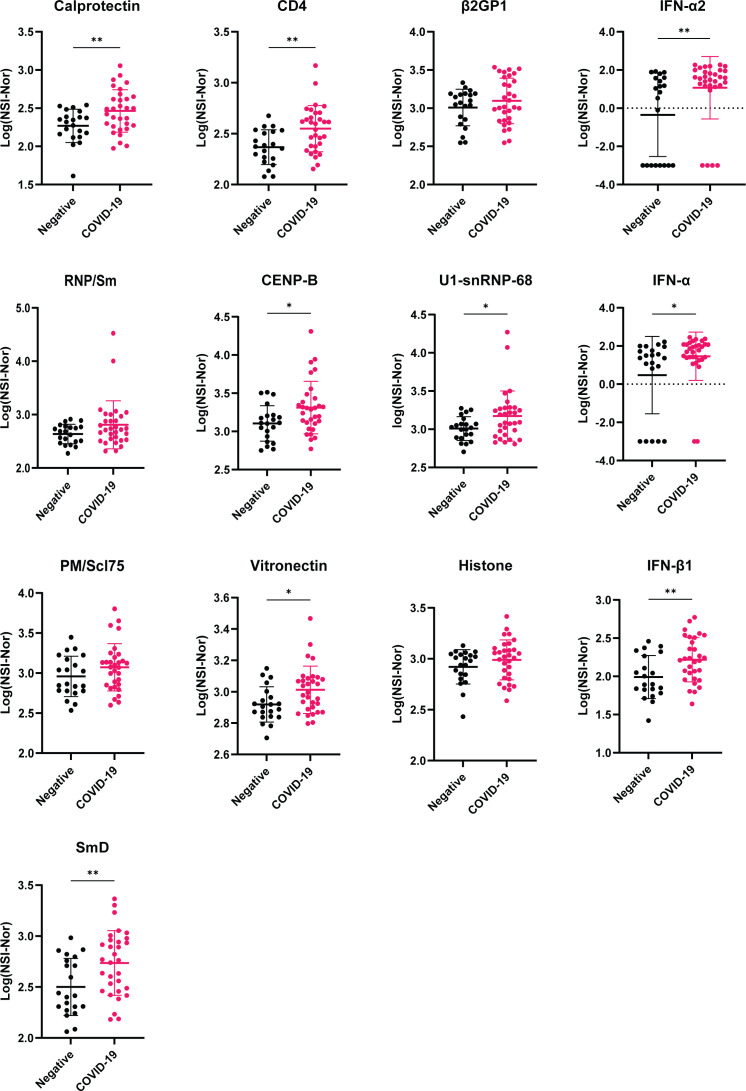
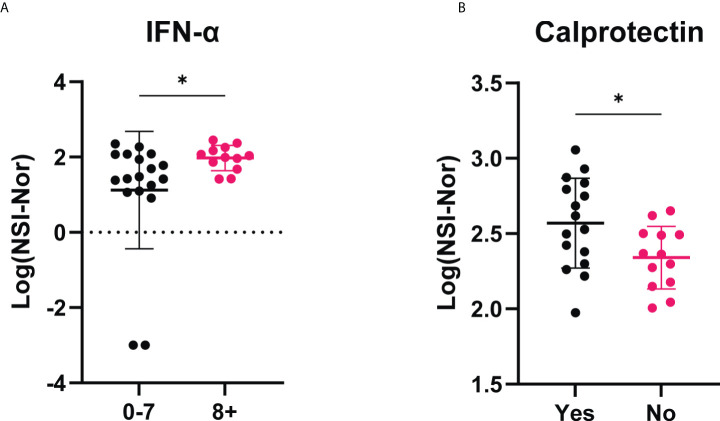
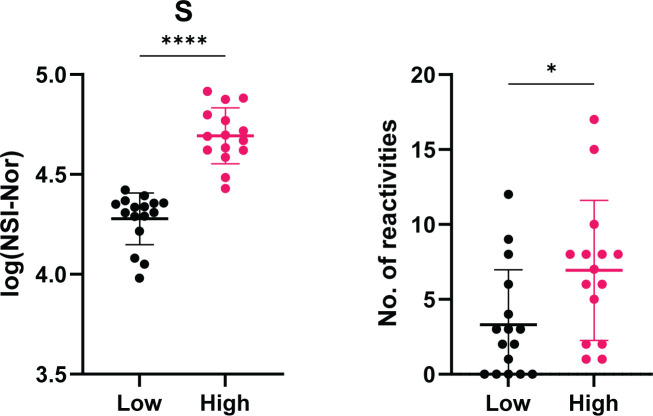
Autoantibodies to multiple targets are found during acute COVID-19. Whether all, or some, persist after 6 months, and their correlation with sustained anti-SARS-CoV-2 immunity, is still controversial. Herein, we measured antibodies to multiple SARS-CoV-2 antigens (Wuhan-Hu-1 nucleoprotein (NP), whole spike (S), spike subunits (S1, S2 and receptor binding domain (RBD)) and Omicron spike) and 102 human proteins with known autoimmune associations, in plasma from healthcare workers 8 months post-exposure to SARS-CoV-2 (n=31 with confirmed COVID-19 disease and n=21 uninfected controls (PCR and anti-SARS-CoV-2 negative) at baseline). IgG antibody responses to SARS-CoV-2 antigens were significantly higher in the convalescent cohort than the healthy cohort, highlighting lasting antibody responses up to 8 months post-infection. These were also shown to be cross-reactive to the Omicron variant spike protein at a similar level to lasting anti-RBD antibodies (correlation r=0.89). Individuals post COVID-19 infection recognised a common set of autoantigens, specific to this group in comparison to the healthy controls. Moreover, the long-term level of anti-Spike IgG was associated with the breadth of autoreactivity post-COVID-19. There were further moderate positive correlations between anti-SARS-CoV-2 responses and 11 specific autoantigens. The most commonly recognised autoantigens were found in the COVID-19 convalescent cohort. Although there was no overall correlation in self-reported symptom severity and anti-SARS-CoV-2 antibody levels, anti-calprotectin antibodies were associated with return to healthy normal life 8 months post infection. Calprotectin was also the most common target for autoantibodies, recognized by 22.6% of the overall convalescent cohort. Future studies may address whether, counter-intuitively, such autoantibodies may play a protective role in the pathology of long-COVID-19.

Keywords: COVID-19; SARS-CoV-2; antibodies; autoantibodies; autoimmunity.


Conflict of interest statement

The authors declare that the research was conducted in the absence of any commercial or financial relationships that could be construed as a potential conflict of interest.

Figures

Figure 1
Figure 1
Anti-SARS-CoV-2 IgG responses to Nucleoprotein, Spike and Spike subunits. (A) Comparison of IgG-specific antibody responses against the SARS-CoV-2 Nucleoprotein (NP), Spike (S) and spike subunits S1, S2 and Receptor Binding Domain (RBD) between COVID-19 negative and convalescent plasma samples. (B) Comparison of IgG antibody responses to the different SARS-CoV-2 antigens within the convalescent group. (C) Pearson R correlation of anti-SARS-CoV-2 responses. Data shown as log transformed NSI-Nor values with mean ± standard deviation, and statistical significance assessed with unpaired T test (A) and Tukey’s multiple comparisons test (B), where * p <0.05, ** p <0.01, *** p <0.0005, **** p <0.0001.
Figure 2
Figure 2
Antibody responses to SARS-CoV-2 antigens according to clinical characteristics. Anti-SARS-CoV-2 antibody responses to Nucleoprotein (NP), Spike (S) and spike subunits S1, S2 and Receptor Binding Domain (RBD), in the COVID-19 cohort based on self-reported categories. (A) Symptom severity as mild (n=12), moderate (n=13) or severe (n=5). (B) Number of symptoms experienced, 0-7 (n= 18) or 8+ (n=12). (C) whether ‘Yes’ they reported to feel normal post-infection (n=16) or ‘No’ they did not (n=13). Data shown as log transformed NSI-Nor values, with the mean ± standard deviation. Significance (*p<0.05) was assessed with the Kruskal-Wallis test (A), unpaired T test (B) and Mann-Whiney test (C).
Figure 3
Figure 3
IgG antibody responses to Omicron variant spike protein and correlation with Wuhan-Hu-1 antigens (A) Comparison of antibody responses to Omicron spike protein between COVID-19 convalescent and negative groups. Data shown as log transformed NSI-Nor values and unpaired T tested performed, **** p <0.0001 (B) Pearson R correlation results between anti-Omicron spike antibody response and anti-original Wuhan-specific targets.
Figure 4
Figure 4
Cross-reactive antibody responses to Omicron spike according to clinical characteristics. IgG antibody responses to Omicron spike protein based on self-reported categories (Left) Symptom severity as mild (n=12), moderate (n=13) or severe (n=5). (Middle) Number of symptoms experienced, 0-7 (n=18) or 8+ (n=12), p=0.015. (Right) Whether ‘Yes’ (n=16) or 'No' (n=13) they reported to feel back to normal, or not, post infection. Data shown as log transformed NSI-Nor values, with the mean ± standard deviation. Significance (*p < 0.05) was assessed with the Kruskal-Wallis test and Mann-Whitney test, respectively.
Figure 5
Figure 5
Antibody responses to SARS-CoV-2 antigens and autoantigens. Heatmap depicting NSI-Nor values of IgG antibodies to SARS-CoV-2 antigens (n=6) and autoantigens (n=102). COVID-19 negative (n=21) and COVID-19 convalescent (n=31) individuals grouped along the x-axis. Autoantigens listed alphabetically along y-axis, and SARS-CoV-2 antigens at the bottom.
Figure 6
Figure 6
Number of positive autoantibody reactivities in COVID-19 negative and convalescent individuals. The number of positive autoantibodies reactivities in COVID-19 negative and convalescent individuals. Positive considered as NSI-Nor values at or above the average plus three standard deviations of the COVID-19 negative cohort.
Figure 7
Figure 7
Number of positive autoantibody reactivities in COVID-19 convalescent cases based on self-reported symptoms and recovery. The number of positive autoantibodies according to self-reported categories. (A) Symptom severity reported as mild (n=12), moderate (n=13) or severe (n=5). (B) Number of symptoms experienced, 0-7 (n=18) or 8+ (n=12), p=0.045. (C) Whether 'Yes' they felt normal post-infection (n=16) or 'No' they did not (n=13). Data shown as log transformed NSI-Nor values, with the mean ± standard deviation. Significance (*p < 0.05) was assessed with the Kruskal-Wallis test, Mann-Whitney and Unpaired T test, respectively.
Figure 8
Figure 8
Comparison of antibody responses between COVID-19 negative and convalescent individuals for targets with highest number of positive reactivities. Plots of the 13 autoantigens with the highest number of positive COVID-19 convalescent individuals. Following transformation, normality was tested by the Anderson-Darling test prior assessing significance using either unpaired T-test or Mann-Whitney, for normal and non-normal distributed data, respectively. *p<0.05, ** p< 0.01. Data shown as log transformed NSI-Nor values with mean ± standard deviation.
Figure 9
Figure 9
IgG antibody responses to IFN-α and calprotectin among COVID-19 convalescent individuals based on self-reported clinical characteristics. (A) Anti-IFN-α autoantibody responses compared between those who experienced less (0-7, n=18) or more (8+, n=12) symptoms during the initial outbreak period. (B) Anti-calprotectin autoantibodies according to self-reported ‘Yes’ they felt normal (n=16) or ‘No’ they did not feel normal (n=13) eight months post infection period. Data shown as log transformed NSI-Nor values with the mean ± standard deviation. Following normality test, significance (*p < 0.05) assessed using (A) Mann-Whitney test, p=0.030, and (B) unpaired T test, p=0.027.
Figure 10
Figure 10
Association between level of anti-Spike antibody responses and the number of positive autoantibody reactivities. COVID-19 convalescent individuals (n=31) divided into high and low anti-S using the median of responses as the dividing point. The number of autoantibody reactivities within the individuals split into the corresponding high or low group. Normality tested using the Anderson-Darling test prior assessing significance using the Mann-Whitney test. *p<0.05, **** p< 0.0001. Data shown as mean ± standard deviation.

Similar articles

Cited by

References

    1. Huang C, Wang Y, Li X, Ren L, Zhao J, Hu Y, et al. . Clinical features of patients infected with 2019 novel coronavirus in wuhan, China. Lancet (2020) 395(10223):497–. doi: 10.1016/S0140-6736(20)30183-5 - DOI - PMC - PubMed
    1. Han H, Xie L, Liu R, Yang J, Liu F, Wu K, et al. . Analysis of heart injury laboratory parameters in 273 covid-19 patients in one hospital in wuhan, China. J Med Virol (2020) 92(7):819–23. doi: 10.1002/jmv.25809 - DOI - PMC - PubMed
    1. Nalleballe K, Reddy Onteddu S, Sharma R, Dandu V, Brown A, Jasti M, et al. . Spectrum of neuropsychiatric manifestations in covid-19. Brain Behav Immun (2020) 88:71–4. doi: 10.1016/j.bbi.2020.06.020 - DOI - PMC - PubMed
    1. Moody R, Wilson K, Flanagan KL, Jaworowski A, Plebanski M. Adaptive immunity and the risk of autoreactivity in covid-19. Int J Mol Sci (2021) 22(16):8965. doi: 10.3390/ijms22168965 - DOI - PMC - PubMed
    1. Rojas M, Rodríguez Y, Acosta-Ampudia Y, Monsalve DM, Zhu C, Li Q-Z, et al. . Autoimmunity is a hallmark of post-covid syndrome. J Trans Med (2022) 20(1):129. doi: 10.1186/s12967-022-03328-4 - DOI - PMC - PubMed

Supplementary concepts