. 2022 Aug 10:13:926650.
doi: 10.3389/fimmu.2022.926650. eCollection 2022.

Insulin B-chain hybrid peptides are agonists for T cells reactive to insulin B:9-23 in autoimmune diabetes

Affiliations

Insulin B-chain hybrid peptides are agonists for T cells reactive to insulin B:9-23 in autoimmune diabetes

Janet M Wenzlau et al. Front Immunol. .

Abstract

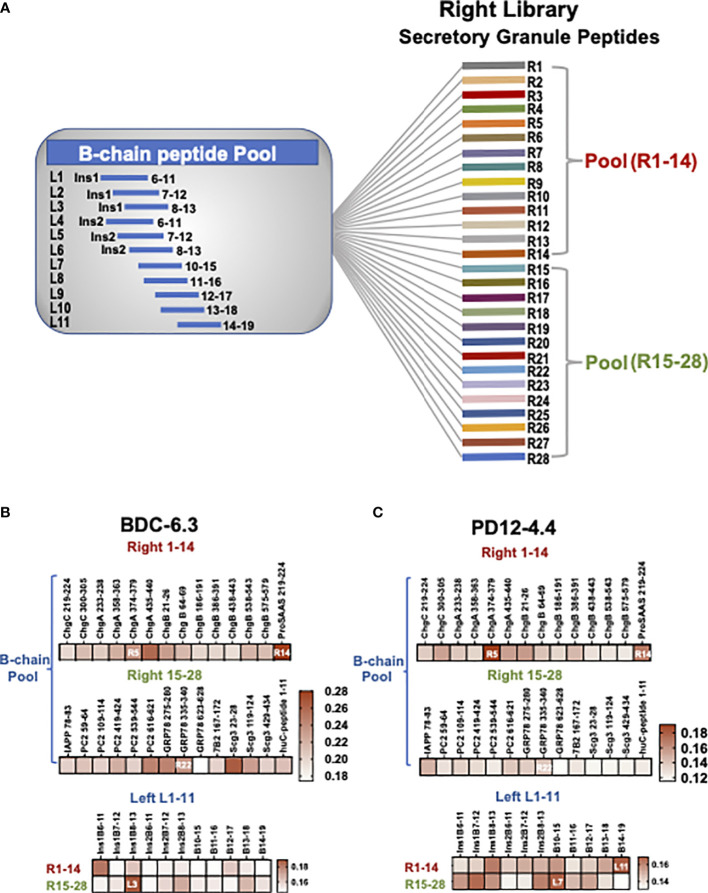
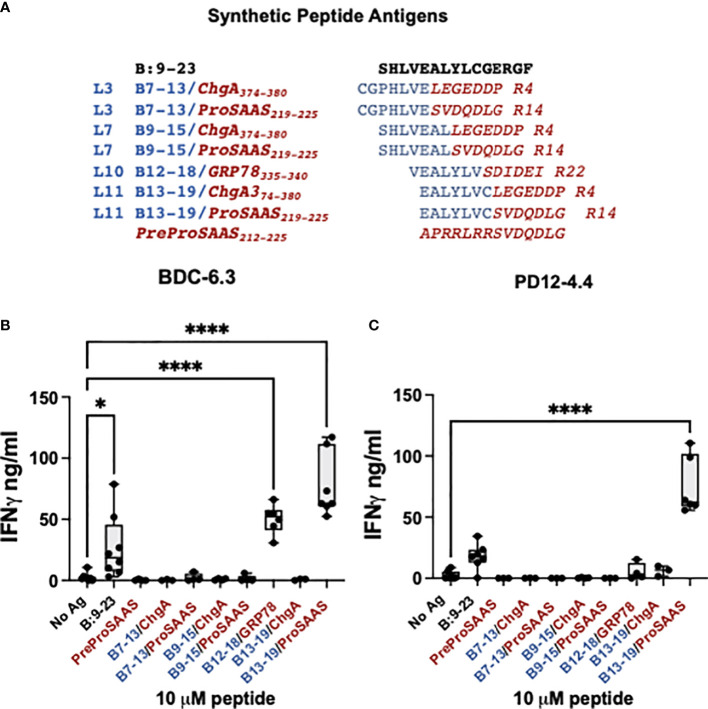
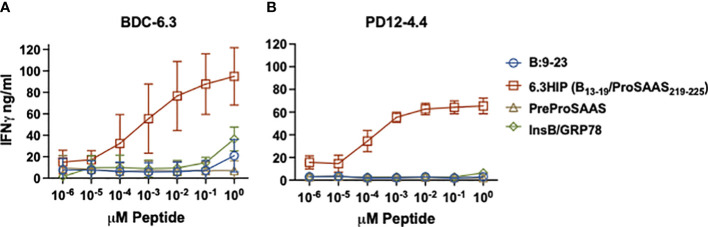
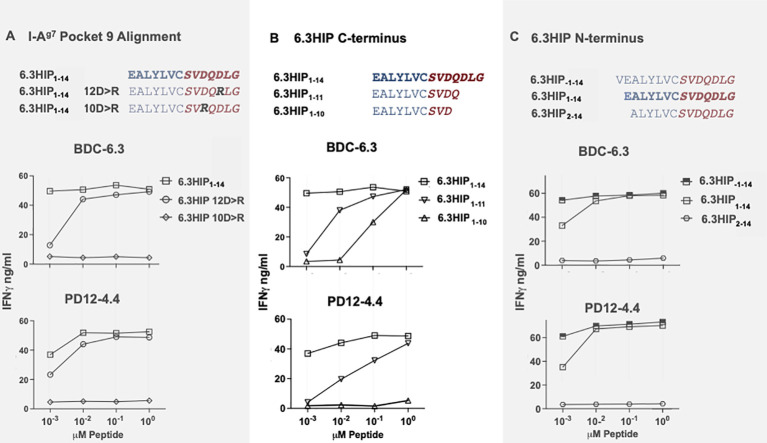
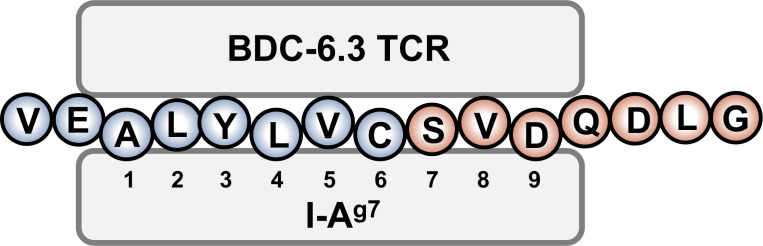
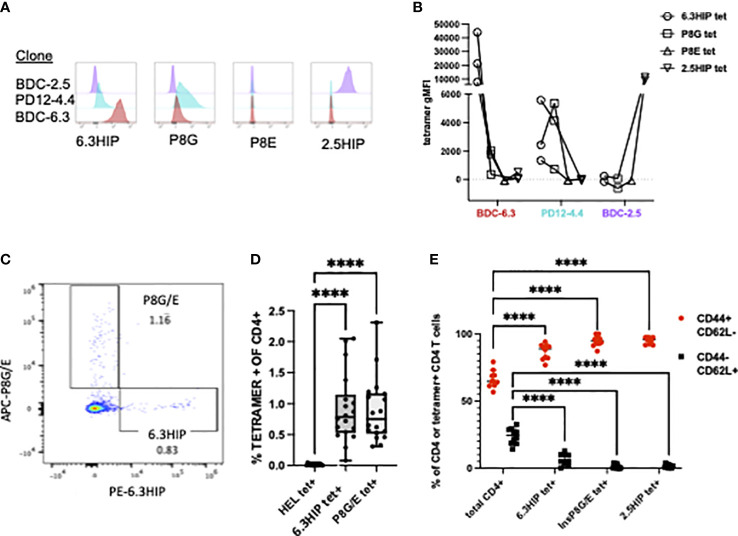
Insulin is considered to be a key antigenic target of T cells in Type 1 Diabetes (T1D) and autoimmune diabetes in the NOD mouse with particular focus on the B-chain amino acid sequence B:9-23 as the primary epitope. Our lab previously discovered that hybrid insulin peptides (HIPs), comprised of insulin C-peptide fragments fused to other β-cell granule peptides, are ligands for several pathogenic CD4 T cell clones derived from NOD mice and for autoreactive CD4 T cells from T1D patients. A subset of CD4 T cell clones from our panel react to insulin and B:9-23 but only at high concentrations of antigen. We hypothesized that HIPs might also be formed from insulin B-chain sequences covalently bound to other endogenously cleaved ß-cell proteins. We report here on the identification of a B-chain HIP, termed the 6.3HIP, containing a fragment of B:9-23 joined to an endogenously processed peptide of ProSAAS, as a strong neo-epitope for the insulin-reactive CD4 T cell clone BDC-6.3. Using an I-Ag7 tetramer loaded with the 6.3HIP, we demonstrate that T cells reactive to this B-chain HIP can be readily detected in NOD mouse islet infiltrates. This work suggests that some portion of autoreactive T cells stimulated by insulin B:9-23 may be responding to B-chain HIPs as peptide ligands.

Keywords: B:9-23; HIPS; NOD mouse; T cell; autoimmune diabetes; insulin; type 1 diabetes.


Conflict of interest statement

The authors declare that the research was conducted in the absence of any commercial or financial relationships that could be construed as a potential conflict of interest.

Figures

Figure 1
Figure 1
B-chain HIP crosslinking library scheme and IFN-γ ELISAs for T cell clone BDC-6.3 and PD12-4.4. (A) In the Left Library, 11 individual B-chain peptides form peptide bonds with two pools of right secretory granule peptides (pools R1-14, R15-28). The Right Library is comprised of 28 individual right peptides that form peptide bonds with the pool of 11 B-chain left peptides. (B, C) Heat maps for IFN-γ ELISA screening of T cell clones BDC-6.3 and PD12-4.4 with B chain Right and Left HIP libraries. Data is shown as absorption @ 415 nm minus background for a single screen for each T cell clone.
Figure 2
Figure 2
BDC-6.3 IFN-γ response to candidate B-chain HIP antigens. (A) Synthetic peptides representing the highest scoring peptides within the Left and Right peptide libraries. Blue = B:9-23 derived peptides, red italics = natural cleavage product peptides from other ß-cell proteins. The PreProSAAS peptide is 14 amino acids spanning a dibasic proteolytic processing site and was included as a negative control. (B) IFN-γ responses of T cell clone BDC-6.3 to 10 µM concentrations of B:9-23 or synthetic B-chain HIP candidates. (C) IFN-γ responses of T cell clone PD12-4.4 to 10 µM concentrations of B:9-23 or synthetic B-chain HIP candidates. Compiled data is shown for the average of 3-8 experiments (BDC-6.3) or 3-7 experiments (PD12-4.4), with statistical analysis using a one-way ANOVA with Dunnett’s multiple comparison test *P<0.05, ****P<0.0001 where the box defines the interquartile range, and the whiskers indicate minimum and maximum values.
Figure 3
Figure 3
IFN-γ responses of T cell clones to parent peptides and B-chain HIPs. Stimulation of T cell clones BDC-6.3 (A) and PD12-4.4 (B) with titrations (0.00001 - 10 μM) of individual left (B:9-23) and right (PreProSAAS212-225) components of the 6.3HIP (B13-19/ProSAAS219-225), the 6.3HIP and B-chain HIP InsB/GRP78335-340. Blue open circle = B:9-23, red open square = 6.3HIP, brown open triangle = PreProSAAS212-225, green open diamond = InsB/GRP78335-340. Compiled data is shown for the mean ± SD of 3-5 experiments (BDC-6.3) and 3-4 experiments (PD12-4.4). Data is expressed as IFN-γ ng/ml.
Figure 4
Figure 4
I-Ag7 binding pocket 9 and optimal limits of the 6.3HIP antigen. (A) Determination of 6.3HIP residue occupying p9 of I-Ag7. IFN-γ ELISA assays of T cell clones BDC-6.3 and PD12-4.4 stimulated with 6.3HIP1-14 antigen compared to 6.3HIP substituted with 12D>R or 10D>R. (B) Response to C-terminal truncations of the 6.3HIP. IFN-γ production by BDC-6.3 and PD12-4.4 in response antigens 6.3HIP, 6.3HIP1-11 and 6.3HIP1-10. (C) Limits of the 6.3HIP epitope N-terminus. IFN-γ production by BDC-6.3 and PD12-4.4 in response to peptides 6.3HIP. 6.3HIP-1-14, and 6.3HIP2-14. Blue = B:9-23 sequence, red italics = ProSAAS sequence. Representative data from 4 experiments (A), 6 experiments (B), and 4 experiments (C) shown as ng/ml IFN-γ.
Figure 5
Figure 5
Schematic diagram of the 6.3HIP binding in the trimolecular complex. I-Ag7 binding pockets 1, 4, and 6 are occupied by insB-chain amino acids 14 (A), 17 (L) and 19 (C), respectively. ProSAAS amino acids 219 (S) and 221 (D) residue in pockets 7 and 9 of I-Ag7.
Figure 6
Figure 6
MHC Class II tetramer staining of CD4+ T cell clones and islet infiltrating CD4+ T cells. Representative histograms of (A) T cell clones BDC-2.5 (purple), PD12-4.4 (blue), and BDC-6.3 (red) stained with 6.3HIP, P8G, P8E, and 2.5HIP tetramers and the (B) geometric MFI from 2-3 experiments with lines connecting tetramer stains conducted on the same day. (C) Representative CD4 T cells from NOD islets stained with a mixture of I-Ag7 tetramers loaded with the P8G/E insulin mimotopes and 6.3HIP, and labeled with APC and PE, respectively. (D) Summary of results of the analysis of infiltrating CD4+ T cells from the islet isolations from a total of 18 NOD mice (5 separate islet isolations) stained with hen egg lysozyme (HEL), 6.3HIP and P8G/E tetramers. Data represented as percent of live lin- CD4+ T cells positive for each tetramer/animal and analyzed using a one-way ANOVA with Tukey’s multiple comparison test, (****P<0.0001) where the box defines the interquartile range, and the whiskers indicate minimum and maximum values. (E) Summary data (n=10) comparing the proportion of CD44+ and CD62L+ in total CD4 T cells or tetramer+ CD4 T cells within islets. A two-way ANOVA was used with Dunnett’s multiple comparison test to assess the antigen experience phenotype of CD4 T cells staining with each tetramer compared to the total CD4 infiltrate as a control (****P<0.0001). Gating strategy for tetramer staining of T cells is provided in Figure S2 .

Similar articles

Cited by

References

    1. Wegmann DR, Eisenbarth GS. It's insulin. J Autoimmun (2000) 15(3):286–91. doi: 10.1006/jaut.2000.0444 - DOI - PubMed
    1. Yu L, Robles DT, Abiru N, Kaur P, Rewers M, Kelemen K, et al. . Early expression of antiinsulin autoantibodies of humans and the NOD mouse: evidence for early determination of subsequent diabetes. Proc Natl Acad Sci U S A (2000) 97(4):1701–6. doi: 10.1073/pnas.040556697 - DOI - PMC - PubMed
    1. Ilonen J, Hammais A, Laine AP, Lempainen J, Vaarala O, Veijola R, et al. . Patterns of beta-cell autoantibody appearance and genetic associations during the first years of life. Diabetes (2013) 62(10):3636–40. doi: 10.2337/db13-0300 - DOI - PMC - PubMed
    1. Palmer JP, Asplin CM, Clemons P, Lyen K, Tatpati O, Raghu PK, et al. . Insulin antibodies in insulin-dependent diabetics before insulin treatment. Science (1983) 222(4630):1337–9. doi: 10.1126/science.6362005 - DOI - PubMed
    1. Böhmer K, Keilacker H, Kuglin B, Hübinger A, Bertrams J, Gries FA, et al. . Proinsulin autoantibodies are more closely associated with type 1 (insulin-dependent) diabetes mellitus than insulin autoantibodies. Diabetologia (1991) 34(11):830–4. doi: 10.1007/BF00408359 - DOI - PubMed

Publication types