. 2022 Aug 12:13:939504.
doi: 10.3389/fimmu.2022.939504. eCollection 2022.

The potential role of exosomal miRNAs and membrane proteins in acute HIV-infected people

Affiliations

The potential role of exosomal miRNAs and membrane proteins in acute HIV-infected people

Xin Li et al. Front Immunol. .

Abstract

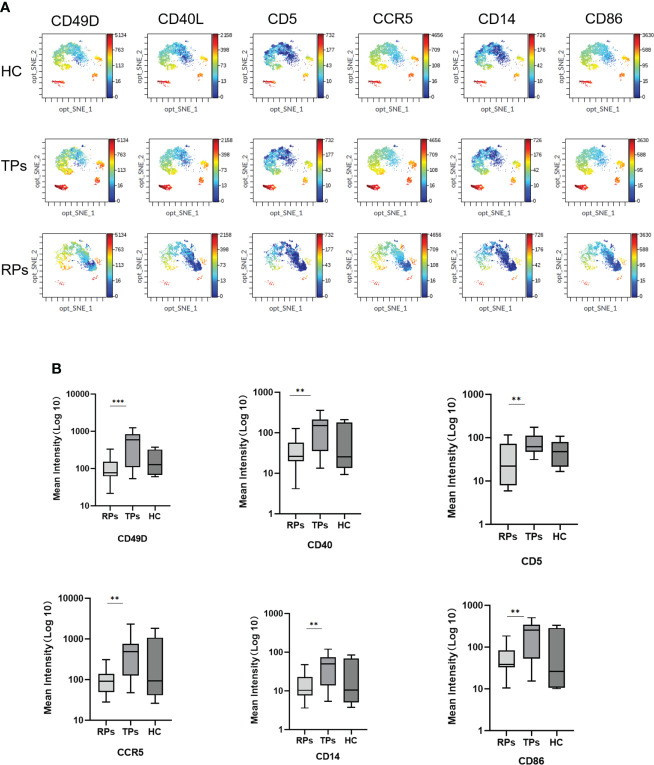
Exosomes play an important role during human immunodeficiency virus (HIV) acute infection. Yet, information regarding its cargo and its association with HIV rapid progressors (RPs) and typical progressors (TPs) remain largely unknown. In this study, exosomal miRNAs sequencing and mass cytometry were used to identify differential exosomal miRNAs and membrane proteins that participate in the pathogenesis of TPs and RPs. We discovered that miR-144-5p, miR-1180-3p, miR-451a, miR-362-5p, and miR-625-5p are associated with the TPs and miR-362-5p with the RPs. Decreased autophagy, amino acid metabolism, immune response, and IL-6 are closely related to RPs. In addition, SP1 was selected as the most significant transcription factor (TF) associated with disease progression. CD49D, CD5, CCR5, CD40, CD14, and CD86 were selected as the differential exosomal membrane proteins between TPs and RPs. This study provides valuable information for clarifying the mechanism in people with acute HIV infection.

Keywords: HIV; exosomal member proteins; exosomal miRNAs; rapid progressors; typical progressors.


Conflict of interest statement

The authors declare that the research was conducted in the absence of any commercial or financial relationships that could be construed as a potential conflict of interest.

Figures

Figure 1
Figure 1
The comparison of CD4 and virus load (VL) at month 1, 2, and 12 in the TPs and RPs.
Figure 2
Figure 2
Basic characteristics and identification of exosomes in different disease progress groups. (A) Exosomes morphology analyzed by representative electron microscopy. Scale bar, 200 nm. (B) Ultrasensitive laser confocal microscopy was used to identify Exosomes (CD9-AF647). (c) NTA obtained the nanoparticle size distribution for plasma Exosomes. The particle size is between 30 and 150; the highest peak is observed at 70 nm. (D) Western blot analysis of actin, CD9, CD63, CD81, and GAPDH expression. (E, G) The peak size between HC, TPs, and RPs (e) and between month 1, 6, and 12 in TPs and RPs groups (g). (F, H) The concentration of Exosomes between HC, TPs, and RPs (f) and between month 1, 6, and 12 in TPs and RPs groups (h). * p<0.05, ****p<0.0001.
Figure 3
Figure 3
The analysis of differential HIV-specific miRNAs expression profile and their function. (A) The Cluster heatmap of the 208 differential exosomal miRNAs between HIV acute infected patients and HCs. (B-D) The GO terms interpretation for the functions of these 208 differential miRNAs. (E) The KEGG terms interpretation for the functions of these 208 differential miRNAs. (F) The miRNA target interaction regulatory network form GO terms. (G) The miRNA target interaction regulatory network form KEGG terms.
Figure 4
Figure 4
The analysis of key differential exosomal miRNAs and their variation tendency. (A) Venn plot showing differently expressed miRNAs between TPs and RPs at 1, 6, and 12 months. (B) The heatmap indicated 17 differently expressed miRNAs between RPs, TPs, and HC groups. (C) We depicted five miRNAs expression variations in TPs and RPs at 1, 6, and 12 months. (D–F) The GO terms interpretation for the functions of these 208 differential miRNAs. (G) The KEGG terms interpretation for the functions of these 208 differential miRNAs. (H) The miRNA target interaction regulatory network form GO terms. (I) The miRNA target interaction regulatory network form KEGG terms.
Figure 5
Figure 5
Weighted Co-Expression Network Construction and identification of key modules. (A) Clustering dendrogram of 35 samples with trait heatmap. (B) Determination of soft-threshold power in the WGCNA. (C) Merged module tree of miRNAs, with dissimilarity based on the topological overlap, together with assigned module colors. (D) Heatmap of the correlation between the module eigengenes and clinical traits of HIV. Brown and blue modules were selected for further analysis.
Figure 6
Figure 6
The GO and KEGG enrichment analysis interpretation for the functions of the brown module. (A-C) The GO terms interpretation for the functions of these 208 differential miRNAs. (D) The KEGG terms interpretation for the functions of these 208 differential miRNAs.
Figure 7
Figure 7
The GO and KEGG enrichment analysis interpretation for the functions for the blue module. (A–C) The GO terms interpretation for the functions of these 208 differential miRNAs. (D) The KEGG terms interpretation for the functions of these 208 differential miRNAs.
Figure 8
Figure 8
The target interaction regulatory network diagram of transcriptional factors (TF) and miRNAs of the brown module (A) and blue module (B).
Figure 9
Figure 9
The mean intensity of six differential Exosomes membrane biomarkers. (A) The result of mass cytometry. (B) Quantification of the mean intensity. **p < 0.01, ***p < 0.001.
Figure 10
Figure 10
The correlation between exosome surface proteins and miRNAs. (A) The scatter plot of exosome surface proteins and miRNAs. (B) Exosomal miRNAs and surface proteins target the interaction regulatory network diagram.

References

    1. Fisher JD, Fisher WA. Changing AIDS-risk behavior. Psychol Bull (1992) 111:455–74. doi: 10.1037/0033-2909.111.3.455 - DOI - PubMed
    1. Sharp PM, Hahn BH. Origins of HIV and the AIDS pandemic. Cold Spring Harb Perspect Med 1 (2011) 1(1):a006841. doi: 10.1101/cshperspect.a006841 - DOI - PMC - PubMed
    1. Nyamweya S, Hegedus A, Jaye A, Rowland-Jones S, Flanagan KL, Macallan DC. Comparing HIV-1 and HIV-2 infection: Lessons for viral immunopathogenesis. Rev Med Virol (2013) 23:221–40. doi: 10.1002/rmv.1739 - DOI - PubMed
    1. Zhao G, Perilla JR, Yufenyuy EL, Meng X, Chen B, Ning J, et al. . Mature HIV-1 capsid structure by cryo-electron microscopy and all-atom molecular dynamics. Nature (2013) 497:643–6. doi: 10.1038/nature12162 - DOI - PMC - PubMed
    1. Gao F, Bailes E, Robertson DL, Chen Y, Rodenburg CM, Michael SF, et al. . Origin of HIV-1 in the chimpanzee pan troglodytes troglodytes. Nature (1999) 397:436–41. doi: 10.1038/17130 - DOI - PubMed