. 2022 Aug 11:13:960738.
doi: 10.3389/fimmu.2022.960738. eCollection 2022.

Prediction of prognosis, immunogenicity and efficacy of immunotherapy based on glutamine metabolism in lung adenocarcinoma

Affiliations

Prediction of prognosis, immunogenicity and efficacy of immunotherapy based on glutamine metabolism in lung adenocarcinoma

Jichang Liu et al. Front Immunol. .

Abstract

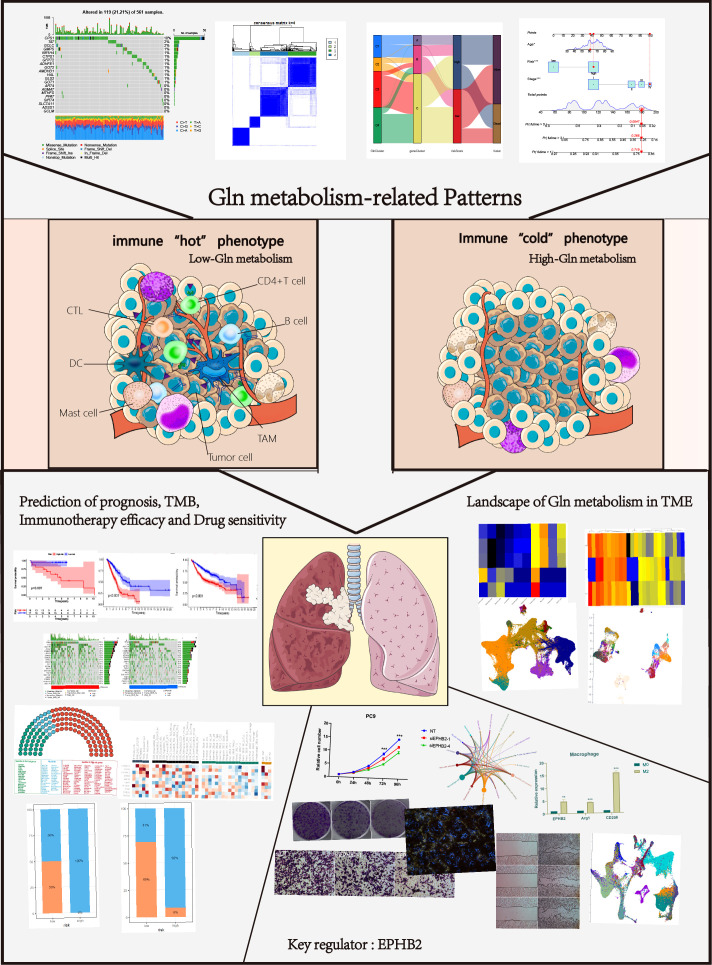
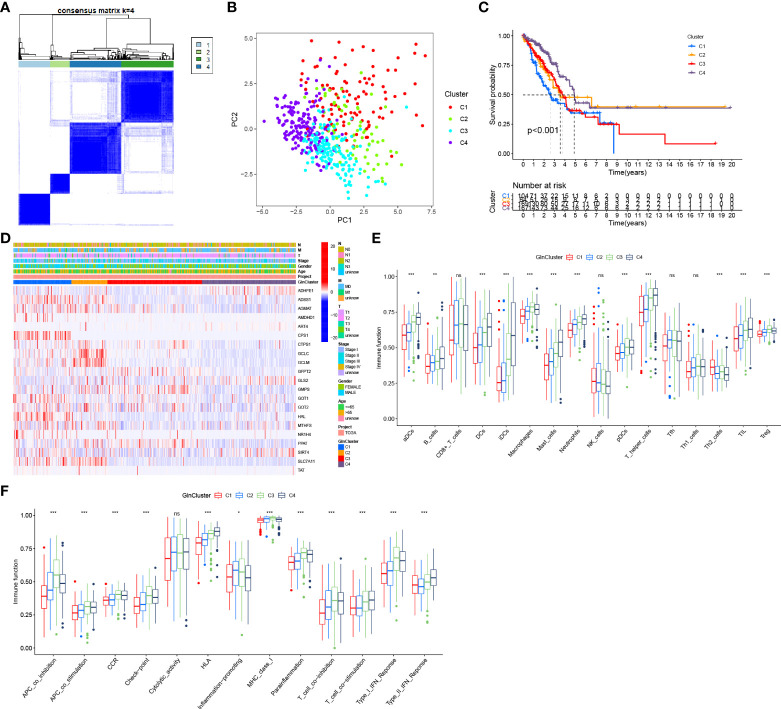
Background: Glutamine (Gln) metabolism has been reported to play an essential role in cancer. However, a comprehensive analysis of its role in lung adenocarcinoma is still unavailable. This study established a novel system of quantification of Gln metabolism to predict the prognosis and immunotherapy efficacy in lung cancer. Further, the Gln metabolism in tumor microenvironment (TME) was characterized and the Gln metabolism-related genes were identified for targeted therapy.

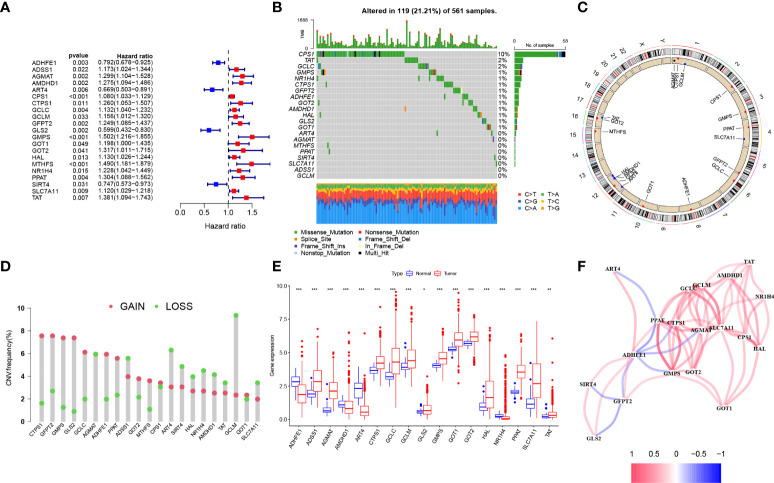
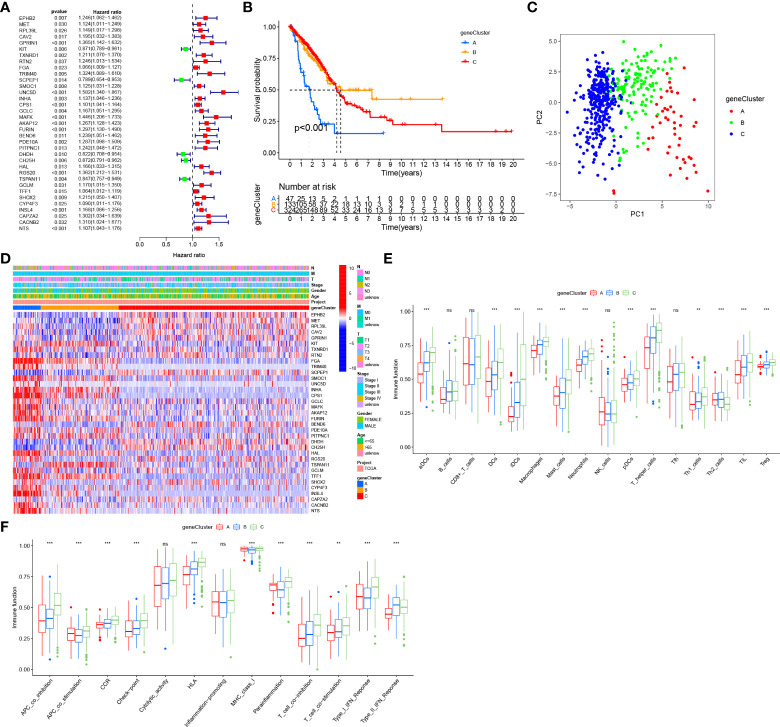
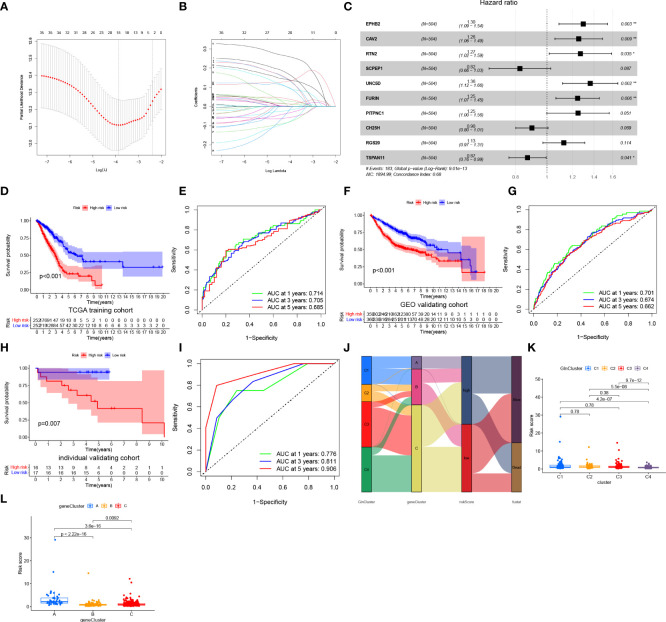
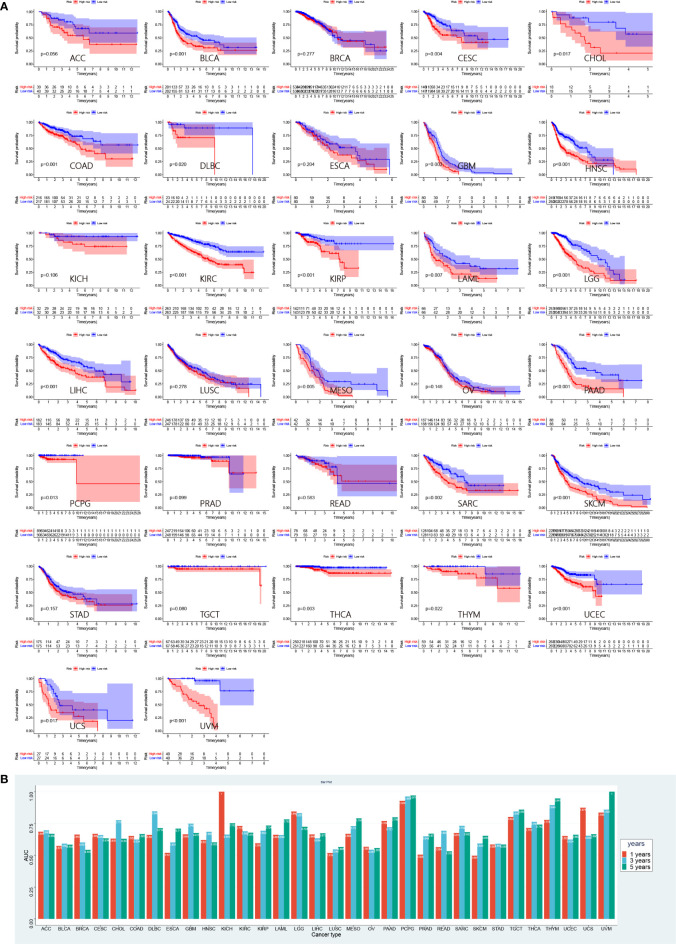
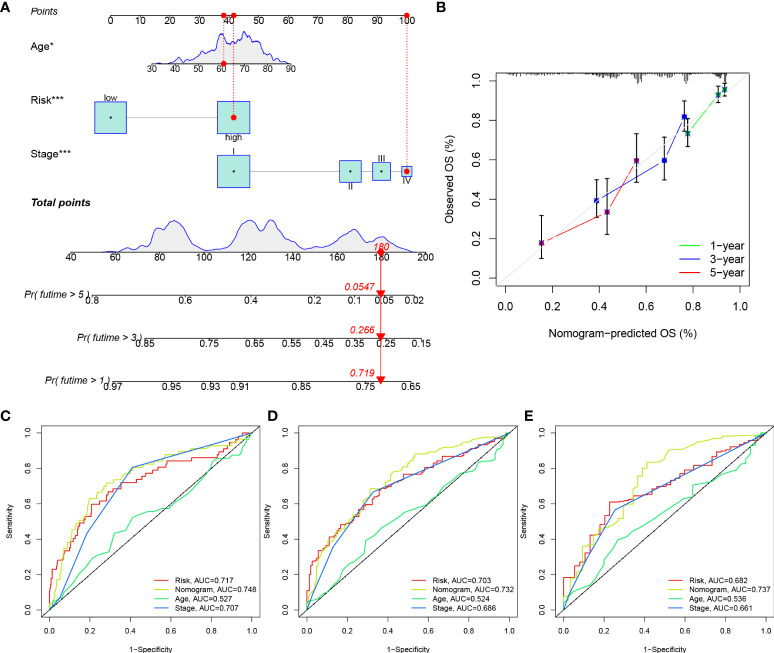
Methods: We comprehensively evaluated the patterns of Gln metabolism in 513 patients diagnosed with lung adenocarcinoma (LUAD) based on 73 Gln metabolism-related genes. Based on differentially expressed genes (DEGs), a risk model was constructed using Cox regression and Lasso regression analysis. The prognostic efficacy of the model was validated using an individual LUAD cohort form Shandong Provincial Hospital, an integrated LUAD cohort from GEO and pan-cancer cohorts from TCGA databases. Five independent immunotherapy cohorts were used to validate the model performance in predicting immunotherapy efficacy. Next, a series of single-cell sequencing analyses were used to characterize Gln metabolism in TME. Finally, single-cell sequencing analysis, transcriptome sequencing, and a series of in vitro experiments were used to explore the role of EPHB2 in LUAD.

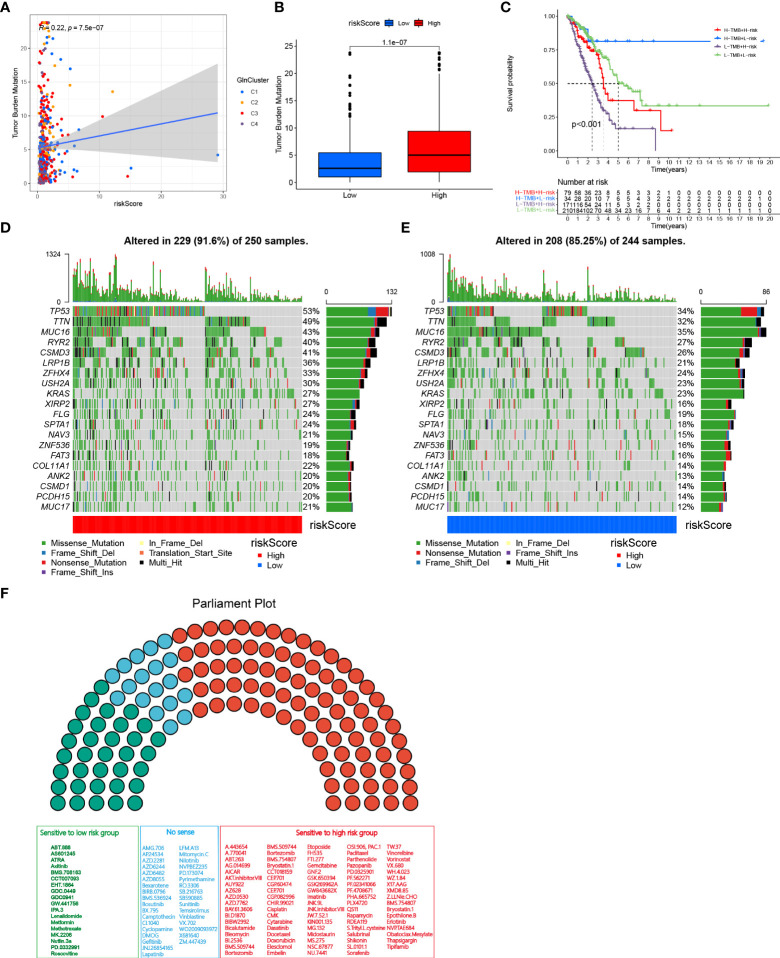
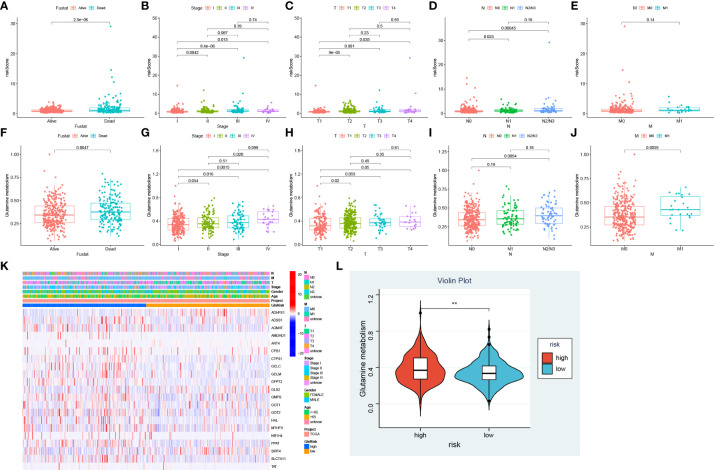
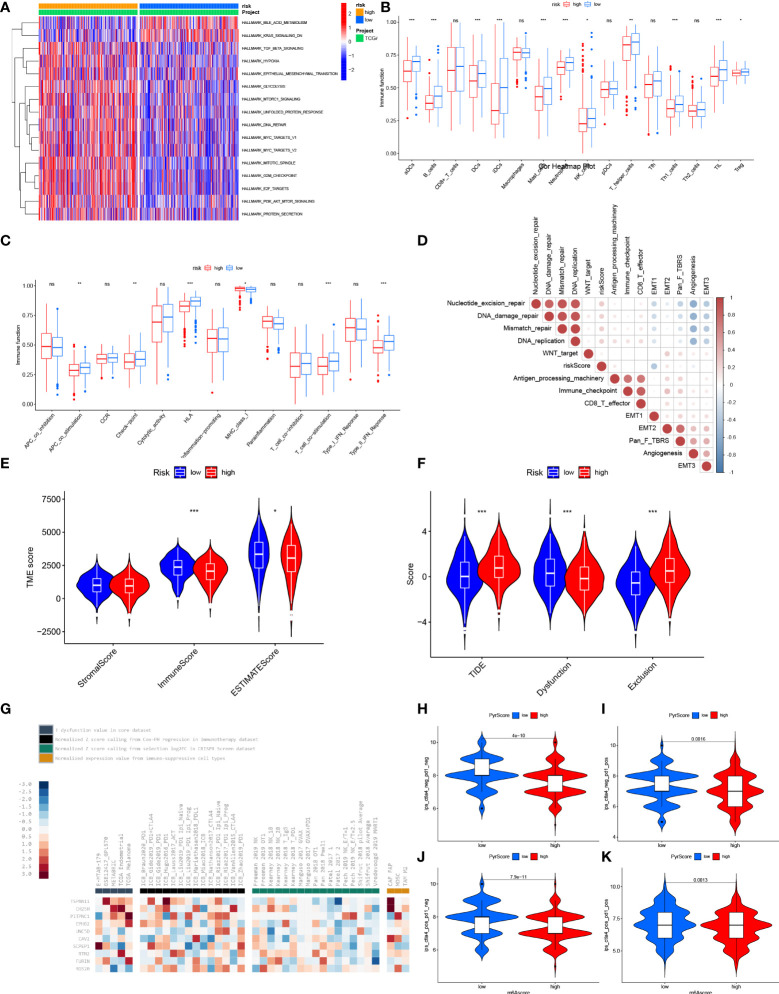
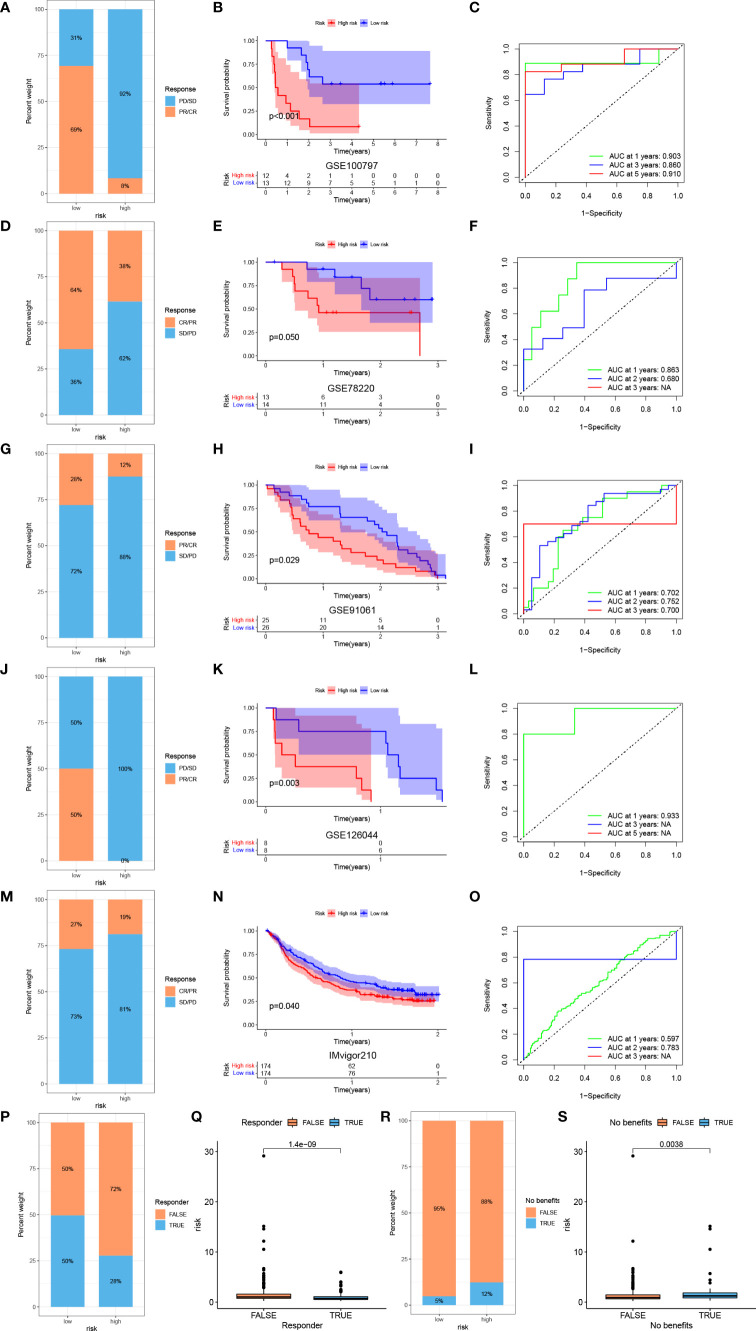
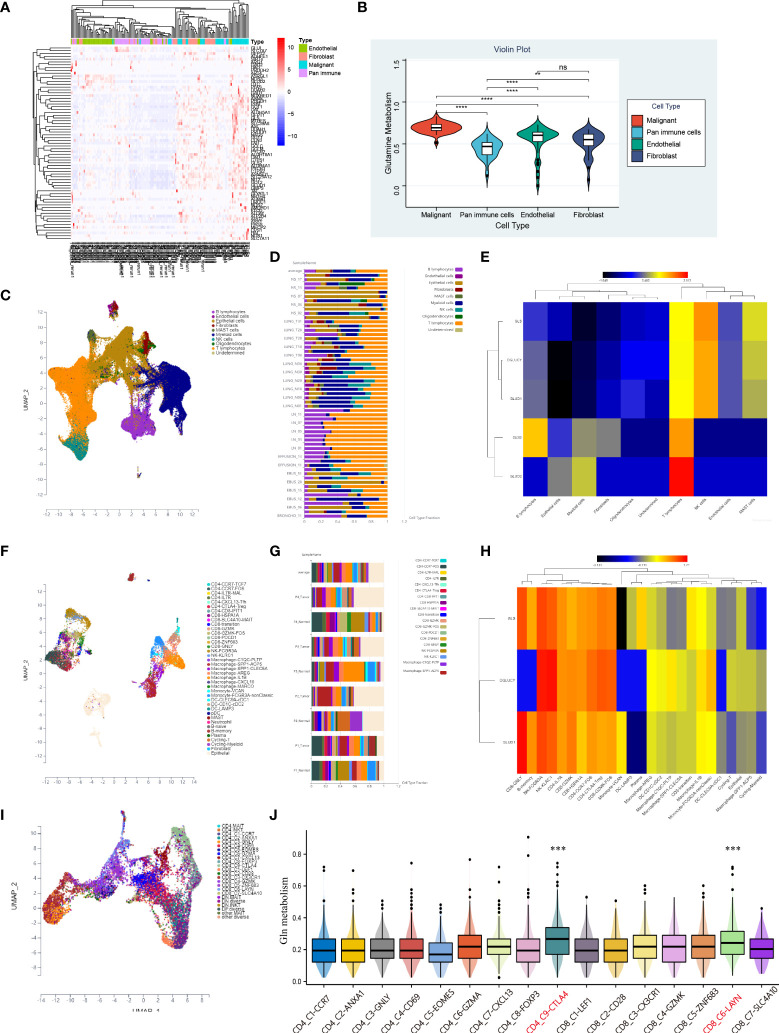
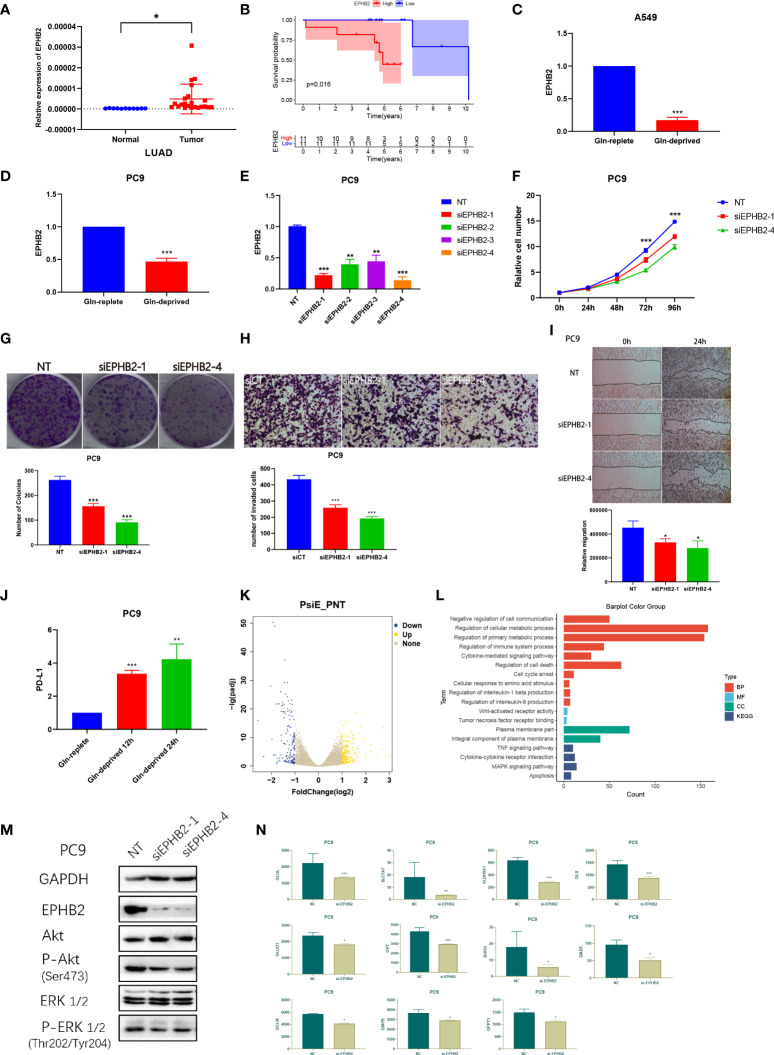
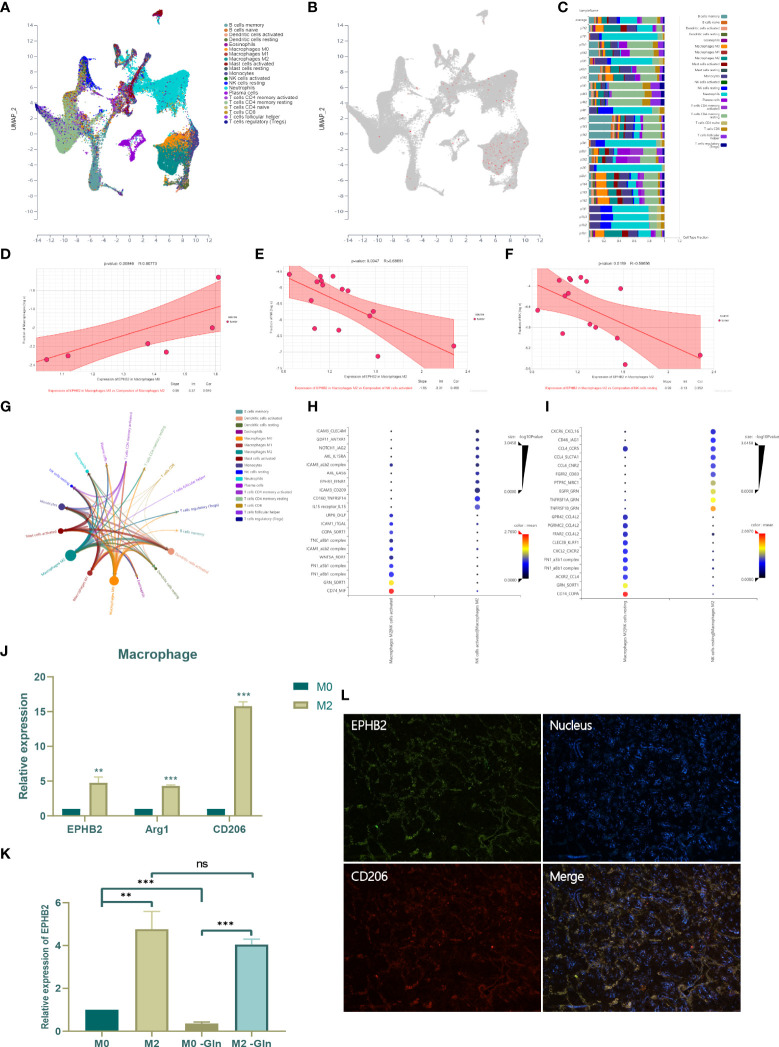
Results: Patients with LUAD were eventually divided into low- and high-risk groups. Patients in low-risk group were characterized by low levels of Gln metabolism, survival advantage, "hot" immune phenotype and benefit from immunotherapy. Compared with other cells, tumor cells in TME exhibited the most active Gln metabolism. Among immune cells, tumor-infiltrating T cells exhibited the most active levels of Gln metabolism, especially CD8 T cell exhaustion and Treg suppression. EPHB2, a key gene in the model, was shown to promote LUAD cell proliferation, invasion and migration, and regulated the Gln metabolic pathway. Finally, we found that EPHB2 was highly expressed in macrophages, especially M2 macrophages. It may be involved in the M2 polarization of macrophages and mediate the negative regulation of M2 macrophages in NK cells.

Conclusion: This study revealed that the Gln metabolism-based model played a significant role in predicting prognosis and immunotherapy efficacy in lung cancer. We further characterized the Gln metabolism of TME and investigated the Gln metabolism-related gene EPHB2 to provide a theoretical framework for anti-tumor strategy targeting Gln metabolism.

Keywords: EphB2; glutamine metabolism; immunotherapy; lung adenocarcinoma; prognosis; tumor microenvironment.


Conflict of interest statement

The authors declare that the research was conducted in the absence of any commercial or financial relationships that could be construed as a potential conflict of interest.

Figures

Figure 1
Figure 1
Analysis workflow of this study.
Figure 2
Figure 2
Genetic and transcriptional alterations of Gln metabolism regulators in LUAD. (A) Prognosis-related Gln metabolism regulators after uniCox regression analysis. (B) 119 of the 561 LUAD patients showed genetic alterations of prognosis-related Gln metabolism regulators. (C) The location of CNV alterations of prognosis-related Gln metabolism regulators on chromosomes. (D) CNV mutation was widespread in 21 prognosis-related Gln metabolism regulators. The column represented the alteration frequency. Deletion, green dot; Amplification, pink dot. (E) Differential mRNA expression of prognosis-related Gln metabolism regulators between normal and tumor samples (*P < 0.05; **P < 0.01; ***P < 0.001). (F) Correlation network between prognosis-related Gln metabolism regulators.
Figure 3
Figure 3
Distinct Gln metabolism-related patterns. (A) Consensus clustering matrix for k = 4. (B) Principal component analysis (PCA) for the transcriptome profiles of four clusters. (C) Survival analyses for four different clusters based on 513 LUAD patients from TCGA. (D) Heatmap of prognosis-related Gln metabolism regulators in four clusters. (E) The abundance of tumor infiltrating immune cells in four clusters. (F) The difference of immune functions between four clusters. "*” means that p < 0.05; “**” means that p < 0.01; "“***” means that p < 0.001; ns, no significance.
Figure 4
Figure 4
Construction of gene clusters based on DEGs. (A) Univariate cox regression analysis of DEGs. (B) Survival analyses for the three gene clusters based on the prognosis-related DEGs. (C) PCA for the transcriptome profiles of three gene clusters. (D) Expression of prognosis-related DEGs in three gene clusters. (E) The abundance of tumor infiltrating immune cells in three gene clusters. (F) The difference of immune functions between three gene clusters. “**” means that p < 0.01; "“***” means that p < 0.001; ns, no significance.
Figure 5
Figure 5
Construction and validation of a prognostic risk model. (A, B) Lasso regression analysis of prognosis-related DEGs. (C) Multivariate Cox regression analysis. (D) Survival analyses for low- and high-risk group in training cohort. (E) ROC curves of predicting prognosis in training cohort. (F) Survival analyses for low- and high-risk group in GEO validating cohort. (G) ROC curves of predicting prognosis in GEO validating cohort. (H) Survival analyses for low- and high-risk group in individual validating cohort. (I) ROC curves of predicting prognosis in individual validating cohort. (J) Alluvial diagram showing the relationships of survival status, Gln clusters, gene clusters and risk score. (K) The distribution of risk score in different clusters. (L) The distribution of risk score in different gene clusters. "*” means that p < 0.05; “**” means that p < 0.01.
Figure 6
Figure 6
TMB and drug susceptibility analysis. (A) Correlation analysis between risk score and TMB. (B) Difference between low and high-risk group. (C) Kaplan–Meier curves show overall survival differences stratified by TMB and risk score (p < 0.001). Visualization of gene mutations in high-risk group (D) and low-risk group (E). (F) Drug sensitivity analyses between low-and high-risk groups. Green, sensitive to patients with low risk scores; Red, sensitive to patients with high risk scores; Blue, no sense.
Figure 7
Figure 7
Association between Gln metabolism, risk scores and clinical characteristics. Difference of risk score between different survival status (A), stages (B), T stages (C), N stages (D), and M stages (E). Level of Gln metabolism in different survival status (F), stages (G), T stages (H), N stages (I), and M stages (J). (K) Expression of Gln metabolism regulators between low- and high-risk groups. (L) Difference of Gln metabolism level between low- and high-risk groups. " **” means that p < 0.01.
Figure 8
Figure 8
Characteristic of TME between low- and high-risk group. (A) GSVA enrichment analyses based on the Hallmarker gene sets showed the states of biological processes in low- and high- risk groups. (B) The abundance of tumor infiltrating immune cells in low- and high-risk groups. (C) The difference of immune functions between low- and high-risk groups. (D) Correlation between risk score and tumor-related functions. (E) Differences of ESTIMATE score, stromal score and immune score between low- and high- risk score. (F) Differences of T cell dysfunction, exclusion and TIDE in low- and high-risk score. (G) Enrichment of 10 selected genes in T cell dysfunction level, ICB response outcome, phenotypes in genetic screens and cell types promoting T cell exclusion. Difference of IPS with CTLA4- and PD-1- (H), CTLA4- and PD-1+ (I), CTLA4+ and PD-1 (J) and CTLA4+ and PD-1+ (K) between low- and high-risk group. "*” means that p < 0.05; “**” means that p < 0.01; "“***” means that p < 0.001; ns, no significance.
Figure 9
Figure 9
Prediction of immunotherapy efficacy by the risk model. Response to ACT (A), survival analyses (B) and ROC curves of predicting prognosis (C) between low- and high-risk groups in melanoma cohort (GSE100797). Response to anti-PD-1 therapy (D), survival analyses (E) and ROC curves of predicting prognosis (F) between low- and high-risk groups in melanoma cohort (GSE78220). Response to anti-CTLA4 and ant-PD1 therapy (G), survival analyses (H) and ROC curves of predicting prognosis (I) between low- and high-risk groups in melanoma cohort (GSE91061). Response to anti-PD-1 therapy (J), survival analyses (K) and ROC curves of predicting prognosis (L) between low- and high-risk groups in NSCLC cohort (GSE126044). Response to anti-PD-L1 therapy (M), survival analyses (N) and ROC curves of predicting prognosis (O) between low- and high-risk groups in advanced urothelial cancer cohort (IMvigor210 cohort). (P) Difference of responder between low- and high-risk group of LUAD in TCGA. (Q) Difference of risk score between responder and non-responder of LUAD in TCGA. (R) Difference of benefits between low- and high-risk group of LUAD in TCGA. (S) Difference of risk score between benefit and no benefit of LUAD in TCGA.
Figure 10
Figure 10
Prognostic validation of risk score in pan-cancer. (A) Survival analyses between low- and high-risk group in 32 pan-caner cohorts of TCGA. (B) Corresponding AUC values in 32 pan-cancer cohorts.
Figure 11
Figure 11
Construction of a nomogram. (A) Construction of a nomogram based on risk, age and stage. (B) Calibration curves of the nomogram in predicting OS of TCGA-LUAD patients. ROC curves of the nomogram, risk, stage and age in predicting 1 year- (C), 3 years- (D) and 5 years- (E) OS of TCGA-LUAD patients.
Figure 12
Figure 12
Characteristic of Gln metabolism in TME. (A) Expression of identified Gln metabolism regulators in malignant cells, endothelial cells, fibroblasts and pan-immune cells. (B) Difference of Gln metabolism levels in malignant cells, endothelial cells, fibroblasts and pan-immune cells. (C) The distribution of immune cell clusters in UMAP plot of GSE131907. (D) Cell type fraction of each sample in GSE131907. (E) Expression of key Gln metabolism regulators in immune cells of GSE131907. (F) The distribution of immune cell clusters in UMAP plot of GSE117570. (G) Cell type fraction of each sample in GSE117570. (H) Expression of key Gln metabolism regulators in immune cells of GSE117570. (I) The distribution of T cell clusters in UMAP plot. (J) Level of Gln metabolism in 16 distinct T cells. “**” means that p < 0.01; "“***” means that p < 0.001; ****” means that p < 0.0001; no significance.
Figure 13
Figure 13
EPHB2 affects the biological behaviors of LUAD cells in vitro. (A) Expression of EPHB2 in normal and tumor specimens. (B) Survival analyses between low and high EPHB2 groups in LUAD cohorts. Expression of EPHB2 with treatment of Gln-replete and Gln-deprived in A549 cell line (C) and PC-9 cell line (D). (E) QRT-PCR was performed to detect the efficiency of EPHB2-siRNA transfection. (F) Growth curves of PC-9 cells treated with EPHB2 knockdown was developed using SRB assay. (G) Colony formation assay was conducted to detect the proliferation of PC-9 cells. (H) Transwell assay was performed to detect the invasion of PC-9 cells with treatment of EPHB2 knockdown. (I) The cell migration of EPHB2 knockdown was detected by wound healing assay in PC-9 cells. (J) Expression of PD-L1 with treatment of Gln-replete medium, Gln-deprived medium for 12h and Gln-deprived medium for 24h. (K) A volcano map to exhibit differential expressed genes between normal and EPHB2 knockdown treated PC-9 cells. (L) GO and KEGG enrichment analysis between normal and EPHB2 knockdown treated PC-9 cells after sequencing. (M) GAPDH, EPHB2, AKT, P-AKT (Ser473), ERK1/2, P-ERK1/2 (Thr202/Tyr204) were detected by western blotting in EPHB2 knockdown treated PC-9 cells. (N) Expression of key Gln metabolism regulators in normal and si-EPHB2 treated PC-9 cells. "*” means that p < 0.05; “**” means that p < 0.01; "“***” means that p < 0.001.
Figure 14
Figure 14
Effect of EPHB2 on infiltrating immune cells of TME. (A) The distribution of immune cell clusters in UMAP plot. (B) The expression of EPHB2 in distinct clusters of immune cells. (C) Cell type fraction of each sample. (D) Correlation analysis between expression of EPHB2 in macrophages M0 and composition of infiltrating macrophages M2. Correlation analysis between expression of EPHB2 in macrophages M2 and composition of infiltrating activated NK cells (E) and resting NK cells (F). (G) Correlation network between tumor infiltrating immune cells. (H) The ligand-receptor interaction between macrophages M2 and activated NK cells. (I) The ligand-receptor interaction between macrophages M2 and resting NK cells. (J) Expression of EPHB2 and macrophages M2 markers in macrophages M0 and M2. (K) Expression of EPHB2 in normal macrophages M0, M2 and Gln-deprived macrophages M0, M2. (L) Co-localization between EPHB2 and CD206 detected by IF in LUAD specimen. “**” means that p < 0.01; "“***” means that p < 0.001; ns, no significance.

Similar articles

Cited by

References

    1. Bray F, Ferlay J, Soerjomataram I, Siegel R, Torre L, Jemal A. Global cancer statistics 2018: GLOBOCAN estimates of incidence and mortality worldwide for 36 cancers in 185 countries. CA: Cancer J Clin (2018) 68(6):394–424. doi: 10.3322/caac.21492 - DOI - PubMed
    1. Sivakumar S, Lucas F, McDowell T, Lang W, Xu L, Fujimoto J, et al. . Genomic landscape of atypical adenomatous hyperplasia reveals divergent modes to lung adenocarcinoma. Cancer Res (2017) 77(22):6119–30. doi: 10.1158/0008-5472.CAN-17-1605 - DOI - PMC - PubMed
    1. Topalian S, Taube J, Anders R, Pardoll D. Mechanism-driven biomarkers to guide immune checkpoint blockade in cancer therapy. Nat Rev Cancer (2016) 16(5):275–87. doi: 10.1038/nrc.2016.36 - DOI - PMC - PubMed
    1. Topalian S, Hodi F, Brahmer J, Gettinger S, Smith D, McDermott D, et al. . Safety, activity, and immune correlates of anti-PD-1 antibody in cancer. The New Eng J Med. (2012) 366(26):2443–54. doi: 10.1056/NEJMoa1200690 - DOI - PMC - PubMed
    1. Vander Heiden M, DeBerardinis R. Understanding the intersections between metabolism and cancer biology. Cell (2017) 168(4):657–69. doi: 10.1016/j.cell.2016.12.039 - DOI - PMC - PubMed

Publication types