. 2022 Jul 27;13(8):4414-4428.
doi: 10.1364/BOE.463057. eCollection 2022 Aug 1.

Ultrathin, high-speed, all-optical photoacoustic endomicroscopy probe for guiding minimally invasive surgery

Affiliations

Ultrathin, high-speed, all-optical photoacoustic endomicroscopy probe for guiding minimally invasive surgery

Tianrui Zhao et al. Biomed Opt Express. .

Abstract

Photoacoustic (PA) endoscopy has shown significant potential for clinical diagnosis and surgical guidance. Multimode fibres (MMFs) are becoming increasingly attractive for the development of miniature endoscopy probes owing to their ultrathin size, low cost and diffraction-limited spatial resolution enabled by wavefront shaping. However, current MMF-based PA endomicroscopy probes are either limited by a bulky ultrasound detector or a low imaging speed that hindered their usability. In this work, we report the development of a highly miniaturised and high-speed PA endomicroscopy probe that is integrated within the cannula of a 20 gauge medical needle. This probe comprises a MMF for delivering the PA excitation light and a single-mode optical fibre with a plano-concave microresonator for ultrasound detection. Wavefront shaping with a digital micromirror device enabled rapid raster-scanning of a focused light spot at the distal end of the MMF for tissue interrogation. High-resolution PA imaging of mouse red blood cells covering an area 100 µm in diameter was achieved with the needle probe at ∼3 frames per second. Mosaicing imaging was performed after fibre characterisation by translating the needle probe to enlarge the field-of-view in real-time. The developed ultrathin PA endomicroscopy probe is promising for guiding minimally invasive surgery by providing functional, molecular and microstructural information of tissue in real-time.


Conflict of interest statement

The authors declare that they have no known competing financial interests or personal relationships. T.V. is co-founder and shareholder of Hypervision Surgical Ltd, London, UK. He is also a shareholder of Mauna Kea Technologies, Paris, France. P.B. and E.Z. are shareholders in DeepColor Imaging SAS.

Figures

Fig. 1.
Fig. 1.
Illustration of the photoacosutic endomicroscopy imaging system. (a)Schematic diagram of the experimental setup. L1-4, achromatic doublet lenses; DMD: digital micromirror device; US, ultrasound; Obj1-2: Objective lenses; BS: beamsplitters; PC: personal computer; DAQ: data acquisition. (b) A photo of the imaging probe integrated within a spinal needle (20 gauge). The needle has an outer diameter of 0.9 mm and an inner diameter of 0.6 mm. (c) A microscopy image of the needle tip region.
Fig. 2.
Fig. 2.
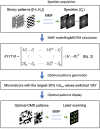
Flowchart illustration of the principle and process of MMF characterisation and subsequent raster scanning of a focused laser beam at its distal end for endomicroscopy imaging.
Fig. 3.
Fig. 3.
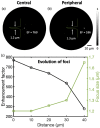
Focusing performance through a multimode fibre. (a) An example of foci at central region of the fibre tip. Inset is the intensity profile across the centre of the focus indicating that the diameter of the focus is 1.2 μ m. (b) An example of foci at peripheral region of the fibre tip. Inset is the intensity profile across the centre of the focus indicating that the diameter of the focus is 1.3 μ m. (c) The evolution of enhancement factor (EF) and size of laser foci with varying radial distances to the centre of the fibre tip.
Fig. 4.
Fig. 4.
Characterisation of a received photoacoustic signal. (a) A representative photoacoustic signal generated from a carbon fibre and acquired by the fibre-optic microresonator ultrasound sensor (before and after frequency filtering). The full width at half maximum of the signal was mapped to a distance of 53 μ m. (b) Frequency spectra of the photoacoustic signal before and after frequency filtering.
Fig. 5.
Fig. 5.
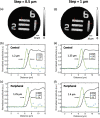
Characterisation of lateral resolution. (a) Photoacoustic maximum-intensity-projection image of a resolution target with a scanning step of 0.5 μ m. (b) and (c) are edge spread functions (ESF) and line spread functions (LSF) obtained along the red lines in (a) at central and peripheral regions, respectively. (d) Photoacoustic maximum-intensity-projection image of the same sample with a scanning step of 1 μ m. (e) and (f) are ESF and LSF obtained along the red lines in (d) at central and peripheral regions, respectively. Note that 10 adjacent lines from (a) and 5 ones from (d) were summed to suppress noise, while only one of the profiles taken across the edge of the resolution target is shown.
Fig. 6.
Fig. 6.
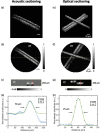
Characterisation of axial resolution. (a) Volumatric rendering of a carbon fibre phantom with acoustic sectioning (Visualization from multiple views is shown in Visualization 1). (b) Photoacoustic maximum-intensity-projection image of the phantom with acoustic sectioning. (c) The cross-section plane along the dash green line in (b). (d) The edge spread function across the red line in (c). (e) Volumatric rendering of a carbon fibre phantom with optical sectioning (Visualization from multiple views is shown in Visualization 2). (f) Photoacoustic maximum-intensity-projection image of the phantom at one focal plane. (g) The cross-section plane along the dash green line in (f). (h) The edge spread function across the red line in (g). D, diameter; ESP, edge spread function.
Fig. 7.
Fig. 7.
Three-dimension photoacoustic endomicroscopy imaging of ex vivo mouse blood cells with optical sectioning. (a) Optical microscopy of a mouse blood smear sample. (b) Slices through the optical sectioning planes within a range of 20 μ m with an interval of 5 μ m. (c) An example of volumetric rendering of a single red blood cell. Visualization from different views of the same cell is shown in Visualization 3.
Fig. 8.
Fig. 8.
Mosaicing imaging of a mouse blood smear sample over an area of 100 μ m × 250 μ m (Visualization 4). Each single frame covers an area with a diametre of 100 μ m with a raster-scanning step size of 1 μ m.

References

    1. Wang T. D., Van Dam J., “Optical biopsy: a new frontier in endoscopic detection and diagnosis,” Clin. Gastroenterol. Hepatol. 2(9), 744–753 (2004).10.1016/S1542-3565(04)00345-3 - DOI - PMC - PubMed
    1. Gora M. J., Suter M. J., Tearney G. J., Li X., “Endoscopic optical coherence tomography: technologies and clinical applications,” Biomed. Opt. Express 8(5), 2405–2444 (2017).10.1364/BOE.8.002405 - DOI - PMC - PubMed
    1. Mavadia J., Xi J., Chen Y., Li X., “An all-fiber-optic endoscopy platform for simultaneous oct and fluorescence imaging,” Biomed. Opt. Express 3(11), 2851–2859 (2012).10.1364/BOE.3.002851 - DOI - PMC - PubMed
    1. Beard P., “Biomedical photoacoustic imaging,” Interface focus 1(4), 602–631 (2011).10.1098/rsfs.2011.0028 - DOI - PMC - PubMed
    1. Ntziachristos V., Razansky D., “Molecular imaging by means of multispectral optoacoustic tomography (MSOT),” Chem. Rev. 110(5), 2783–2794 (2010).10.1021/cr9002566 - DOI - PubMed

LinkOut - more resources