. 2022 Aug 10:12:928357.
doi: 10.3389/fonc.2022.928357. eCollection 2022.

Molecular and pathological subtypes related to prostate cancer disparities and disease outcomes in African American and European American patients

Affiliations

Molecular and pathological subtypes related to prostate cancer disparities and disease outcomes in African American and European American patients

Joakin O Mori et al. Front Oncol. .

Abstract

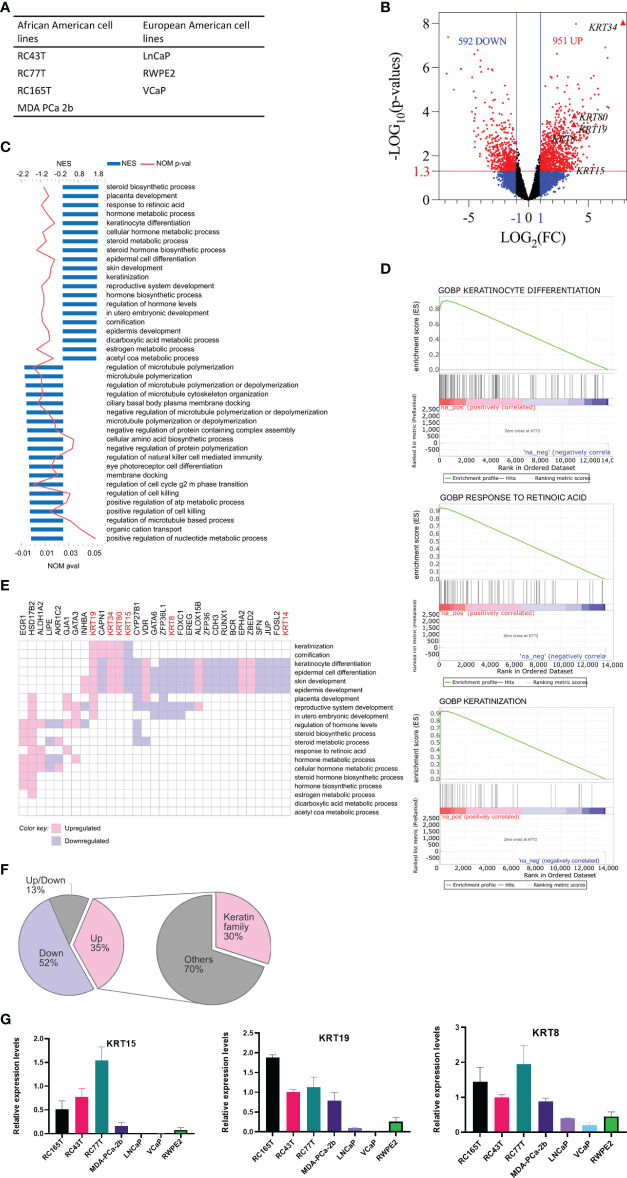
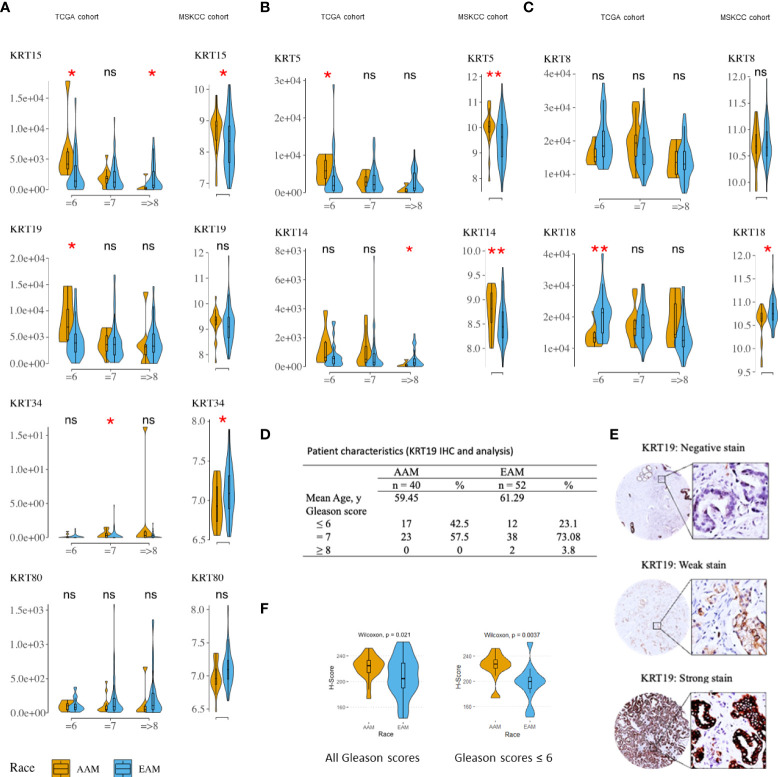
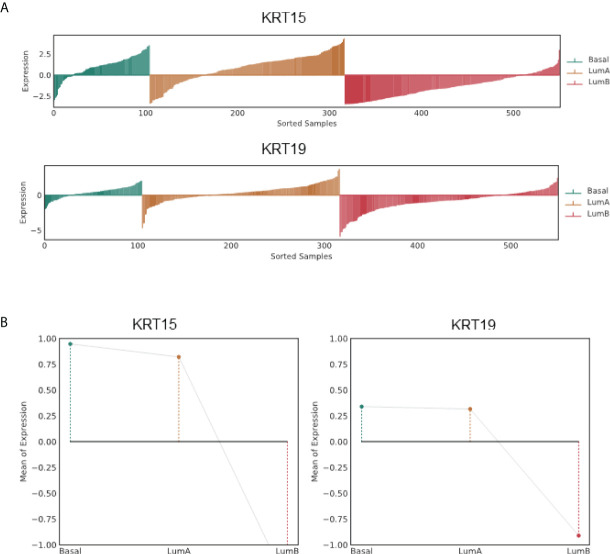
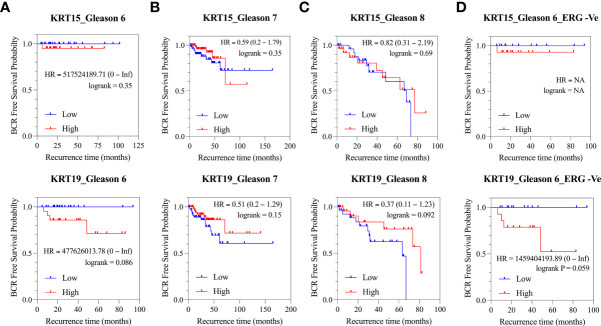
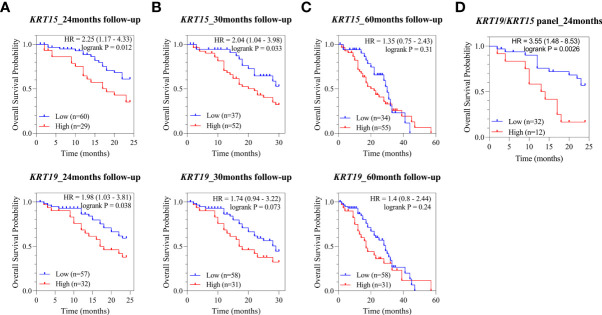
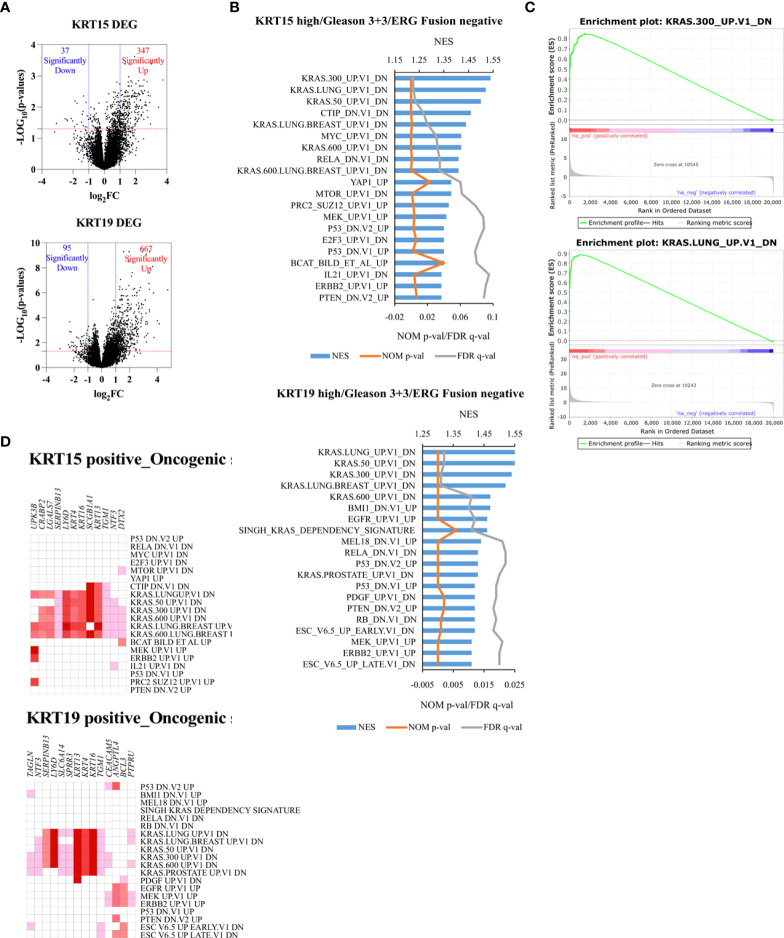
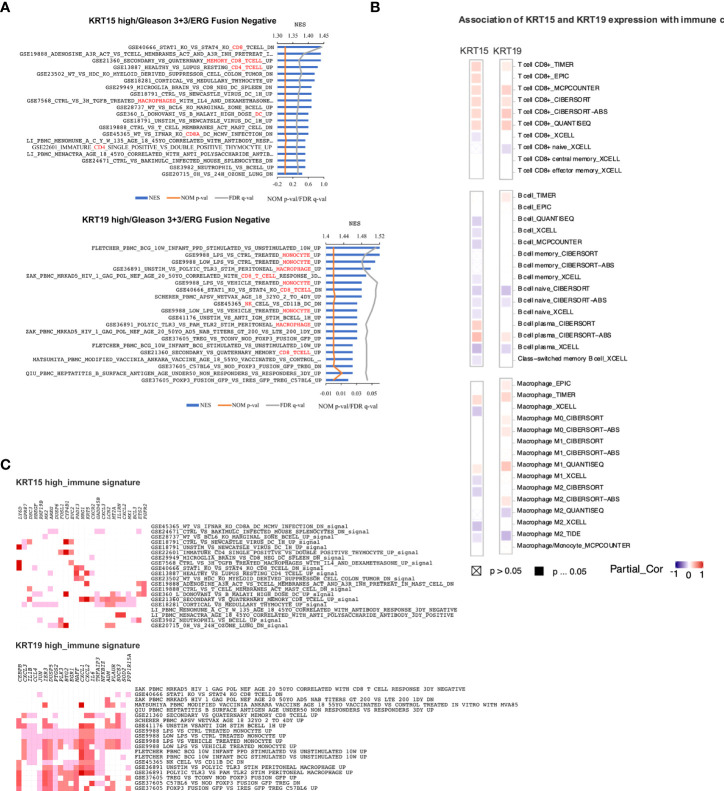
Prostate cancer (PCa) disproportionately affects African American (AA) men, yet present biomarkers do not address the observed racial disparity. The objective of this study was to identify biomarkers with potential benefits to AA PCa patients. Differentially expressed genes (DEG) analysis coupled with gene set enrichment analysis (GSEA) and leading-edge genes analysis showed that the keratin family of genes, including KRT8, KRT15, KRT19, KRT34, and KRT80, constituted the single most prominent family of genes enriched in AA compared to European American (EA) PCa cell lines. In PCa patients (TCGA and MSKCC patient cohorts), KRT8, KRT15, and KRT19 expression were relatively higher in AA than in EA patients. The differences in the expression of KRT15 and KRT19, but not KRT8, were enhanced by Gleason score and ERG fusion status; in low Gleason (Gleason ≤ 6 [TCGA cohort] and Gleason ≤ 7 [MSKCC cohort]), the expression of KRT15 and KRT19 was significantly (p ≤ 0.05) higher in AA than in EA patients. Survival analysis revealed that high expression of KRT15 and KRT19 was associated with increased risk of biochemical recurrence in low Gleason category patients in the TCGA patient cohort. Interestingly, KRT15 and KRT19 expression were also associated with an increased risk of death in the metastatic prostate adenocarcinoma cohort, suggesting the potential to predict the risks of disease recurrence and death in the low Gleason category and advanced disease conditions respectively. Gene set enrichment analysis revealed known oncogenic gene signatures, including KRAS and ERBB2, to be enriched in patients expressing high KRT15 and KRT19. Furthermore, high KRT15 and KRT19 were linked to the basal and LumA PCa subtypes, which are associated with poor postoperative androgen deprivation therapy (ADT) response compared to the LumB subtype. Taken together, the present study identifies genes with high expression in AA than in EA PCa. The identified genes are linked to oncogenic gene signatures, including KRAS and ERBB2, and to basal and LumA PCa subtypes that are associated with poor postoperative ADT response. This study, therefore, reveals biomarkers with the potential to address biomarker bias in PCa risk stratification and/or prognosis.

Keywords: cancer disparities; molecular subtype classification; oncogenic pathways; prognosis; prostate cancer.


Conflict of interest statement

CY is a shareholder in Riptide biosciences and is a consultant in QED Therapeutics, Riptide Biosciences, and Amgen. The remaining authors declare that the research was conducted in the absence of any commercial or financial relationships that could be construed as a potential conflict of interest.

Figures

Figure 1
Figure 1
Analysis of differentially expressed genes (DEG) between AA and EA PCa cell lines. (A) AA and EA PCa cell lines. (B) volcano plots of DEGs; genes were differentially expressed if FC ≥ 2 (LOG2(FC) ≥ 1) and p ≤ 0.05 (-LOG10P = 1.3). (C) GOBP (gene ontology biological processes) gene sets enriched in AA PCa cell lines relative to EA PCa cell lines. (D) representative gene set enrichment plots. (E) leading-edge genes in top 20 positively enriched gene sets. (F) proportions of leading-edge genes; the keratin family of genes constituted the single most prominent family of DEGs enriched in AA. (G) Validation of RNA-seq data by RT-qPCR. The expression of selected DEGs in cancer cell lines quantified by qRT-PCR were shown.
Figure 2
Figure 2
Distribution and median expression levels of keratins in AA and EA PCa patients (TCGA [ERG fusion negative] and MSKCC cohorts). (A) differentially expressed keratins (excluding KRT8 – see C) in the TCGA (left column) and MSKCC (right column) cohorts. (B) basal cell keratins (KRT5 and KRT14). (C) luminal cell keratins (KRT8 and KRT18). Statistically significant differences in gene expression were determined using the nonparametric Wilcoxon-Mann-Whitney test: *p ≤ 0.05; **P ≤ 0.01. TCGA patients were stratified by Gleason (risk) categories; that is Gleason = 6 (low risk), Gleason = 7 (intermediate risk), and Gleason => 8 (high risk) categories. (D) Clinicopathological characteristics of prostate cancer patients in the deidentified prostate tumor cohort. (E) Immunohistochemical staining of KRT19 in prostate cancer tissues. Representative images of KRT19 negative, weak or strong staining. (F) boxplot of KRT19 H-Scores illustrating significant differences in AA Vs. EA prostate cancer patients. * P values < 0.05 were considered statistically significant. All the patients (upper panel) and patients with Gleason ≤6 (lower panel). ns, not significant.
Figure 3
Figure 3
Association of KRT15 and KRT19 expression with PCa subtypes in the TCGA PCa patient cohort. (A) Lollipop plots. (B) Lineplots of mean trends. All analyses were performed in PCTA (24) using the default setting.
Figure 4
Figure 4
Association of KRT15 and KRT19 expression with risk of BCR in PCa patients (TCGA cohort). (A) Gleason six patients’ category. (B) Gleason seven patients’ category. (C) Gleason 8+ patients’ category. (D) Gleason six and ERG fusion negative patients’ category.
Figure 5
Figure 5
Association of KRT15 and KRT19 expression with overall survival. (A) 24-months follow-up. (B) 30-months follow-up. (C) 60-months follow-up. (D) KRT15/KRT19 panel.
Figure 6
Figure 6
Unique oncogenic gene signature associated with KRT15 and KRT19 expression in ERG fusion negative and Gleason 3 + 3 patients. Patients were trichotomized by gene expression into T1 (low expression), and T3 (high expression), and differences in gene expression were determined in low versus high expression patients. (A) DEG in high versus low KRT15 and KRT19 expression. (B) oncogenic gene sets positively enriched in high versus low KRT15 and KRT19 expression. (C) representative enrichment plots. (D) Leading-edge genes.
Figure 7
Figure 7
Immunogenic gene signatures associated with KRT15 and KRT19 expression in ERG fusion negative and Gleason 3 + 3 patients. (A) gene sets positively enriched in patients with high expression of KR15 (top) and KRT19 (bottom). (B) leading-edge genes associated with gene sets positively enriched in patients with high expression of KRT15 (top) and KRT19 (bottom). (C) immune cells infiltration associated with KRT15 and KRT19 expression. Squares with a cross indicate non-significant associations (p > 0.05), solid square indicates significant associations (p ≤ 0.05), and purple-red is association gradient (purple is for negative association and red for positive association).

Similar articles

Cited by

References

    1. Zavala VA, Bracci PM, Carethers JM, Carvajal-Carmona L, Coggins NB, Cruz-Correa MR, et al. . Cancer health disparities in racial/ethnic minorities in the United States. Br J Cancer. (2021) 124(2):315–32. doi: 10.1038/s41416-020-01038-6 - DOI - PMC - PubMed
    1. Magi-Galluzzi C, Tsusuki T, Elson P, Simmerman K, LaFargue C, Esgueva R, et al. . TMPRSS2-ERG gene fusion prevalence and class are significantly different in prostate cancer of caucasian, African-American and Japanese patients. Prostate. (2011) 71(5):489–97. doi: 10.1002/pros.21265 - DOI - PubMed
    1. Yu JJ, Yu JJ, Mani RS, Cao Q, Brenner CJ, Cao X, et al. . An integrated network of androgen receptor, polycomb, and TMPRSS2-ERG gene fusions in prostate cancer progression. Cancer Cell (2010) 17(5):443–54. doi: 10.1016/j.ccr.2010.03.018 - DOI - PMC - PubMed
    1. Farrell J, Young D, Chen Y, Cullen J, Rosner I, Kagan J, et al. . Predominance of ERG−negative high−grade prostate cancers in African American men. Mol Clin Oncol (2014) 2(6):982–6. doi: 10.3892/mco.2014.378 - DOI - PMC - PubMed
    1. Giri VN, Ruth K, Hughes L, Uzzo RG, Chen DYT, Boorjian SA, et al. . Racial differences in prediction of time to prostate cancer diagnosis in a prospective screening cohort of high-risk men: effect of TMPRSS2 Met160Val. BJU Int (2011) 107(3):466–70. doi: 10.1111/j.1464-410X.2010.09522.x - DOI - PMC - PubMed