. 2022 Jun 24;3(8):100536.
doi: 10.1016/j.patter.2022.100536. eCollection 2022 Aug 12.

Supervised dimensionality reduction for exploration of single-cell data by HSS-LDA

Affiliations

Supervised dimensionality reduction for exploration of single-cell data by HSS-LDA

Meelad Amouzgar et al. Patterns (N Y). .

Abstract

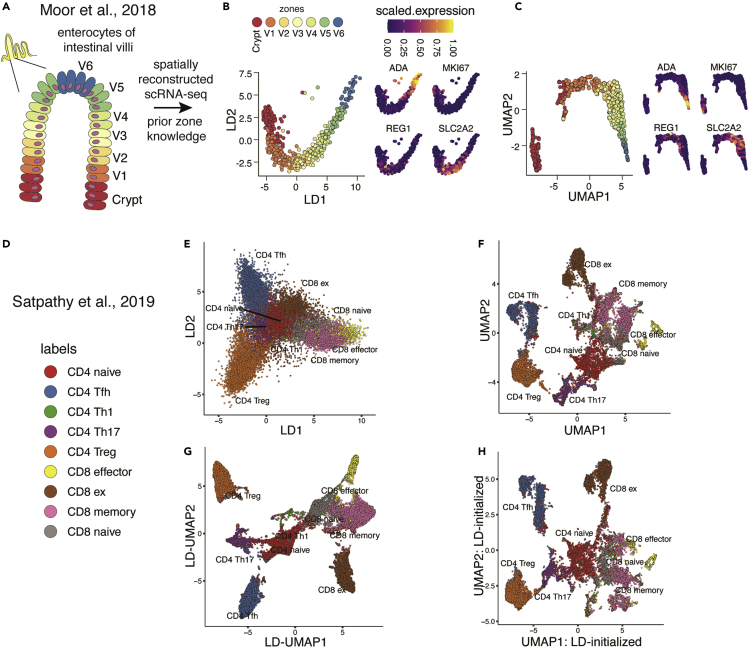
Single-cell technologies generate large, high-dimensional datasets encompassing a diversity of omics. Dimensionality reduction captures the structure and heterogeneity of the original dataset, creating low-dimensional visualizations that contribute to the human understanding of data. Existing algorithms are typically unsupervised, using measured features to generate manifolds, disregarding known biological labels such as cell type or experimental time point. We repurpose the classification algorithm, linear discriminant analysis (LDA), for supervised dimensionality reduction of single-cell data. LDA identifies linear combinations of predictors that optimally separate a priori classes, enabling the study of specific aspects of cellular heterogeneity. We implement feature selection by hybrid subset selection (HSS) and demonstrate that this computationally efficient approach generates non-stochastic, interpretable axes amenable to diverse biological processes such as differentiation over time and cell cycle. We benchmark HSS-LDA against several popular dimensionality-reduction algorithms and illustrate its utility and versatility for the exploration of single-cell mass cytometry, transcriptomics, and chromatin accessibility data.

Keywords: LDA; algorithms; cell cycle; dimensionality reduction; feature interpretation; feature selection; linear discriminant analysis; omics; single cell; trajectory; visualization.


Conflict of interest statement

The authors declare no competing interests.

Figures

None
Graphical abstract
Figure 1
Figure 1
HSS-LDA optimizes dimensionality reduction using feature selection (A) Workflow demonstrating linear discriminant analysis (LDA) with prior knowledge of class labels of interest for supervised dimensionality reduction and feature selection using hybrid subset selection (HSS). (B) HSS-LDA performs feature selection to enhance dimensionality reduction and visualization of single-cell data by maximizing class separation via a stepwise feature selection approach, selecting the final model based on a separation metric specified by the user. (C) Comparison of LDA and HSS-LDA visualization using example endoderm differentiation data.
Figure 2
Figure 2
HSS-LDA reconstructs both discrete and continuous biological processes and can embed new, unseen cells onto the visualization for exploratory analysis (A) Conceptual diagram of immune cells extracted from healthy bone marrow and stained using morphometric markers for CyTOF. (B) Bar plot summarizing imbalanced class distribution of immune cell populations. (C) Comparison of HSS-LDA using pixel class entropy (PCE) score for feature selection and UMAP demonstrating discrete class visualization using the same input cells. (D) Conceptual diagram of human CD8 naive T cells extracted from PBMCs for ex vivo TCR stimulation, collected on days 0–5 of activation, and stained with metabolic markers for CyTOF analysis. (E) Comparison of HSS-LDA using Euclidean distance for feature selection and UMAP demonstrating a linear trajectory using the same input cells faceted across each time point. The number of cells is balanced across each time point. UMAP implemented with published settings: n_neighbors = 15 and min_dist = 0.02. (F) Unfaceted HSS-LDA and UMAP plot of (E). (G) Biaxial CD57 versus CD45 plot colored by density, showing train-test split for stratification CD57low and CD57high cells. HSS-LDA is trained on CD57low cells and the unseen CD57high cells are used as a test set projected onto the CD57low LD embedding. (H) Bar plot summary counts for CD57low and CD57high training and test sets. (I) Biaxial LD plots of CD57low cells and embedded CD57high cells labeled with the centroid point for each time point. (J) Protein expression of biaxial HSS-LD plots for 3 example markers: CD3, CD98, and MCT1. (K) Boxplot summary of protein expression for CD57low and CD57high cells across each time point. Wilcoxon signed-rank test performed between CD57low and CD57high cells across each time point. ∗p ≤ 0.05; ∗∗p ≤ 0.01; ∗∗∗p ≤ 0.001; ∗∗∗∗p ≤ 0.0001.
Figure 3
Figure 3
HSS-LDA reconstructs cyclical biological trajectories and can be input as features into UMAP to solve challenging dual-class visualization tasks (A) Conceptual diagram of cell-cycle and chromotyping markers of various cell lines for CyTOF analysis. (B) Bar plot summary of cell counts for each cell line in various cell-cycle phases. (C) Comparison of HSS-LDA using Euclidean distance for feature selection and UMAP visualizing the cell cycle. (D) Comparison of HSS-LDA using Euclidean distance for feature selection and UMAP both including and excluding mitotic cells to visualize cell lines. (E) Conceptual diagram demonstrating prior supervised dimensionality reduction using HSS-LDA to initialize UMAP. (F) HSS-LDA-initialized UMAP plots of the cell-cycle and cell line labels. UMAP parameters were selected qualitatively; for cell cycle: n_neighbors = 25, spread = 7; for cell lines: n_neighbors = 15, spread = 1. (G) Conceptual diagram demonstrating prior supervised dimensionality reduction using HSS-LDA to initialize UMAP for dual-class labeled data visualization. HSS-LDA is computed separately on cell-cycle and cell line labels, and the HSS-LDs are merged as the feature set input to initialize UMAP. (H) HSS-LDA-initialized UMAP plots demonstrating dual-class visualization of both cell line and cell-cycle systems in a single biaxial plot. UMAP parameters were selected qualitatively: n_neighbors = 10, spread = 4.
Figure 4
Figure 4
LDA is computationally efficient and scalable and adequately separates class labels (A) Conceptual diagram for comparing various dimensionality-reduction algorithms. PCA, LDA, UMAP, and PHATE algorithms are applied to 3 CyTOF datasets, and runtimes are assessed to determine efficiency and scalability of the algorithm. (B) The average runtime of 3 analyses across 3 datasets for each algorithm are shown across different dataset sizes on a log2-transformed scale. Default algorithm settings are used. (C) Summary of silhouette score and PCE score to assess separation of class labels of interest for each algorithm. Both metrics can be used for feature selection by HSS-LDA. (D–L) Summary plots of each algorithm applied to the morphometry, T cell metabolism, and chromotyping datasets. (Left: D, G, and J) Representative biaxial visualizations of each algorithm using 10,000 cells. (Center: E, H, and K) Average silhouette score across different cell counts for each algorithm. (Right: F, I, and L) Average PCE score in a 100 × 100 pixel grid across different cell counts for each algorithm.
Figure 5
Figure 5
LDA utility extends to single-cell sequencing data to reconstruct linear trajectories as well as organize single-cell chromatin accessibility data using semi-supervised dimensionality reduction (A–C) Dimensionality reduction using a single-cell dataset of enterocytes of the intestinal villi from Moor at al. (A) Conceptual diagram for (B) and (C) showing enterocyte differentiation from the crypt and across the intestinal villi with prior intestinal zones identified using spatial transcriptomics. (B and C) Comparison of LDA and UMAP demonstrating the linear trajectory of enterocyte differentiation paired with scaled expression of key genes. (D–F) Dimensionality reduction using single-cell ATAC chromatin accessibility data of T cells from Satpathy et al. (D) Cell-type labels color key. (E) LDA embedding supervised with prior known cell-type labels. (F) UMAP embedding of the same feature set input in (E). (G) UMAP embedding generated from all 8 LDs generated in (E) input into UMAP. (H) UMAP embedding initialized by the first 2 LDs (from E) for semi-supervised dimensionality reduction.
Figure 6
Figure 6
LDA can reconstruct cyclical trajectories using scRNA-seq data (A) Conceptual diagram of cell-cycle score computation using prior methods on ex vivo CD8 T cell TCR stimulation sc-RNA-seq data. (B) Bar plot summary counts of assigned cell-cycle phase identities. The phase with the largest cell-cycle score is assigned to each cell. (C) Density plot summary of cell-cycle phases showing enrichment of cell-cycle scores in each respective assigned phase. (D) Pearson correlation of cell-cycle scores computed across all cells. (E) Cyclical LDA visualization on cell-cycle scores. (F) Graphical representation of angular pseudotime calculation. (G) Generalized linear models of cell-cycle scores across the angular pseudotime estimated using the LD biaxial. (H) Heatmap of estimated transcript expression summarized as a generalized additive model for key cell-cycle markers across the cell-cycle angular pseudotime. (I) Conceptual diagram for (J) demonstrating experimental protocol using CFSE-sorted T cells on day 3 of TCR stimulation to extract cell division IDs before 10x Genomics scRNA-seq. (J) Estimated transcript expression of CyclinB1 and relevant TCR signaling genes identified using derivative analysis plotted across the cell cycle angular pseudotime deconvolved across cell divisions using CFSE-sorted division IDs.

References

    1. Tang F., Barbacioru C., Wang Y., Nordman E., Lee C., Xu N., Wang X., Bodeau J., Tuch B.B., Siddiqui A., et al. mRNA-Seq whole-transcriptome analysis of a single cell. Nat. Methods. 2009;6:377–382. http://www.nature.com/articles/nmeth.13 - PubMed
    1. Buenrostro J.D., Wu B., Litzenburger U.M., Ruff D., Gonzales M.L., Snyder M.P., Chang H.Y., Greenleaf W.J. Single-cell chromatin accessibility reveals principles of regulatory variation. Nature. 2015;523:486–490. http://www.nature.com/articles/nature14590 - PMC - PubMed
    1. Han A., Glanville J., Hansmann L., Davis M.M. Linking T-cell receptor sequence to functional phenotype at the single-cell level. Nat. Biotechnol. 2014;32:684–692. http://www.nature.com/articles/nbt.2938 - PMC - PubMed
    1. Newell E.W., Sigal N., Bendall S.C., Nolan G.P., Davis M.M. Cytometry by time-of-flight shows combinatorial cytokine expression and virus-specific cell niches within a continuum of CD8+ T cell phenotypes. Immunity. 2012;36:142–152. https://linkinghub.elsevier.com/retrieve/pii/S1074761312000040 - PMC - PubMed
    1. Stoeckius M., Hafemeister C., Stephenson W., Houck-Loomis B., Chattopadhyay P.K., Swerdlow H., Satija R., Smibert P. Simultaneous epitope and transcriptome measurement in single cells. Nat. Methods. 2017;14:865–868. http://www.nature.com/articles/nmeth.4380 - PMC - PubMed