. 2022 Aug 12:13:895695.
doi: 10.3389/fmicb.2022.895695. eCollection 2022.

B.1.1.7 (Alpha) variant is the most antigenic compared to Wuhan strain, B.1.351, B.1.1.28/triple mutant and B.1.429 variants

Affiliations

B.1.1.7 (Alpha) variant is the most antigenic compared to Wuhan strain, B.1.351, B.1.1.28/triple mutant and B.1.429 variants

Manojit Bhattacharya et al. Front Microbiol. .

Abstract

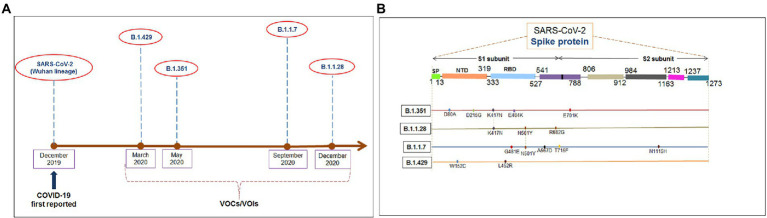
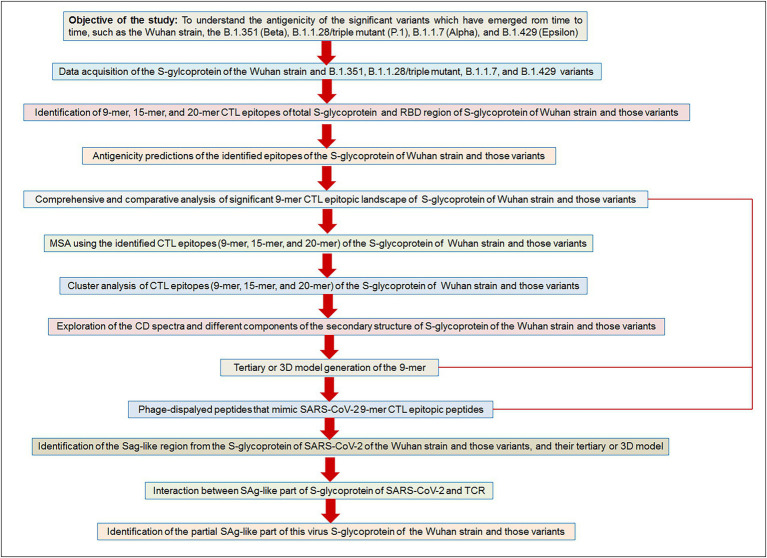
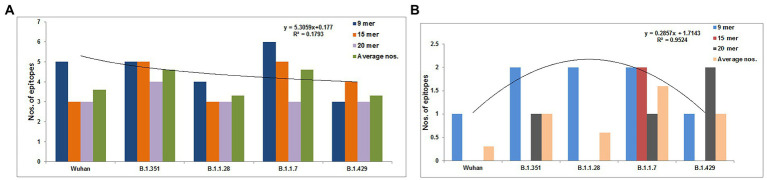
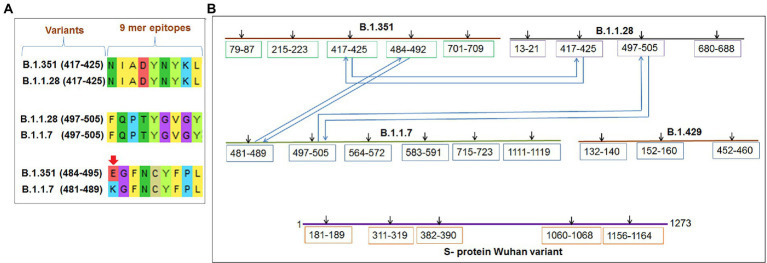
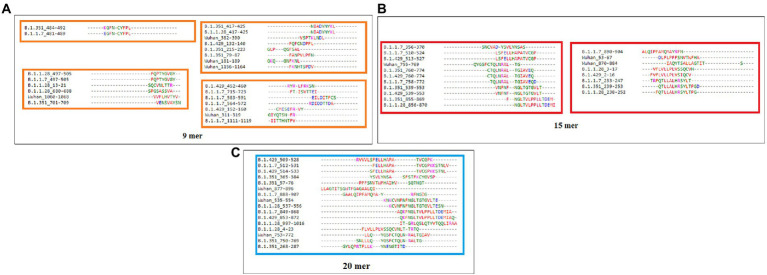
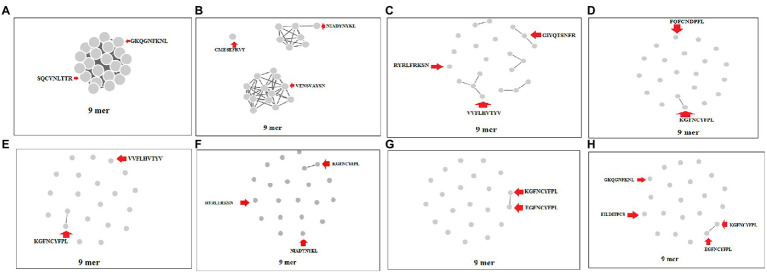
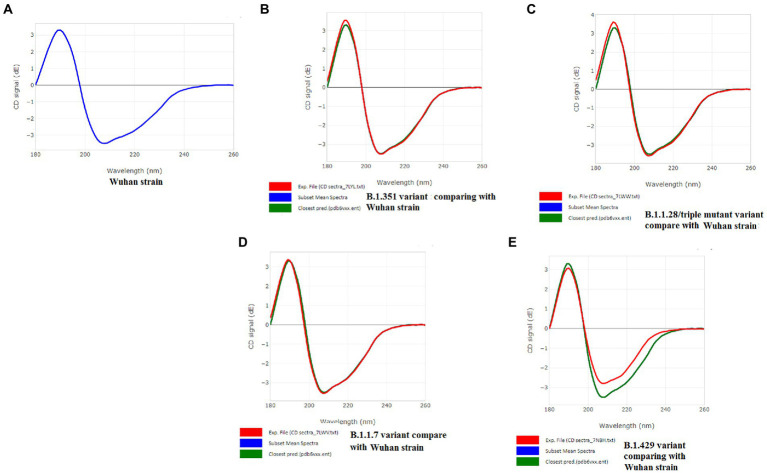
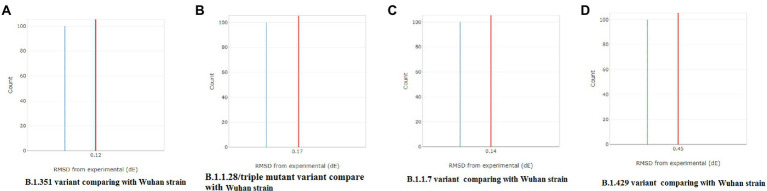
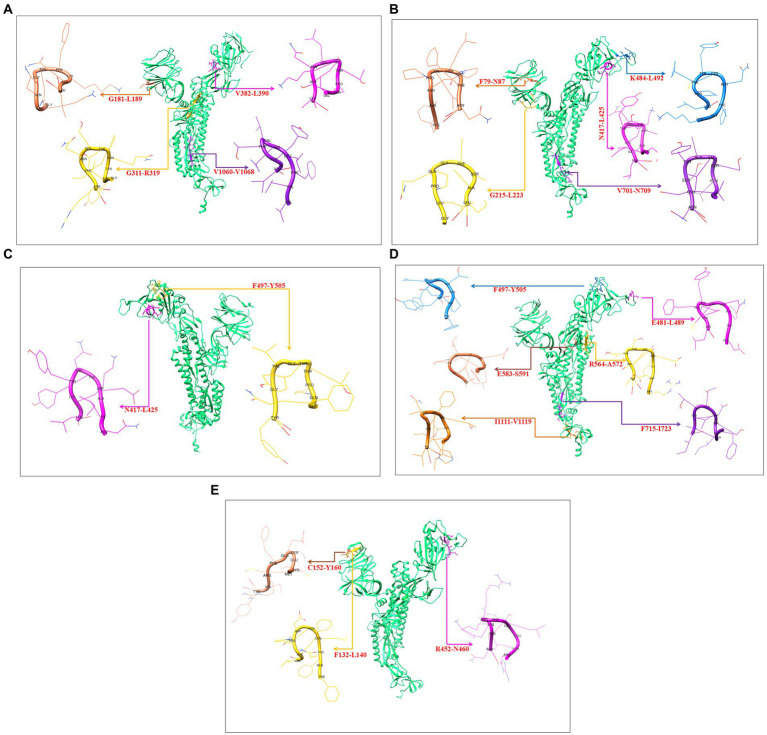
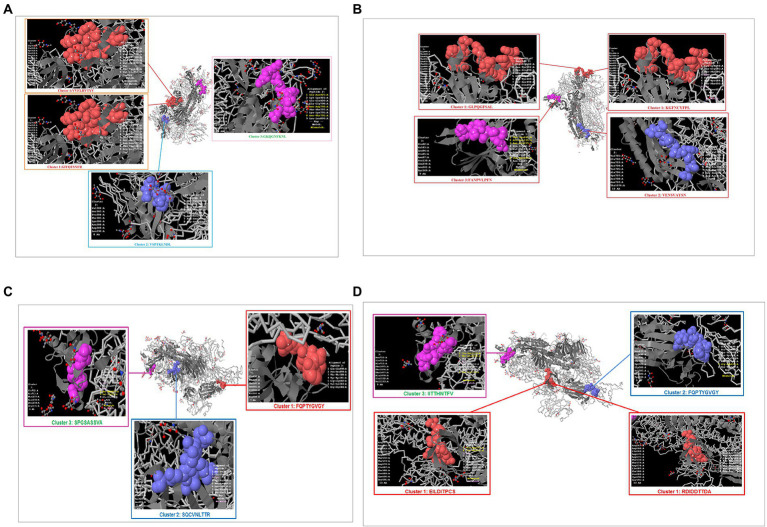
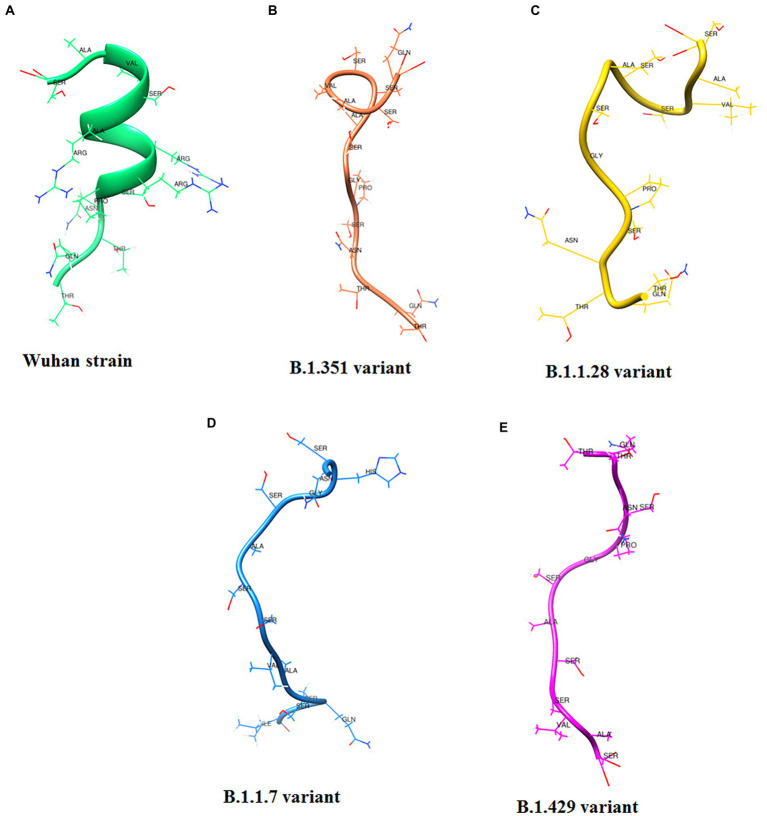
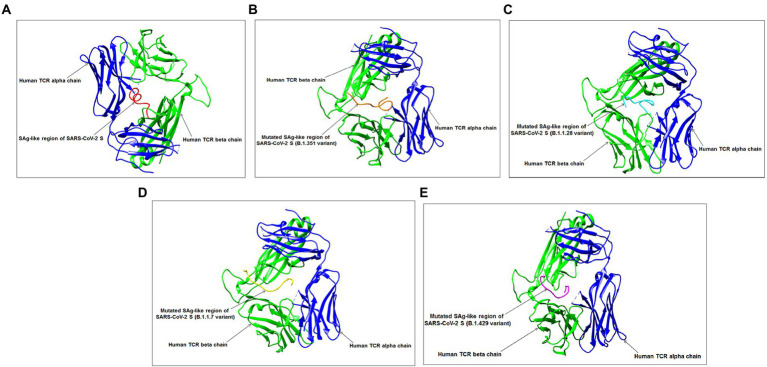
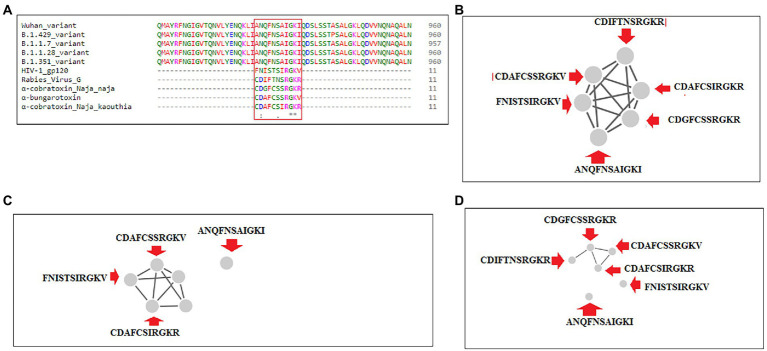
The rapid spread of the SARS-CoV-2 virus and its variants has created a catastrophic impact worldwide. Several variants have emerged, including B.1.351 (Beta), B.1.1.28/triple mutant (P.1), B.1.1.7 (Alpha), and B.1.429 (Epsilon). We performed comparative and comprehensive antigenicity mapping of the total S-glycoprotein using the Wuhan strain and the other variants and identified 9-mer, 15-mer, and 20-mer CTL epitopes through in silico analysis. The study found that 9-mer CTL epitope regions in the B.1.1.7 variant had the highest antigenicity and an average of the three epitope types. Cluster analysis of the 9-mer CTL epitopes depicted one significant cluster at the 70% level with two nodes (KGFNCYFPL and EGFNCYFPL). The phage-displayed peptides showed mimic 9-mer CTL epitopes with three clusters. CD spectra analysis showed the same band pattern of S-glycoprotein of Wuhan strain and all variants other than B.1.429. The developed 3D model of the superantigen (SAg)-like regions found an interaction pattern with the human TCR, indicating that the SAg-like component might interact with the TCR beta chain. The present study identified another partial SAg-like region (ANQFNSAIGKI) from the S-glycoprotein. Future research should examine the molecular mechanism of antigen processing for CD8+ T cells, especially all the variants' antigens of S-glycoprotein.

Keywords: B.1.1.7; CD spectra; CTL epitopes; SAg-like region; antigenicity; cluster; emerging variants; phage-displayed peptides.


Conflict of interest statement

The authors declare that the research was conducted in the absence of any commercial or financial relationships that could be construed as a potential conflict of interest.

Figures

Figure 1
Figure 1
The figure depicted the timeline and mutations of newly significant emerging variants and Wuhan strain. (A) Timeline showing the origin time of some newly significant emerging variants (B.1.351, B.1.1.28/triple mutant, B.1.1.7, and B.1.429) and Wuhan strain. (B) The schematic diagram shows the significant mutations present in the CTL antigenic regions of newly emerging SARS-CoV-2 variants S-protein.
Figure 2
Figure 2
The flow diagram illustrates our used methodologies to test the objective of the study hypothesis. Our aim/objective of this research is to understand the antigenicity of the significant variants which have emerged from time to time, such as the Wuhan strain, the B.1.351 (Beta), B.1.1.28/triple mutant (P.1), B.1.1.7 (Alpha), and B.1.429 (Epsilon).
Figure 3
Figure 3
Comparison of the number of the 9 mer, 15 mer, 20 mer CTL antigenic epitopes of total S-glycoprotein and RBD region of S-glycoprotein of Wuhan strain and B.1.351, B.1.1.28/triple mutant, B.1.1.7, and B.1.429 variant. (A) Comparison of the number of the 9 mer, 15 mer, 20 mer, and an average number of CTL antigenic epitopes of total S-glycoprotein. (B) Comparison of the number of 9 mer, 15 mer, 20 mer, and the average number of CTL antigenic epitopes of RBD region of S-glycoprotein. We develop the polynomial (order 2) relationships for the two graphs (A; R2 = 0.1793 and B; R2 = 0.9524).
Figure 4
Figure 4
A schematic diagram of significant 9 mer CTL epitopic landscape of S-glycoprotein of Wuhan strain and B.1.351, B.1.1.28/triple mutant, B.1.1.7, and B.1.429 variant. The figure also shows the significant mutations present in the 9 mer CTL epitopic regions. (A) A schematic diagram of 9 mer CTL antigenic epitopes identified of S-glycoprotein in Wuhan strain. (B) A schematic diagram of 9 mer CTL antigenic epitopes recognized of S-glycoprotein in the B.1.351 variant with significant mutations in the epitopic regions. (C) A schematic diagram of 9 mer CTL antigenic epitopes identified of S-glycoprotein in B.1.1.28/triple mutant variant with substantial mutations in the epitopic areas. (D) A schematic diagram of 9 mer CTL antigenic epitopes recognized of S-glycoprotein in B.1.1.7 variant with significant mutations in the epitopic regions. (E) A schematic diagram of 9 mer CTL antigenic epitopes identified of S-glycoprotein in B.1.429 variant with substantial mutations in the epitopic regions.
Figure 5
Figure 5
Comparative mapping of significant 9 mer CTL epitope of S-glycoprotein of Wuhan strain and B.1.351, B.1.1.28/triple mutant, B.1.1.7, and B.1.429 variant. (A) Epitopes homology of Wuhan strain and B.1.351, B.1.1.28/triple mutant, B.1.1.7, and B.1.429 variant. (B) A schematic diagram shows the similarity between the epitopes among B.1.351, B.1.1.28/triple mutant, B.1.1.7, and B.1.429 variant.
Figure 6
Figure 6
Epitope alignment of 9 mer, 15 mer, 20 mer CTL antigenic epitopes present in the S-glycoprotein of Wuhan strain and B.1.351, B.1.1.28/triple mutant, B.1.1.7, and B.1.429 variant. (A) Epitope alignment shows four significant blocks from 9 mer CTL antigenic epitopes. (B) Epitope alignment shows two significant blocks from 15 mer CTL antigenic epitopes. (C) Epitope alignment shows one significant block from 20 mer CTL antigenic epitopes.
Figure 7
Figure 7
Cluster formation of 9 mer CTL epitopes of S-glycoprotein of Wuhan strain and B.1.351, B.1.1.28/triple mutant, B.1.1.7, and B.1.429 variant using the threshold 10% level to 80% level. (A) Cluster formation at 10% level. (B) Cluster formation at 20% level. (C) Cluster formation at 30% level. (D) Cluster formation at 40% level. (E) Cluster formation at 50% level. (F) Cluster formation at 60% level. (G) Cluster formation at 70% level. (H) Cluster formation at 80% level.
Figure 8
Figure 8
CD spectra of S-glycoprotein of the Wuhan variant and B.1.351, B.1.1.28/triple mutant, B.1.1.7, B.1.429 variants. (A) CD spectra of S-glycoprotein of the Wuhan strain (B) Resemblance of CD spectra of S-glycoprotein of the Wuhan strain and B.1.351. (C) The resemblance of CD spectra of S-glycoprotein of the Wuhan strain and B.1.1.28/triple mutant. (D) The resemblance of CD spectra of S-glycoprotein of the Wuhan strain and B.1.1.7. (E) The resemblance of CD spectra of S-glycoprotein of the Wuhan strain and B.1.429.
Figure 9
Figure 9
Comparison of RMSD between the CD spectra of the S-glycoprotein Wuhan variant and other variants. (A) The resemblance of RMSD between the CD spectra of S-glycoprotein Wuhan strain and B.1.351. (B) The resemblance of RMSD between the CD spectra of S-glycoprotein Wuhan strain and B.1.1.28/triple mutant. (C) The resemblance of RMSD between the CD spectra of the S-glycoprotein Wuhan strain and B.1.1.7. (D) The resemblance of RMSD between the CD spectra of S-glycoprotein Wuhan strain and B.1.429.
Figure 10
Figure 10
Generated three-dimensional (3D) model of 9 mer CTL epitopic regions of the Wuhan strain and B.1.351, B.1.1.28/triple mutant, B.1.1.7, B.1.429 variants and their position in 3D model of S-glycoprotein. (A) 3D model of 9 mer CTL epitopic regions of the Wuhan strain and their position in 3D model of S-glycoprotein. (B) 3D model of 9 mer CTL epitopic regions of the B.1.351 variant and their position in 3D model of S-glycoprotein. (C) 3D model of 9 mer CTL epitopic regions of the B.1.1.28/triple mutant variant and their position in 3D model of S-glycoprotein. (D) 3D model of 9 mer CTL epitopic regions of the B.1.1.7 variant and their position in 3D model of S-glycoprotein. (E) 3D model of 9 mer CTL epitopic regions of the B.1.429 variant and their position in the 3D model of S-glycoprotein.
Figure 11
Figure 11
Phage-displayed peptides that mimic S-glycoprotein of SARS-CoV-2 9 mer CTL epitopes of the Wuhan strain and B.1.351, B.1.1.28/triple mutant, B.1.1.7, B.1.429 variants. (A) Phage-displayed peptides that mimic S-glycoprotein of 9 mer CTL epitopes of the Wuhan strain and the cluster epitopes. (B) Phage-displayed peptides that mimic S-glycoprotein of 9 mer CTL epitopes of the B.1.351 variant and the cluster epitopes. (C) Phage-displayed peptides that mimic S-glycoprotein of 9 mer CTL epitopes of the B.1.1.28/triple mutant variant and the cluster epitopes. (D) Phage-displayed peptides that mimic S-glycoprotein of 9 mer CTL epitopes of B.1.1.7 and the cluster epitopes.
Figure 12
Figure 12
3D model of SAg-like region from S-glycoprotein of Wuhan strain and B.1.351, B.1.1.28/triple mutant, B.1.1.7 and B.1.429 variants. (A) 3D model of SAg-like region from S-glycoprotein of Wuhan strain. (B) 3D model of SAg-like region from S-glycoprotein of the B.1.351 variant which was generated same SAg-like region from S-glycoprotein of Wuhan strain. (C) 3D model of SAg-like region from S-glycoprotein of the B.1.1.28/triple mutant variant which was generated same SAg-like region from S-glycoprotein of Wuhan strain. (D) 3D model of SAg-like region from S-glycoprotein of the B.1.1.7 variant which was generated same SAg-like region from S-glycoprotein of Wuhan strain. (E) 3D model of SAg-like region from S-glycoprotein of the B.1.429 variant which was generated same SAg-like region from S-glycoprotein of Wuhan strain.
Figure 13
Figure 13
Interaction between SAg-like region from S-glycoprotein of Wuhan strain, B.1.351, B.1.1.28/triple mutant, B.1.1.7, B.1.429 variants and TCR. (A) Interaction between SAg-like region of Wuhan strain and TCR. (B) Interaction between SAg-like part of B.1.351 variant and TCR. (C) Interaction between SAg-like part of the B.1.1.28/triple mutant variant and TCR. (D) Interaction between the SAg-like part of the B.1.1.7 variant and TCR. (E) Interaction between the SAg-like part of the B.1.429 variant and TCR.
Figure 14
Figure 14
Another partial SAg-like region from S-glycoprotein of SARS-CoV-2 of Wuhan strain, B.1.351, B.1.1.28/triple mutant, B.1.1.7, B.1.429 variants shows the sequence similarity with an α-cobra toxin (Naja naja),α-bungarotoxin, Rabies Virus G Protein (189–199), α-cobra toxin (Naja kaouthia), and HIV-1 gp120 (164–174) and their cluster formation. (A) Sequence similarity of superantigens (α-cobra toxin (Naja naja),α-bungarotoxin, Rabies Virus G Protein (189–199), α-cobra toxin (N. kaouthia), and HIV-1 gp120 (164–174)), Wuhan variant, and significant VOCs/VOI (B.1.351, B.1.1.28/triple mutant, B.1.1.7, B.1.429) shows a partial super SAg-like region. (B) Cluster (with these MSA sequences) at 30% level. (C) Cluster (with these MSA sequences) at 40% level. (D) Cluster (with these MSA sequences) at 70% level.

Similar articles

References

    1. Al-Shangiti A. M., Naylor C. E., Nair S. P., Briggs D. C., Henderson B., Chain B. M. (2004). Structural relationships and cellular tropism of staphylococcal superantigen-like proteins. Infect. Immun. 72, 4261–4270. doi: 10.1128/IAI.72.7.4261-4270.2004, PMID: - DOI - PMC - PubMed
    1. Anderson C. S., McCall P. R., Stern H. A., Yang H., Topham D. J. (2018). Antigenic cartography of H1N1 influenza viruses using sequence-based antigenic distance calculation. BMC Bioinformatics 19, 1–11. doi: 10.1186/s12859-018-2042-4 - DOI - PMC - PubMed
    1. Andreatta M., Nielsen M. (2018). Bioinformatics tools for the prediction of T-cell epitopes. Methods Mol. Biol. 1785, 269–281. doi: 10.1007/978-1-4939-7841-0_18 - DOI - PubMed
    1. Bange E. M., Han N. A., Wileyto P., Kim J. Y., Gouma S., Robinson J., et al. . (2021). CD8+ T cells contribute to survival in patients with COVID-19 and hematologic cancer. Nat. Med. 27, 1280–1289. doi: 10.1038/s41591-021-01386-7, PMID: - DOI - PMC - PubMed
    1. Baú D., Martin A. J., Mooney C., Vullo A., Walsh I., Pollastri G. (2006). Distill: a suite of web servers for the prediction of one-, two-and three-dimensional structural features of proteins. BMC Bioinformatics 7, 1–8. doi: 10.1186/1471-2105-7-402 - DOI - PMC - PubMed