Abstract

This scientific opinion focuses on the welfare of pigs on farm, and is based on literature and expert opinion. All pig categories were assessed: gilts and dry sows, farrowing and lactating sows, suckling piglets, weaners, rearing pigs and boars. The most relevant husbandry systems used in Europe are described. For each system, highly relevant welfare consequences were identified, as well as related animal-based measures (ABMs), and hazards leading to the welfare consequences. Moreover, measures to prevent or correct the hazards and/or mitigate the welfare consequences are recommended. Recommendations are also provided on quantitative or qualitative criteria to answer specific questions on the welfare of pigs related to tail biting and related to the European Citizen's Initiative 'End the Cage Age'. For example, the AHAW Panel recommends how to mitigate group stress when dry sows and gilts are grouped immediately after weaning or in early pregnancy. Results of a comparative qualitative assessment suggested that long-stemmed or long-cut straw, hay or haylage is the most suitable material for nest-building. A period of time will be needed for staff and animals to adapt to housing lactating sows and their piglets in farrowing pens (as opposed to crates) before achieving stable welfare outcomes. The panel recommends a minimum available space to the lactating sow to ensure piglet welfare (measured by live-born piglet mortality). Among the main risk factors for tail biting are space allowance, types of flooring, air quality, health status and diet composition, while weaning age was not associated directly with tail biting in later life. The relationship between the availability of space and growth rate, lying behaviour and tail biting in rearing pigs is quantified and presented. Finally, the panel suggests a set of ABMs to use at slaughter for monitoring on-farm welfare of cull sows and rearing pigs.

Keywords: animal‐based measures; end the cage age; husbandry systems; on‐farm pig welfare; pig categories; tail biting; welfare consequences.


Figures

Figure 1
Figure 1
Drawing of a farrowing crate (based on Baumgartner et al., 2005)
Figure 2
Figure 2
Drawings of farrowing system with temporary crating. (A) crate closed, (B) crate open (based on Heidinger et al., 2022)
Figure 3
Figure 3
Examples of farrowing pens ((A) is based on Weber and Schick,  and (B) is based on Baxter and Edwards, 2021)
Figure 4
Figure 4
An example of group housing system for lactating sows and their litters (based on Hagmüller et al., 2017)
Figure 5
Figure 5
Artificial piglet rearing systems: (A); based on Rzezniczek et al. (2015) and (B) based on Weber et al. (2015)
Figure 6
Figure 6
Example of an indoor group housing of weaners with a balcony (based on Vermeer et al., 2012)
Figure 7
Figure 7
Example of an indoor group housing of weaners with access to an outdoor area (based on Auinger et al., 2015)
Figure 8
Figure 8
Effects of grouping sows at different stages on farrowing rate (using values standardised within study relative to stage 2, set to 100%). Comparison to stalls is also indicated
Figure 9
Figure 9
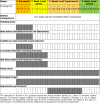
The welfare consequences and effect on reproductive performance (farrowing rate) gilts and dry sows may experience when grouped at four different stages during the post‐weaning/preservice and early pregnancy period. Day ‘0’ indicates the day of service, with gilts and dry sows arriving in the service area 4 days before (i.e. day ‐4). Grey cells indicate when a day is particularly relevant for that welfare consequence
Figure 10
Figure 10
Drawing representing a ‘well‐designed’ mixing pen to allow sows to establish a dominance hierarchy in safety (based on a photo courtesy of Vermeer H)
Figure 11
Figure 11
Effect of crate opening time on the piglet mortality expressed relative to the mortality of fully crated sows (= 100%). The area of the circles represents the sample size (all studies). (Further information on the supporting literature is available upon request)
Figure 12
Figure 12
Relation between the time a sow is crated and the piglet mortality. The red line interpolates between the mortality observed for non‐crated sows and the crating time large enough to have no further decrease on the mortality. Grey bars indicate the 90% certainty ranges, while the green curve indicates the variation in piglet mortality between litters without exposure to the sow (fully crated sows) (green dots indicate the 5th, 50th (median), and 95th percentile)
Figure 13
Figure 13
Effect of space allowance of the sow on the inter‐piglet birth interval (IBI) in pens expressed relative to the IBI of crated sows (= 100%). Every point represents one treatment in the mentioned study
Figure 14
Figure 14
Comparison of the inter‐piglet birth interval (IBI) of sows in pens with crated sows. The grey bars indicate the 90% certainty ranges, while the green curve indicates the variation between crated sows (green dots indicate the 5th, 50th (Median), and 95th percentile)
Figure 15
Figure 15
Relation between space allowance of the sow and proportion of time the sow is showing locomotory behaviour. The red line shows the interpolation between fully crated sows and sows experiences no restriction in space. For an intermediate space of 4 m2/sow, an additional estimate is included to show a super‐linear relationship (pink line). Grey bars indicate the 90% certainty ranges, while the green curve indicates the variation between unrestricted sows (green dots indicate the 5th, 50th (Median), and 95th percentile)
Figure 16
Figure 16
Effect of space allowance of the sow on the piglet mortality in pens expressed relative to the mortality in farrowing crates (= 100%). The area of the circles represents the sample size. (Further information on the supporting literature is available upon request).
Figure 17
Figure 17
Relation between space allowance of the sow and the piglet mortality. The red line interpolates between the mortality observed at the minimal space for the sow to turn (4 m2) and the pen size large enough to have no further decrease on the mortality for increased space. Grey bars indicate the 90% certainty ranges, while the green curve indicates the variation in piglet mortality between sows without restriction of space (green dots indicate the 5th, 50th (Median), and 95th percentile). The area reserved for the piglets in this SO is estimated to be 1.2 m2
Figure 18
Figure 18
The relative frequency or intensity of distress vocalisations compared to a weaning age (WA) at 28 days (0 on the X‐axis, set to a value of 100% on the Y‐axis). Scientific studies with no observations at WA of 28 days were extrapolated from the analysis with reference of 20–21 days. The sizes of the circles indicate the sample size of the different studies. (Further information on the supporting literature is available upon request)
Figure 19
Figure 19
Studies showing the relative ABMs indicative of gastro‐enteric disorders compared to a weaning age (WA) of 28 days (day 0 on the X‐axis, set to a value of 100%). Scientific studies with no observations at WA of 28 days were extrapolated from the analysis with reference of 20–24 days. The sizes of the circles indicate the sample size of the different studies. (Further information on the supporting literature is available upon request)
Figure 20
Figure 20
The change in post weaning mortality in relation to weaning age relative to the value at 28 days of age (day 0 on the x axis). (N.B., a logarithmic scale is used in the Y‐axis). Scientific studies with no observations at weaning age (WA) of 28 days were extrapolated from the analysis with reference of 20–24 days. The sizes of the circles indicate the sample size of the different studies. (Further information on the supporting literature is available upon request)
Figure 21
Figure 21
The change in post‐weaning mortality in relation to weaning age (WA) relative to the value at 28 days of age (day 0 on the x axis, set to 100%) (data from Svensmark et al., 1989). Scientific studies with no observations at WA of 28 days were extrapolated from the analysis with reference of 20–24 days. The sizes of the circles indicate the sample size of the different studies
Figure 22
Figure 22
The relative prevalence of belly nosing behaviour (logarithmic scale) in comparison to a weaning age (WA) of 28 days (day 0 on the X‐ axis, set to 100%). Scientific studies with no observations at WA of 28 days were extrapolated from the analysis with reference of 20–24 days. The sizes of the circles indicate the sample size of the different studies. (Further information on the supporting literature is available upon request)
Figure 23
Figure 23
Behaviour in relation to weaning age (WA) relative to the value at 28 days of age (day 0 on the X‐axis, set to 100%). (N.B., a logarithmic scale is used, and exponential relationships are fitted separately for some individual studies). Scientific studies with no observations at WA of 28 days were extrapolated from the analysis with reference of 20–24 days. The sizes of the circles indicate the sample size of the different studies. (Further information on the supporting literature is available upon request)
Figure 24
Figure 24
The proportion of pigs showing belly nosing at different ages in relation to whether they are suckling or weaned (from Jarvis et al., 2008). [N.B. data for the day on which weaning occurred (12, 21 or 42 days) were taken prior to weaning for that group on that particular weaning day]. Values with different superscript differ (p < 0.05) and represent results from post hoc test (Source: Jarvis et al., 2008)
Figure 25
Figure 25
Acceleration of growth in relation to the space allowance. The studies are those presented in Table 55. Each study is represented by one point indicating the average k‐value of the space allowance treatments (X‐axis), and the increase of the growth rate as space was increased in that study (Y‐axis). Please see text for further explanation
Figure 26
Figure 26
Deceleration of tail biting in relation to the space allowance. Each study is represented by one point, indicating the average k‐ value of the space allowance treatments and the decrease (the absolute value on a logarithmic scale: log[‐slope]) in tail biting associated with increasing space in that study
Figure 27
Figure 27
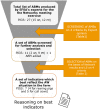
Flowchart of the process leading to the selection of the ABMs that were considered to best reflect the AW in the farm AM = ABMs measured ante‐mortem; PM = ABMs measured post‐mortem.

References

    1. Abendschön N, Senf S, Deffner P, Miller R, Grott A, Werner J, Saller AM, Reiser J, Weiss C, Zablotski Y, Fischer J, Bergmann S, Erhard MH, Baumgartner C, Ritzmann M and Zols S, 2020. Local anesthesia in piglets undergoing castration‐a Comparative study to investigate the analgesic effects of four local anesthetics based on defensive behavior and side effects. Animals (Basel), 10. 10.3390/ani10101752 - DOI - PMC - PubMed
    1. AHDB (Agriculture and Horticulture Development Board) , 2021a. 2019 Pig cost of production in selected countries. Warwickshire, UK. 31 pp.
    1. AHDB (Agriculture and Horticulture Development Board) , 2021b. 2020 Pig cost of production in selected countries. Warwickshire, UK. 31 pp.
    1. Alban L, Petersen JV and Busch ME, 2015. A comparison between lesions found during meat inspection of finishing pigs raised under organic/free‐range conditions and conventional, indoor conditions. Porcine Health Management, 1, 1–11. - PMC - PubMed
    1. Alban L, Vieira‐Pinto M, Meemken D, Maurer P, Ghidini S, Santos S, Laguna JG, Laukkanen‐Ninios R, Alvseike O and Langkabel N, 2022. Differences in code terminology and frequency of findings in meat inspection of finishing pigs in seven European countries. Food Control, 132. 10.1016/j.foodcont.2021.108394 - DOI