. 2022 Aug 10:13:957742.
doi: 10.3389/fendo.2022.957742. eCollection 2022.

Comprehensive analysis of the m6A-related molecular patterns and diagnostic biomarkers in osteoporosis

Affiliations

Comprehensive analysis of the m6A-related molecular patterns and diagnostic biomarkers in osteoporosis

Qiong Bai et al. Front Endocrinol (Lausanne). .

Abstract

Background: N6-methyladenosine (m6A) modification is a critical epigenetic modification in eukaryotes and involves several biological processes and occurrences of diseases. However, the roles and regulatory mechanisms of m6A regulators in osteoporosis (OP) remain unclear. Thus, the purpose of this study is to explore the roles and mechanisms of m6A regulators in OP.

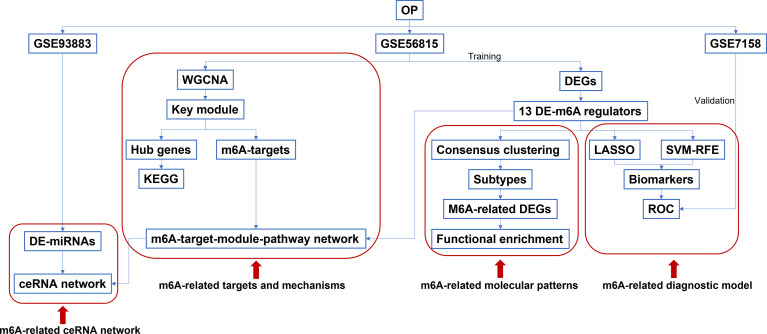
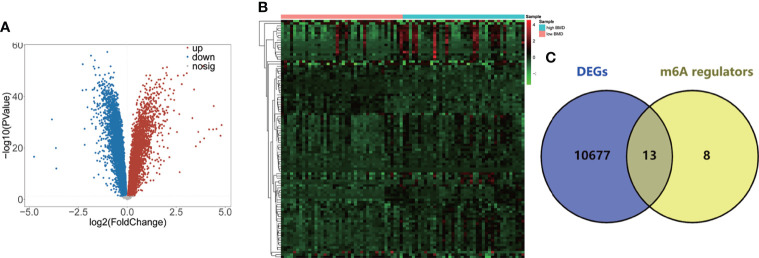
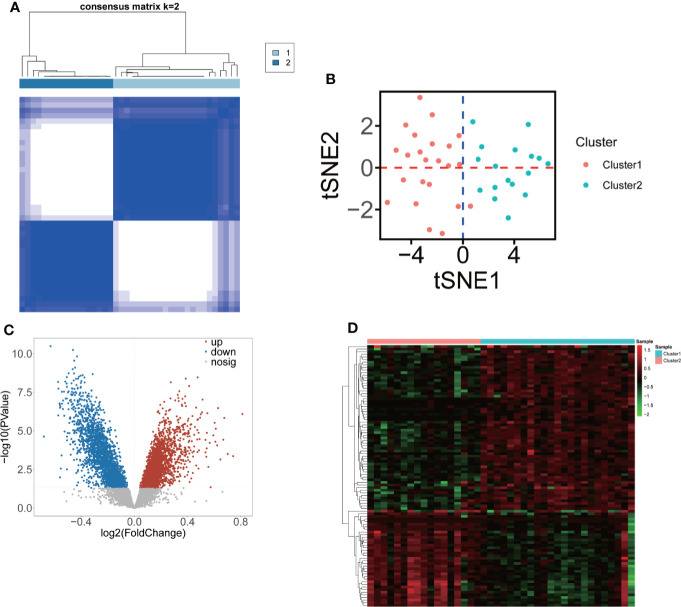
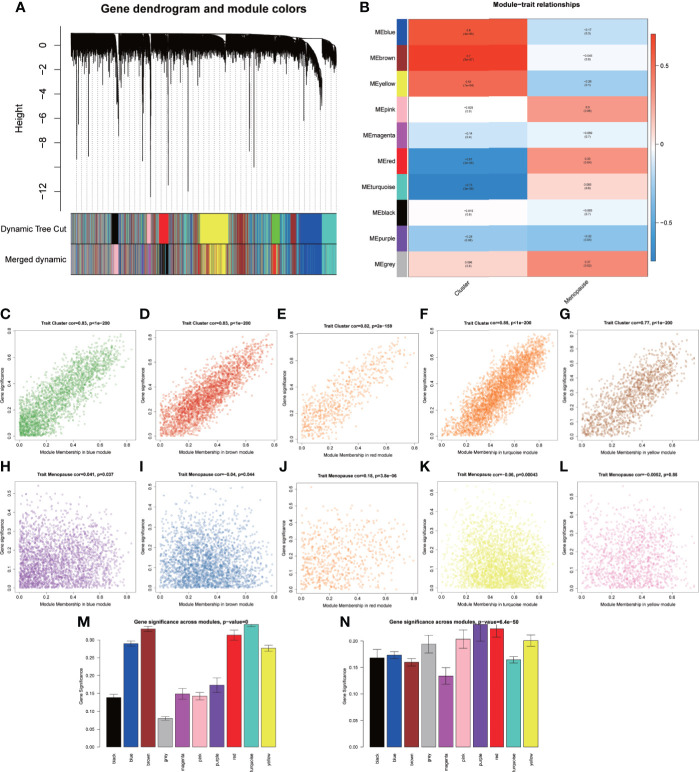
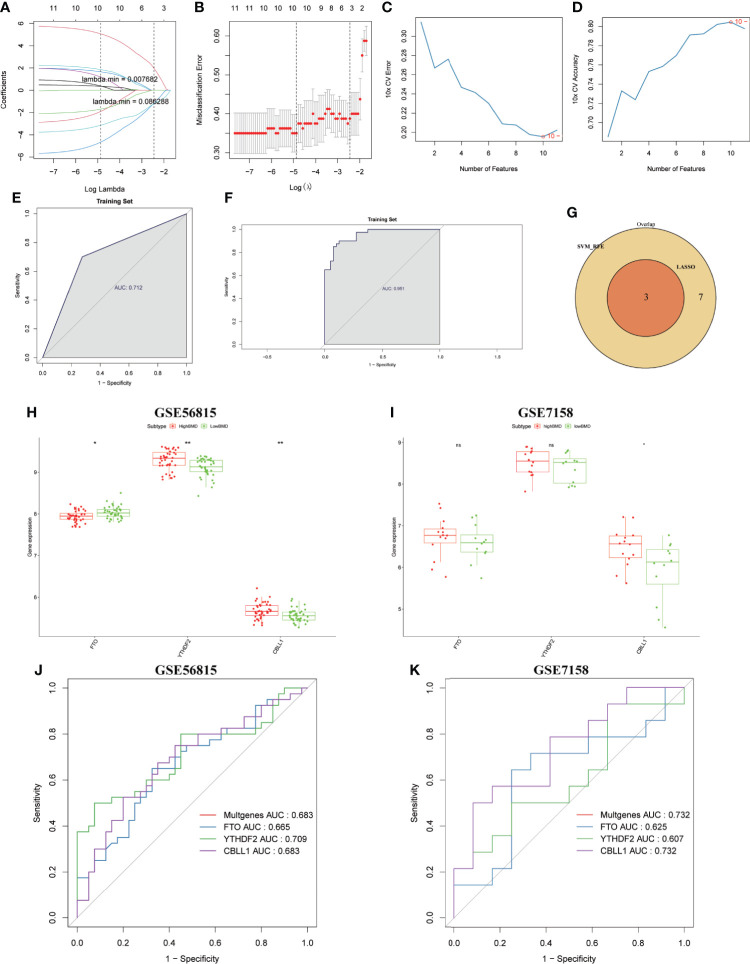
Methods: The mRNA and microRNA (miRNA) expression profiles were respectively obtained from GSE56815, GSE7158, and GSE93883 datasets in Gene Expression Omnibus (GEO). The differential expression of 21 m6A regulators between high-bone mineral density (BMD) and low-BMD women was identified. Then, a consensus clustering of low-BMD women was performed based on differentially expressed (DE)-m6A regulators. The m6A-related differentially expressed genes (DEGs), the differentially expressed miRNAs (DE-miRNAs), and biological functions were investigated. Moreover, a weighted gene co-expression network analysis (WGCNA) was constructed to identify the OP-related hub modules, hub genes, and the functional pathways. Then, an m6A regulator-target-pathway network and the competing endogenous RNA (ceRNA) network in key modules were constructed. A least absolute shrinkage and selection operation (LASSO) Cox regression model and a Support Vector Machine-Recursive Feature Elimination (SVM-RFE) model were constructed to identify the candidate genes for OP prediction. The receiver operator characteristic (ROC) curves were used to validate the performances of predictive models and candidate genes.

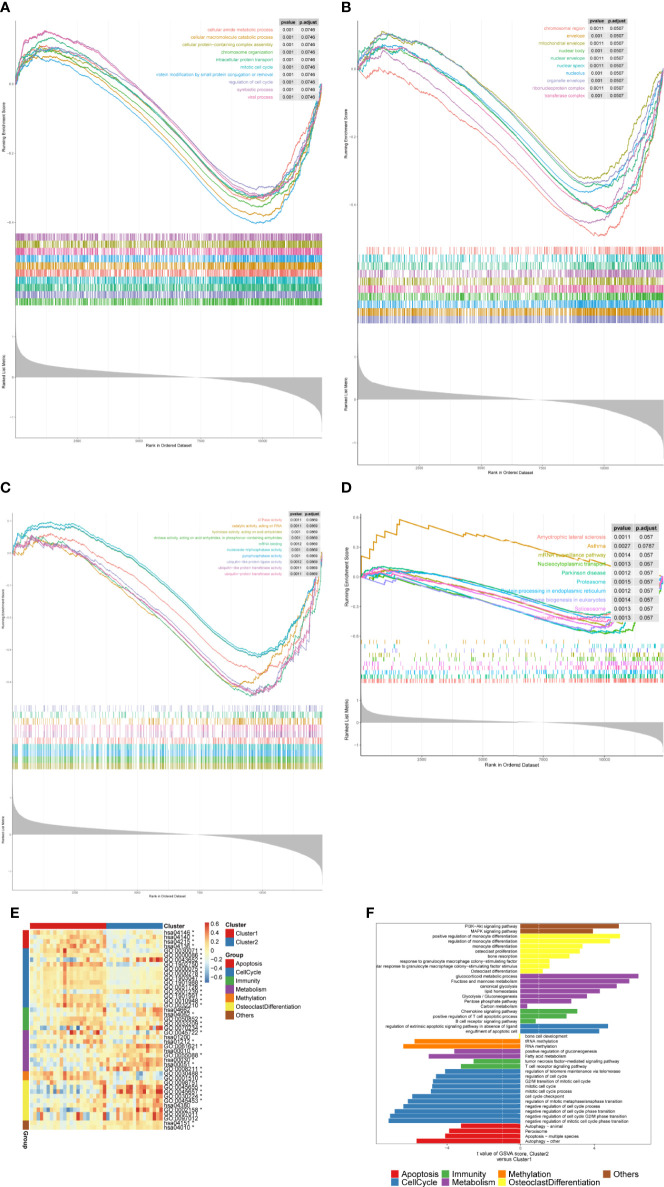
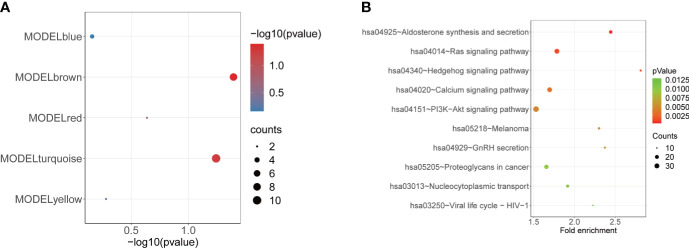
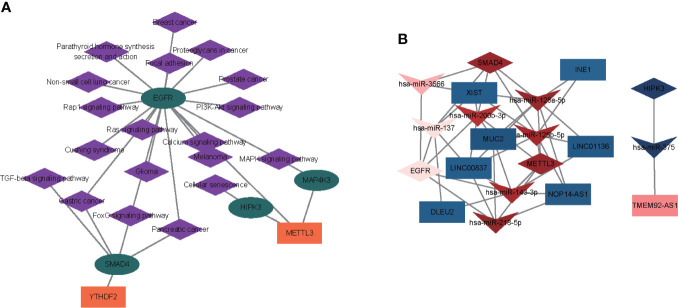
Results: A total of 10,520 DEGs, 13 DE-m6A regulators, and 506 DE-miRNAs between high-BMD and low-BMD women were identified. Two m6A-related subclusters with 13 DE-m6A regulators were classified for OP. There were 5,260 m6A-related DEGs identified between two m6A-related subclusters, the PI3K-Akt, MAPK, and immune-related pathways, and bone metabolism was mainly enriched in cluster 2. Cell cycle-related pathways, RNA methylation, and cell death-related pathways were significantly involved in cluster 1. Five modules were identified as key modules based on WGCNA, and an m6A regulator-target gene-pathway network and the ceRNA network were constructed in module brown. Moreover, three m6A regulators (FTO, YTHDF2, and CBLL1) were selected as the candidate genes for OP.

Conclusion: M6A regulators play an important role in the occurrences and diagnosis of OP.

Keywords: N6-methyladenosine; Osteoporosis; WGCNA; diagnostic markers; molecular patterns.


Conflict of interest statement

The authors declare that the research was conducted in the absence of any commercial or financial relationships that could be construed as a potential conflict of interest.

Figures

Figure 1
Figure 1
The workflow of the study design.
Figure 2
Figure 2
Identification of the 13 DE-m6A regulators. (A) Volcano plot showing the DEGs between high-BMD women (n = 40) and low-BMD women (n = 40) in the GSE56815 dataset. (B) Heatmap indicating the top 100 DEGs between high-BMD women (n = 40) and low-BMD women (n = 40) in the GSE56815 dataset. (C) Venn plot showing the DE-m6A regulators between high-BMD women (n = 40) and low-BMD women (n = 40) in the GSE56815 dataset.
Figure 3
Figure 3
Classification of two m6A-related molecular subclusters for OP based on 13 DE-m6A regulators. (A) Heatmap showing the consensus clustering of m6A-related subclusters (k = 2) of OP based on 13 DE-m6A regulators. (B) The t-SNE plot showing the two clustered samples in the OP. Red represents cluster 1, and blue represents cluster 2. (C) Volcano plot showing the DEGs between two m6A-related subclusters. (D) Heatmap indicating the top 100 DEGs between two m6A-related subclusters.
Figure 4
Figure 4
Functional analyses of the m6A-related DEGs. (A–D) The GSEA curves showing the GO (BP, CC, and MF) and KEGG pathways between two m6A-related subclusters. (E, F) Heatmap and bar charts showing the specific signaling pathways in two m6A-related subclusters.
Figure 5
Figure 5
Identification of the OP-related modules by WGCNA. (A) Clustering dendrogram of genes based on the measurement of dissimilarity (1-TOM) together with the assigned module colors. (B) Heatmap showing the correlation between the module eigengenes and clinical traits of OP. (C–G) Scatterplots showing the correlation between the MM and GS in each module (MEblue, MEbrown, MEyellow, MEred, and MEturquoise). (H–L) Scatter plots showing the correlation between the MM and clinical trait (menopause) in each module (MEblue, MEbrown, MEyellow, MEred, and MEturquoise). (M) Bar charts showing the correlation between GS and cluster trait in each module (MEblue, MEbrown, MEyellow, MEred, and MEturquoise). (N) Bar charts showing the correlation between GS and clinical trait (menopause) in each module (MEblue, MEbrown, MEyellow, MEred, and MEturquoise).
Figure 6
Figure 6
Enrichment analysis of the MEbrown module. (A) Bubble plot showing the enrichment of m6A targets in each module (MEblue, MEbrown, MEyellow, MEred, and MEturquoise). (B) Bubble plot indicating the KEGG pathways of MEbrown.
Figure 7
Figure 7
Construction of an m6A regulator–target gene–pathway network and the ceRNA network. (A) A m6A regulator–target–pathway network in MEbrown. Orange rectangles present m6A regulators, turquoise ellipses represent m6A targets, and purple diamonds represent pathways. (B) Two ceRNA networks of OP. One network contained lncRNA TMEM92-AS1, has-miR-375, and HIPK3. Another ceRNA network included seven lncRNAs (XIST, MUC2, NOP14-AS1, INE1, LINC01136, LINC00837, and DLEU2), seven miRNAs (hsa-miR-125a-5p, hsa-miR-125b-5p, hsa-miR-137, hsa-miR-143-3p, hsa-miR-200b-3p, hsa-miR-218-5p, and hsa-miR-3666), and three mRNAs (SMAD4, METTL3, and EGFR). Rectangles represent lncRNAs, quadrangles represent miRNAs, and prisms represent mRNAs.
Figure 8
Figure 8
Identification and validation of the diagnostic markers for OP. (A) LASSO regression coefficient profiles of the 13 m6A regulators. Each curve represents the changing trajectory of each m6A regulator. (B) Tenfold cross-validation for optimal parameter selection in the LASSO model. Each red dot represents a lambda value with a confidence interval. The two dotted lines represent the values at minimum criteria and 1-standard error (1-SE) criteria by 10-fold cross-validation. The x-axis shows the penalization coefficient (log λ). The y-axis shows the partial likelihood deviance values with error bars. (C) The curve of the total within sum of squared error curve under corresponding cluster number k, and it reached the “elbow point” when k = 10. (D) The curve of average silhouette width under corresponding cluster number k, and the maximum of average silhouette width was achieved when k = 10. (E, F) ROC curves validated the performances of the LASSO regression model and the SVM-RFE model. (G) Venn plots show the candidate genes by overlapping the candidate genes selected from the LASSO regression model and the SVM-RFE model. (H, I) Boxplots showing the three differentially expressed m6A regulators (FTO, YTHDF2, and CBLL1) between high-BMD women and low-BMD women in GSE56815 and GSE7158 datasets. (J, K) ROC curves validated the performances of three m6A regulators (FTO, YTHDF2, and CBLL1) for the prediction of OP in GSE56815 and GSE7158 datasets.

References

    1. Salari N, Darvishi N., Bartina Y, Larti M, Kiaei A, Hemmati M, et al. . Global prevalence of osteoporosis among the world older adults: a comprehensive systematic review and meta-analysis. J Orthop Surg Res (2021) 16(1):669. doi: 10.1186/s13018-021-02821-8 - DOI - PMC - PubMed
    1. Osteoporosis prevention, diagnosis, and therapy. Jama (2001) 285(6):785–95. doi: 10.1001/jama.285.6.785 - DOI - PubMed
    1. Kanis JA, Melton LJ, 3rd, Christiansen C, Johnston CC, Khaltaev N. The diagnosis of osteoporosis. J Bone Miner Res (1994) 9(8):1137–41. doi: 10.1002/jbmr.5650090802 - DOI - PubMed
    1. Reid IR. A broader strategy for osteoporosis interventions. Nat Rev Endocrinol (2020) 16(6):333–9. doi: 10.1038/s41574-020-0339-7 - DOI - PubMed
    1. Ghaderi S, Sahaf R, Mohammadi Shahbalaghi F, Ansari G, Gharanjic A, Ashrafi K, et al. . Prevalence of depression in elderly Kurdish community residing in boukan, Iran. (2012) 7(1):57–66.

Publication types