. 2023;60(9-10):2665-2685.
doi: 10.1007/s00382-022-06466-z. Epub 2022 Aug 24.

The mechanism linking the variability of the Antarctic sea ice extent in the Indian Ocean sector to Indian summer monsoon rainfall

Affiliations

The mechanism linking the variability of the Antarctic sea ice extent in the Indian Ocean sector to Indian summer monsoon rainfall

Siti Syairah Atiqah Azhar et al. Clim Dyn. 2023.

Abstract

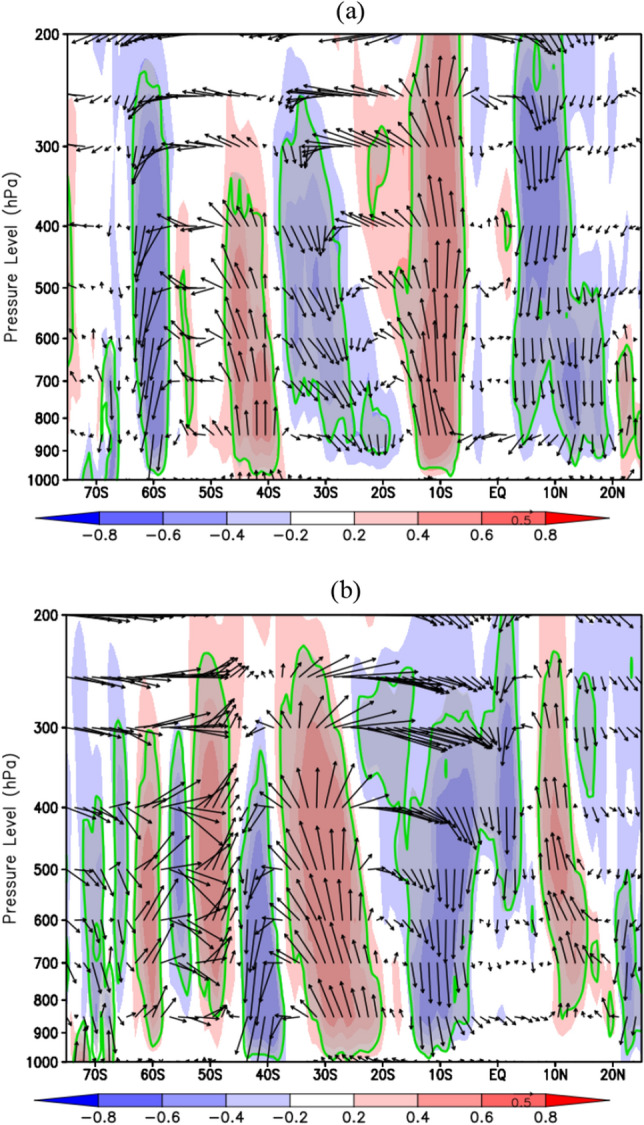
The study investigates the mechanism of teleconnection between the variability of sea ice extent (SIE) in the Indian Ocean sector of the Southern Ocean and the variability of Indian summer monsoon rainfall. We utilized reanalysis, satellite, in-situ observation data, and model output from the coupled model intercomparison project phase 5 (CMIP5) from 1979 to 2013. The empirical orthogonal function (EOF) and correlation analysis show that the first and third modes of principal component (PC1 and PC3) of SIE in the Indian Ocean sector during April-May-June (AMJ) are significantly correlated with the second mode of principal component (PC2) of Indian summer monsoon rainfall. The reanalysis data revealed that the changes in the SIE in the Indian Ocean sector excite meridional wave train responses along the Indian Ocean for both principal component modes. Positive (negative) SIE anomalies based on first and third EOFs (EOF1 and EOF3), contribute to the strengthening (weakening) of the Polar, Ferrel, and Hadley cells, inducing stronger (weaker) convective activity over the Indian latitudes. The stronger (weaker) convective activity over the Indian region leads to more (less) rainfall over the region during high (low) ice phase years. Furthermore, a stronger (weaker) polar jet during the high (low) ice phase is also noted. The selected CMIP5 models captured certain atmospheric teleconnection features found in the reanalysis. During AMJ, the SIE simulated by the NorESM1-M model was significantly positively correlated with Indian summer monsoon rainfall, whereas the IPSL-CM54-LR model showed a negative correlation.

Keywords: Antarctic sea ice extent (SIE) in the Indian Ocean sector; Convective activity; High ice phase; Indian summer monsoon rainfall; Low ice phase.


Conflict of interest statement

Conflict of interestThe authors have no relevant financial or non-financial interests to disclose.

Figures

Fig. 1
Fig. 1
The spatial pattern of three leading EOF modes of SIE (ac) (unit: %) in AMJ and precipitation (df) (unit: mm/year) in JJAS. The correlation between the g PC1, h PC3 time series of AMJ SIE in the Indian Ocean sector (black) with the PC2 time series of precipitation over the Indian region (grey) from 1979 to 2013, statistically significant at p < 0. 05
Fig. 2
Fig. 2
The regressed anomalous contour of geopotential height (shaded and contour, unit: m) for 35 years superimposed with the composite difference of wave–activity flux (unit: m2s−2) for high and low phases of EOF1/EOF3 corresponding to a PC1, b PC3 time series of AMJ SIE in the Indian Ocean sector during MJJ at 250 hPa
Fig. 3
Fig. 3
The vertical profile of composite difference of zonal wind average for high and low phases of EOF1/EOF3 (unit: ms−1, averaged over 55° E–85° E) corresponding to a PC1, b PC3 time series of AMJ SIE in the Indian Ocean sector. The shaded area in grey and solid lines in green are statistically significant at p < 0.05
Fig. 4
Fig. 4
The composite difference of zonal(shaded) wind (streamlines) anomalies at 250 hPa (unit: ms−1) for high and low phases of EOF1/EOF3 and corresponding to a PC1, b PC3 time series of AMJ SIE in the Indian Ocean sector. The shaded area in grey and solid lines in green are statistically significant at p < 0.05
Fig. 5
Fig. 5
The composites difference of meridional circulation averaged over the Indian Ocean longitudinal belt of 55° E–85° E, for high and low phases of EOF1/EOF3 corresponding to a PC1, b PC3 time series of AMJ SIE in the Indian Ocean sector. The shaded plot is the vertical velocity anomaly (unit: Pa/s, scaled by − 0.01) and superimposed by the vectors of meridional component wind (unit: ms−1) and vertical velocity anomalies. The shaded area in grey and solid lines in green are statistically significant at p < 0.05
Fig. 6
Fig. 6
The composites difference of OLR anomalies (unit: W/m2) for high and low phases of EOF1/EOF3 corresponding to a PC1, b PC3 time series of AMJ SIE in the Indian Ocean sector during Indian summer monsoon rainfall. The shaded area in grey is statistically significant at p < 0.05
Fig. 7
Fig. 7
The composite difference of precipitation anomalies (unit: mm/year) for high and low phases of EOF1/EOF3 corresponding to a PC1, b PC3 time series of AMJ SIE in the Indian Ocean sector during Indian summer monsoon rainfall. The shaded area in grey and solid lines in green are statistically significant at p < 0.05
Fig. 8
Fig. 8
The correlation of zonal wind between the ERA-Interim reanalysis and CMIP5 models during MJJ for high ice phase years at level 250 hPa. The shaded area in grey and solid lines in green are statistically significant at p < 0.05
Fig. 9
Fig. 9
The correlation of zonal wind anomalies between the ERA- Interim reanalysis and CMIP5 models during MJJ for low ice phase years at level 250 hPa. The shaded area in grey and solid lines in green are statistically significant at p < 0.05
Fig. 10
Fig. 10
The correlation coefficient of zonal wind anomalies between the ERA- Interim reanalysis and CMIP5 models during MJJ for a the high ice phase years and b the low ice phase years from the study area (lon: 55° E–85° E, lat: 30° S–60° S) at 250 hPa
Fig. 11
Fig. 11
The spatial correlation between the sea ice (CMIP5 models and HadISST dataset) with Indian summer monsoon rainfall (GPCP). The shaded area in grey and solid lines in green are statistically significant at p < 0.05
Fig. 12
Fig. 12
The regressed anomalous contour of geopotential height anomalies (shaded, unit: m) for 35 years superimposed with the composite difference of high and low ice phase years of wave–activity flux (vector, unit: m2s−2) during MJJ at 250 hPa for the NorESM1-M and IPSL–CM5A-LR models
Fig. 13
Fig. 13
The vertical profile of composite difference of high and low ice phase years of zonal wind average (unit: ms−1, averaged over 55° E–85° E) for a NorESM1-M and b IPSL–CM5A-LR models. The shaded area in grey and solid lines in green are statistically significant at p < 0.05
Fig. 14
Fig. 14
The composite difference of high and low ice phase years of zonal wind anomaly (shaded) superimposed with wind anomaly (streamlines) at 250 hPa (unit: ms−1) for a NorESM1-M and b IPSL–CM5A-LR models. The shaded area in grey and solid lines in green are statistically significant at p < 0.05
Fig. 15
Fig. 15
The composites difference of high and low ice phase years of anomalous meridional circulation averaged over the Indian Ocean longitudinal belt of 55° E–85° E for the NorESM1-M and IPSL–CM5A-LR models. The shaded plot is the vertical velocity (unit: Pa/s, scaled by − 0.01) and superimposed by the vectors of meridional component wind (unit: ms−1) and vertical velocity anomalies. The shaded area in grey and solid lines in green are statistically significant at p < 0.05
Fig. 16
Fig. 16
The composite difference of high and low ice phase years of OLR anomaly (unit: W/m2) for the a NorESM1-M & b IPSL–CM5A-LR models during Indian summer monsoon rainfall. The shaded area in grey is statistically significant at p < 0.05
Fig. 17
Fig. 17
The schematic diagram of the mechanism of teleconnection during high ice phase years

References

    1. Azhar SS, Chenoli SN, Samah AA, Kim SJ. The linkage between Antarctic sea ice extent and Indian summer monsoon rainfall. Polar Sci. 2020;25(100537):1–10. doi: 10.1016/j.polar.2020.100537. - DOI
    1. Bajish CC, Jena B, Anilkumar N. Is the Indian monsoon rainfall linked to the Southern Ocean sea ice conditions? Weather Clim Extrem. 2021;34(100377):1–8.
    1. Bi D, Dix M, Marsland SJ, O’Farrell S, Rashid HA, Uotila P, Hirst AC, Kowalczyk E, Golebiewski M, Sullivan A, Yan H, Hanna N, Franklin C, Sun Z, Vohralik P, Watterson I, Zhou X, Fiedler R, Collier M, Ma Y, Noonan J, Stevens L, Uhe P, Zhu H, Hill R, Harris C, Griffies S, Puri K. The ACCESS coupled model: description, control climate and preliminary validation. Aust Met Oceanog J. 2013;63:41–64. doi: 10.22499/2.6301.004. - DOI
    1. Blackport R, Screen JA. Insignificant effect of Arctic amplification on the amplitude of midlatitude atmospheric waves. Sci Adv. 2020;6(8):1–9. doi: 10.1126/sciadv.aay2880. - DOI - PMC - PubMed
    1. Bracegirdle T, Holmes C, Holland P. Compensating biases and a noteworthy success in the CMIP5 representation of Antarctic sea ice processes. Geophys Res Lett. 2019;46:4299–4307. doi: 10.1029/2018GL081796. - DOI

LinkOut - more resources