Review
. 2022 Aug 16;72(9):889-907.
doi: 10.1093/biosci/biab134. eCollection 2022 Sep.

Cross-Site Comparisons of Dryland Ecosystem Response to Climate Change in the US Long-Term Ecological Research Network

Affiliations
Review

Cross-Site Comparisons of Dryland Ecosystem Response to Climate Change in the US Long-Term Ecological Research Network

Amy R Hudson et al. Bioscience. .

Abstract

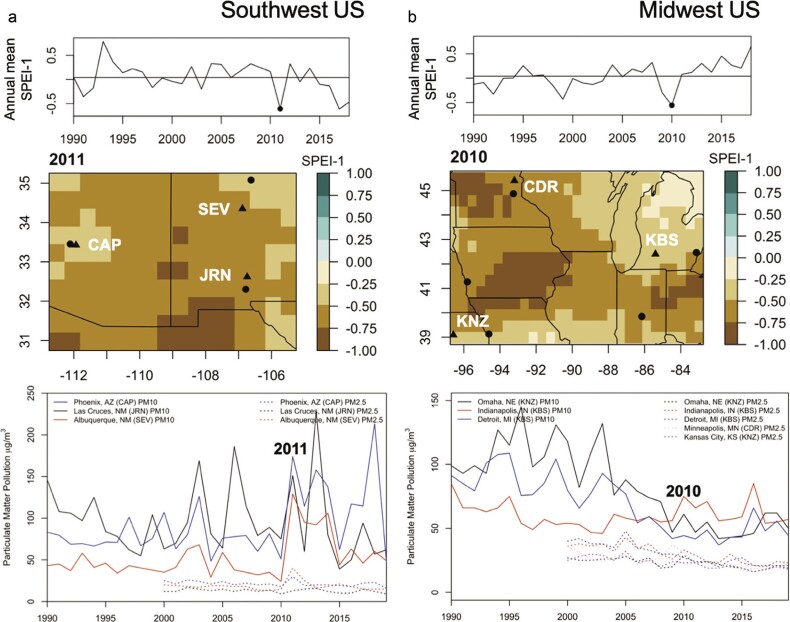
Long-term observations and experiments in diverse drylands reveal how ecosystems and services are responding to climate change. To develop generalities about climate change impacts at dryland sites, we compared broadscale patterns in climate and synthesized primary production responses among the eight terrestrial, nonforested sites of the United States Long-Term Ecological Research (US LTER) Network located in temperate (Southwest and Midwest) and polar (Arctic and Antarctic) regions. All sites experienced warming in recent decades, whereas drought varied regionally with multidecadal phases. Multiple years of wet or dry conditions had larger effects than single years on primary production. Droughts, floods, and wildfires altered resource availability and restructured plant communities, with greater impacts on primary production than warming alone. During severe regional droughts, air pollution from wildfire and dust events peaked. Studies at US LTER drylands over more than 40 years demonstrate reciprocal links and feedbacks among dryland ecosystems, climate-driven disturbance events, and climate change.

Keywords: ANPP; LTER; climate change; disturbance; drought; wildfire.


Figures

Figure 1.
Figure 1.
Dryland systems overview of key drivers, ecosystem responses, services, and feedbacks. Anthropogenic warming interacts with natural variability to drive climate change across the globe. Broadscale climate drivers and human driven land use (e.g., prescribed burns or tilled versus untilled agricultural systems) then interact with the landscape to create local changes in temperature and precipitation, which contribute to wildfire, dust storms, and flooding events further dependent on the landscape. We highlight in this article the ecosystem response of primary production, specifically aboveground net primary production (ANPP), with side stories into how ANPP response coincides with plant species composition. Ecosystem services are supporting, regulating, and provisioning. Some processes, such as air quality and carbon sequestration then feedback to local to regional energy and water budgets and global CO2 concentrations.
Figure 2.
Figure 2.
The geographic location, productivity, and climate of eight dryland US LTER sites. (a) Site-based photographs. (b) Site locations within the United States and each pole. (c) Site-level mean annual precipitation (MAP; x-axis) ranges from 200 to 900 millimeters per year, mean annual temperature (MAT; y-axis) ranges from –23 to 18 degrees Celsius, and long-term mean annual aboveground net primary productivity (ANPP, indicated by circle size) ranges from 35 to 565 grams per square meter per year across sites. CAP does not have ANPP measures and is indicated by a square. Photographs: The site-based photographs were obtained from https://lternet.edu/site-image-galleries; the ARC and CAP CC BY-SA 4.0., JRN E Zambello/LTER-NCO CC BY 4.0, CDR photo by Jacob Miller, and KNZ photo by Jill Haukos.
Figure 3.
Figure 3.
Annual average minimum and maximum temperature for the region surrounding each site. The sites are organized by mean annual temperature, with the warmest at the top and the coldest at the bottom. The top three are US Southwest sites, the middle three are US Midwest sites, and the bottom two are Arctic and Antarctic sites. (a) Minimum and (b) maximum temperatures. The dots indicate values that are 1.5 times the standard deviation above (red points) and below (blue points) the long-term mean (dashed line) for each site. The red histogram (right axis) designates the number of positive temperature anomalies per period for five periods of 18 years each.
Figure 4.
Figure 4.
Site-based observations of dryland production and corresponding total annual precipitation. Total aboveground production (in grams per square meter per year) in grey vertical bars, and precipitation (in millimeters per year) in blue lines. Horizontal blue line designates the average precipitation over the period shown. The asterisk (*) under the ANPP bars at CDR designates estimates of ANPP that were derived from a nearby plot. (a) JRN, (b) SEV, (c) KNZ, (d) CDR, and (e) KBS. Increased annual precipitation generally corresponds to larger primary production across temperate sites (f).
Figure 5.
Figure 5.
Long-term patterns in drought (SPEI) at dryland sites where data were available (MCM excluded). Annual averages of monthly SPEI, where positive values (teal) designate wetter conditions (precipitation is greater than potential evapotranspiration; P > PET), whereas negative values (brown) designate drought conditions (P < PET). (a) Southwestern sites (CAP, JRN, SEV) and modes of climate variability: the Pacific Decadal Oscillation (PDO) index (www.ncdc.noaa.gov/teleconnections/pdo, Mantua et al. 1997), and the El Niño Southern Oscillation (ENSO) index (Nino 3.4; https://psl.noaa.gov/gcos_wgsp/Timeseries/Nino34, Rayner et al. 2003). Teal shading indicates the positive phase of the PDO, which generally coincides with wetter conditions at Southwest sites. (b) Midwestern sites (KNZ, KBS, CDR), and (c) Arctic site (ARC). Grey shading from 1980 to the present indicate the beginning of the US LTER program and the 1980 s regime shift.
Figure 6.
Figure 6.
Comparisons of drought and air quality for Southwest and Midwest regions. (a) Southwest (31 N to 35 N and –113E to –107E) and (b) Midwest (39 N to 46 N and –97E to –82E) regions. (top) A time series from 1990–2019 of annual SPEI 1-month anomalies averaged within regions. (middle) The SPEI values are color coded for the 2011 drought in Southwest and 2010 drought in Midwest; US LTER sites are shown as triangles, and nearby cities where air quality was recorded are shown as black points. (bottom) The atmospheric concentration (in micrograms per cubic meter) of coarse particulate matter (PM10, solid lines) and fine particulate matter (PM2.5, dashed lines) pollution at cities designated in middle panel.
Figure 7.
Figure 7.
Wildland burned in the Southwest United States over the past 20 years. The total number of hectares burned was divided by the number of fires for each year from 2001–2020 in the Southwest United States. Fires include both lightning and human-caused fires. The Southwest geographic area is defined by the National Interagency Coordination Center and Fire Center as the states of Arizona and New Mexico and federal lands within Texas and Oklahoma west of the 100th meridian. The 2011 peak in hectares per fire event corresponds with the 2011 regional drought for the southwest and regional peaks in low air quality (figure 6a).
Figure 8.
Figure 8.
Arctic tundra landscape response to wildfire and corresponding low streamflow in 2007. Photographs taken in late May of 2008 at the control site (left) looking north toward the severely burned site (right) after the 2007 Anaktuvuk River Burn. This fire burned over 1039 square kilometers on the north slope of Alaska from late July to early October 2007 when it was finally extinguished by cooler temperatures and the first snowfall of the year. Annual mean streamflow (in cubic meters per second per year) at the US Geological Survey gauge Kuparuk River near Deadhorse was low in 2007 and 2008, indicating corresponding drought conditions.
Figure 9.
Figure 9.
Dust storm (haboob) over CAP in 2015. CAP is in Tempe, Arizona. Photograph: Eagar and colleagues (2017), taken by A. Anbar.
Figure 10.
Figure 10.
Antarctic stream biomass response to warming-induced flooding event in 2001–2002. The vertical dashed line at 2001–2002 in panels (a), (b), and (c) designates the large melt event. In 2001–2002, mean summer (DJF) air temperature and incoming solar radiation peaked (a) and caused the largest annual volumes of stream flow observed on nine streams in the Lake Fryxell basin over the entire period of reference (1988–2013) (b). (c) Stream cyanobacterial mat ash-free dry mass (average ash free dry mass in grams per square meter) of orange (Phormidium-dominated) and black (Nostoc-dominated) mats from permanent transects on four streams in the Lake Fryxell basin were lower the year following the large melt event. Stream biomass had been decreasing over the decade leading up to 2001–2002, corresponding with cooler conditions at the site. Black mat biomass recovered 10 years after the flooding event in 2001, even though climate drivers (a) were stationary. Panels (a)–(c) are revised from Gooseff and colleagues (2017).(d) Photograph: C. Lynch of the upstream view of the 1986–87 January flooding, Figure 81 in Chinn and Mason (2016).

Similar articles

Cited by

References

    1. Abbott BW, et al. 2021. Tundra wildfire triggers sustained lateral nutrient loss in Alaskan Arctic. Global Change Biology 27: 1408–1430. - PubMed
    1. Abraha M, Chen J, Chu H, Zenone T, John R, Su Y-J, Hamilton SK, Robertson GP.. 2015. Evapotranspiration of annual and perennial biofuel crops in a variable climate. GCB Bioenergy 7: 1344–1356.
    1. Ahlström A, et al. 2015. The dominant role of semi-arid ecosystems in the trend and variability of the land CO2 sink. Science 348: 895–899. - PubMed
    1. Alvarez LJ, Epstein HE, Li J, Okin GS.. 2012. Aeolian process effects on vegetation communities in an arid grassland ecosystem. Ecology and Evolution 2: 809–821. - PMC - PubMed
    1. Andriuzzi WS, Adams BJ, Barrett JE, Virginia RA, Wall DH.. 2018. Observed trends of soil fauna in the Antarctic Dry Valleys: Early signs of shifts predicted under climate change. Ecology 99: 312–321. - PubMed