. 2022 Jul;1(7):649-664.
doi: 10.1038/s44161-022-00094-w. Epub 2022 Jul 11.

Neutrophils incite and macrophages avert electrical storm after myocardial infarction

Affiliations

Neutrophils incite and macrophages avert electrical storm after myocardial infarction

Jana Grune et al. Nat Cardiovasc Res. 2022 Jul.

Abstract

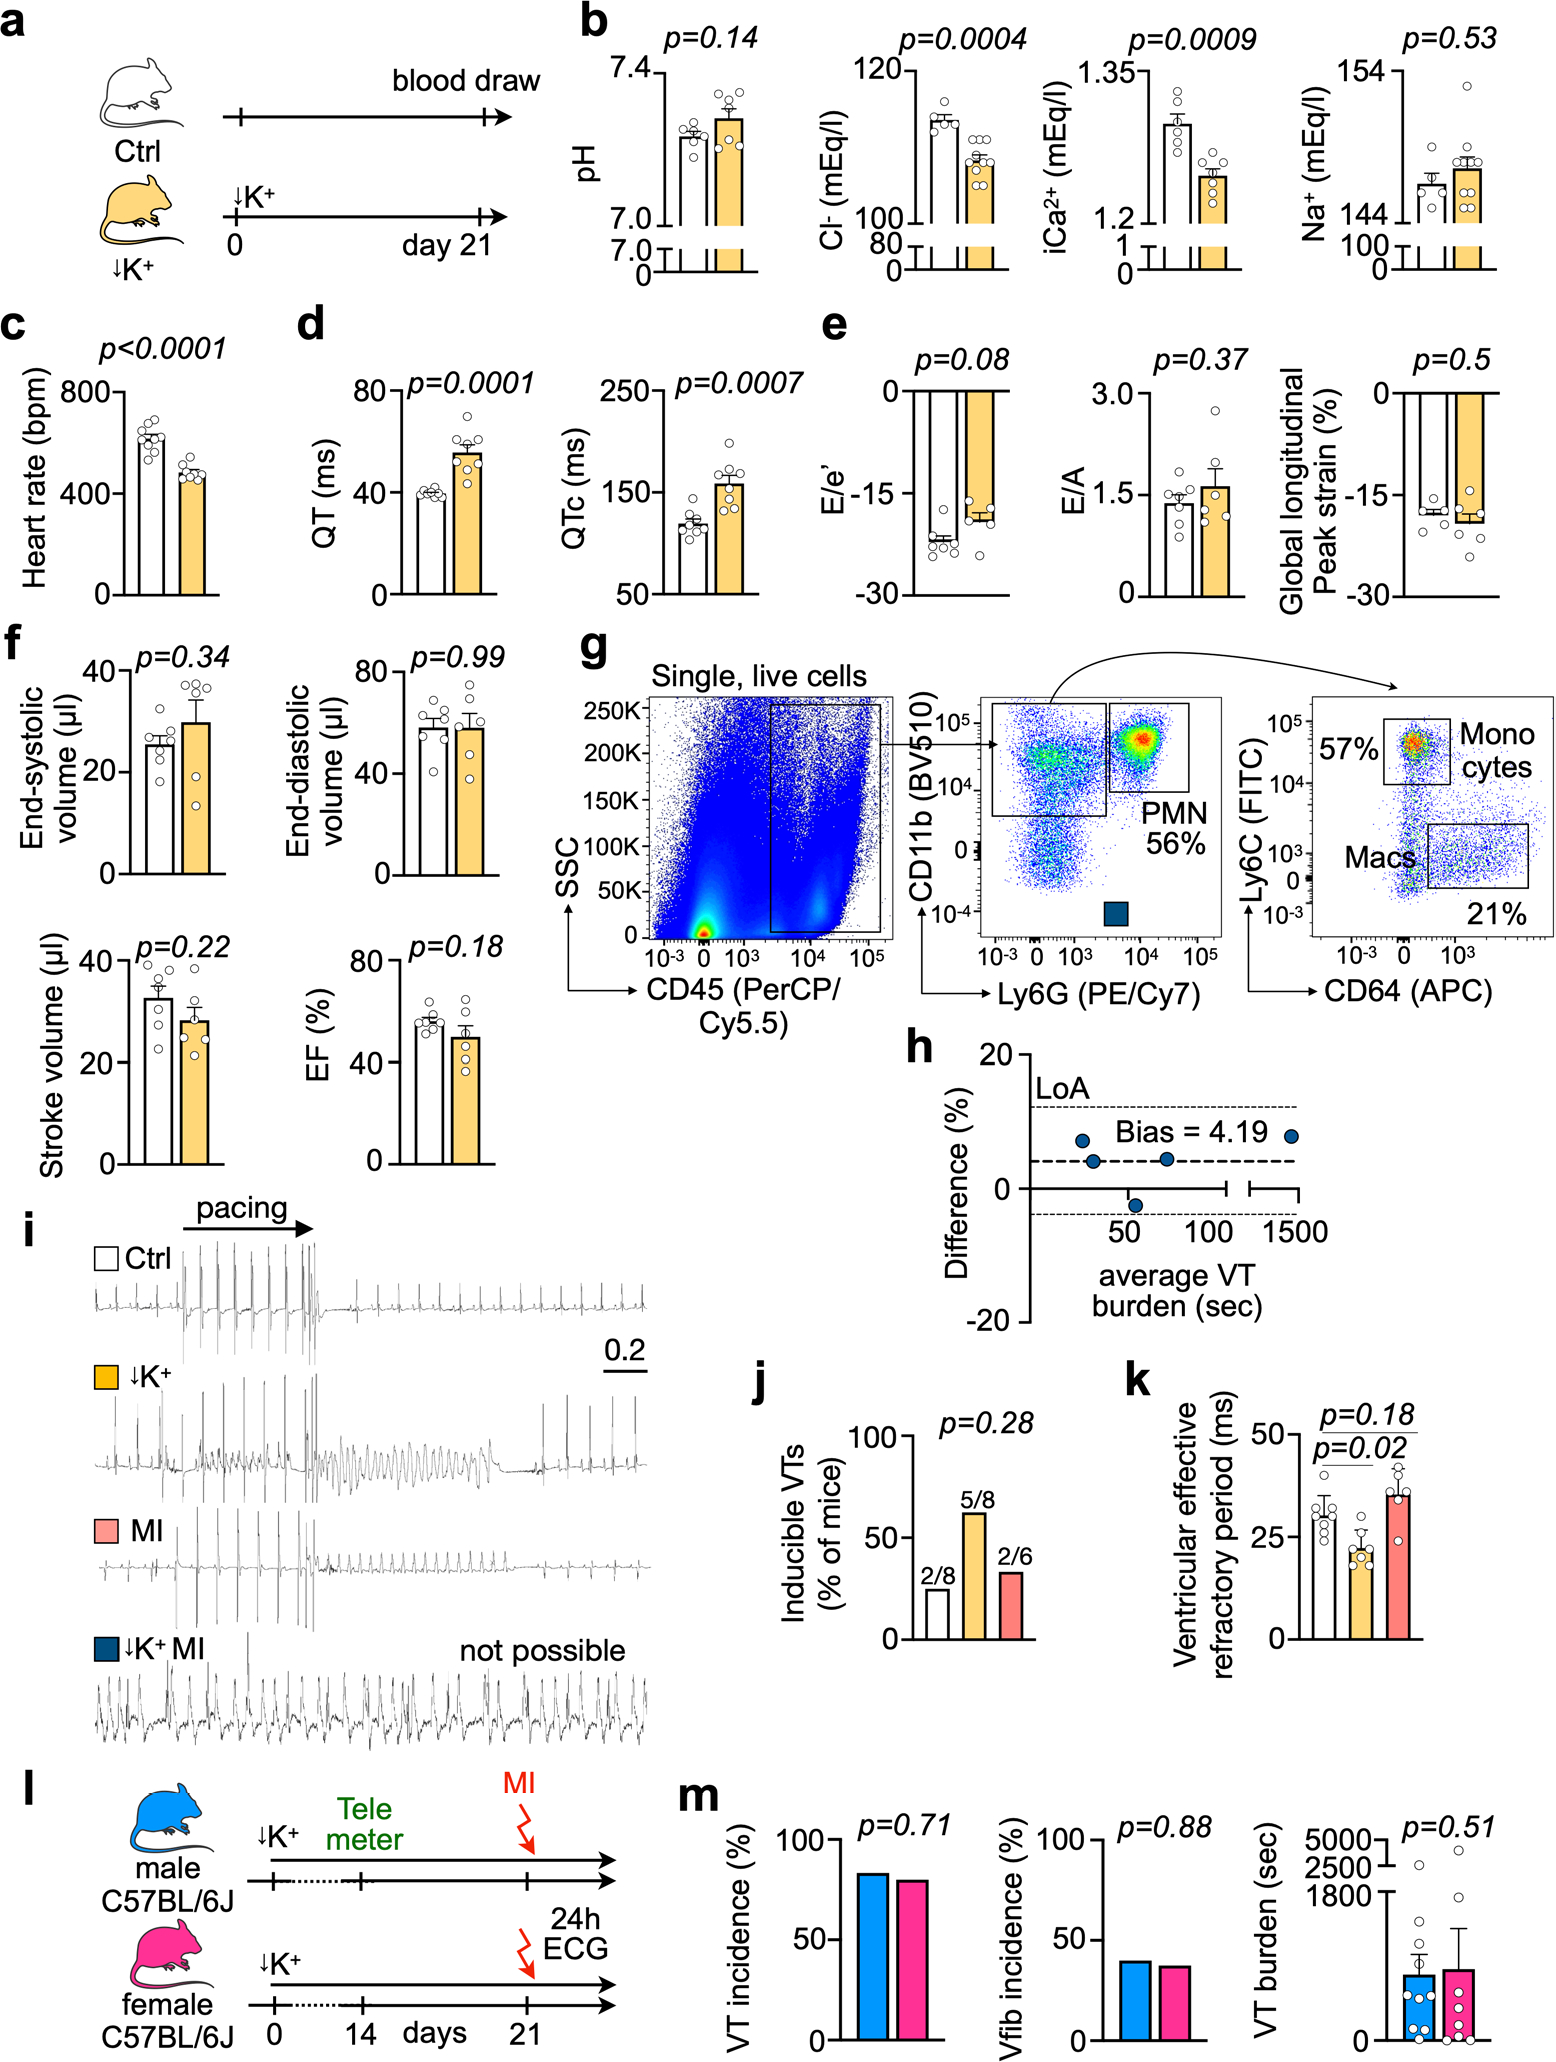
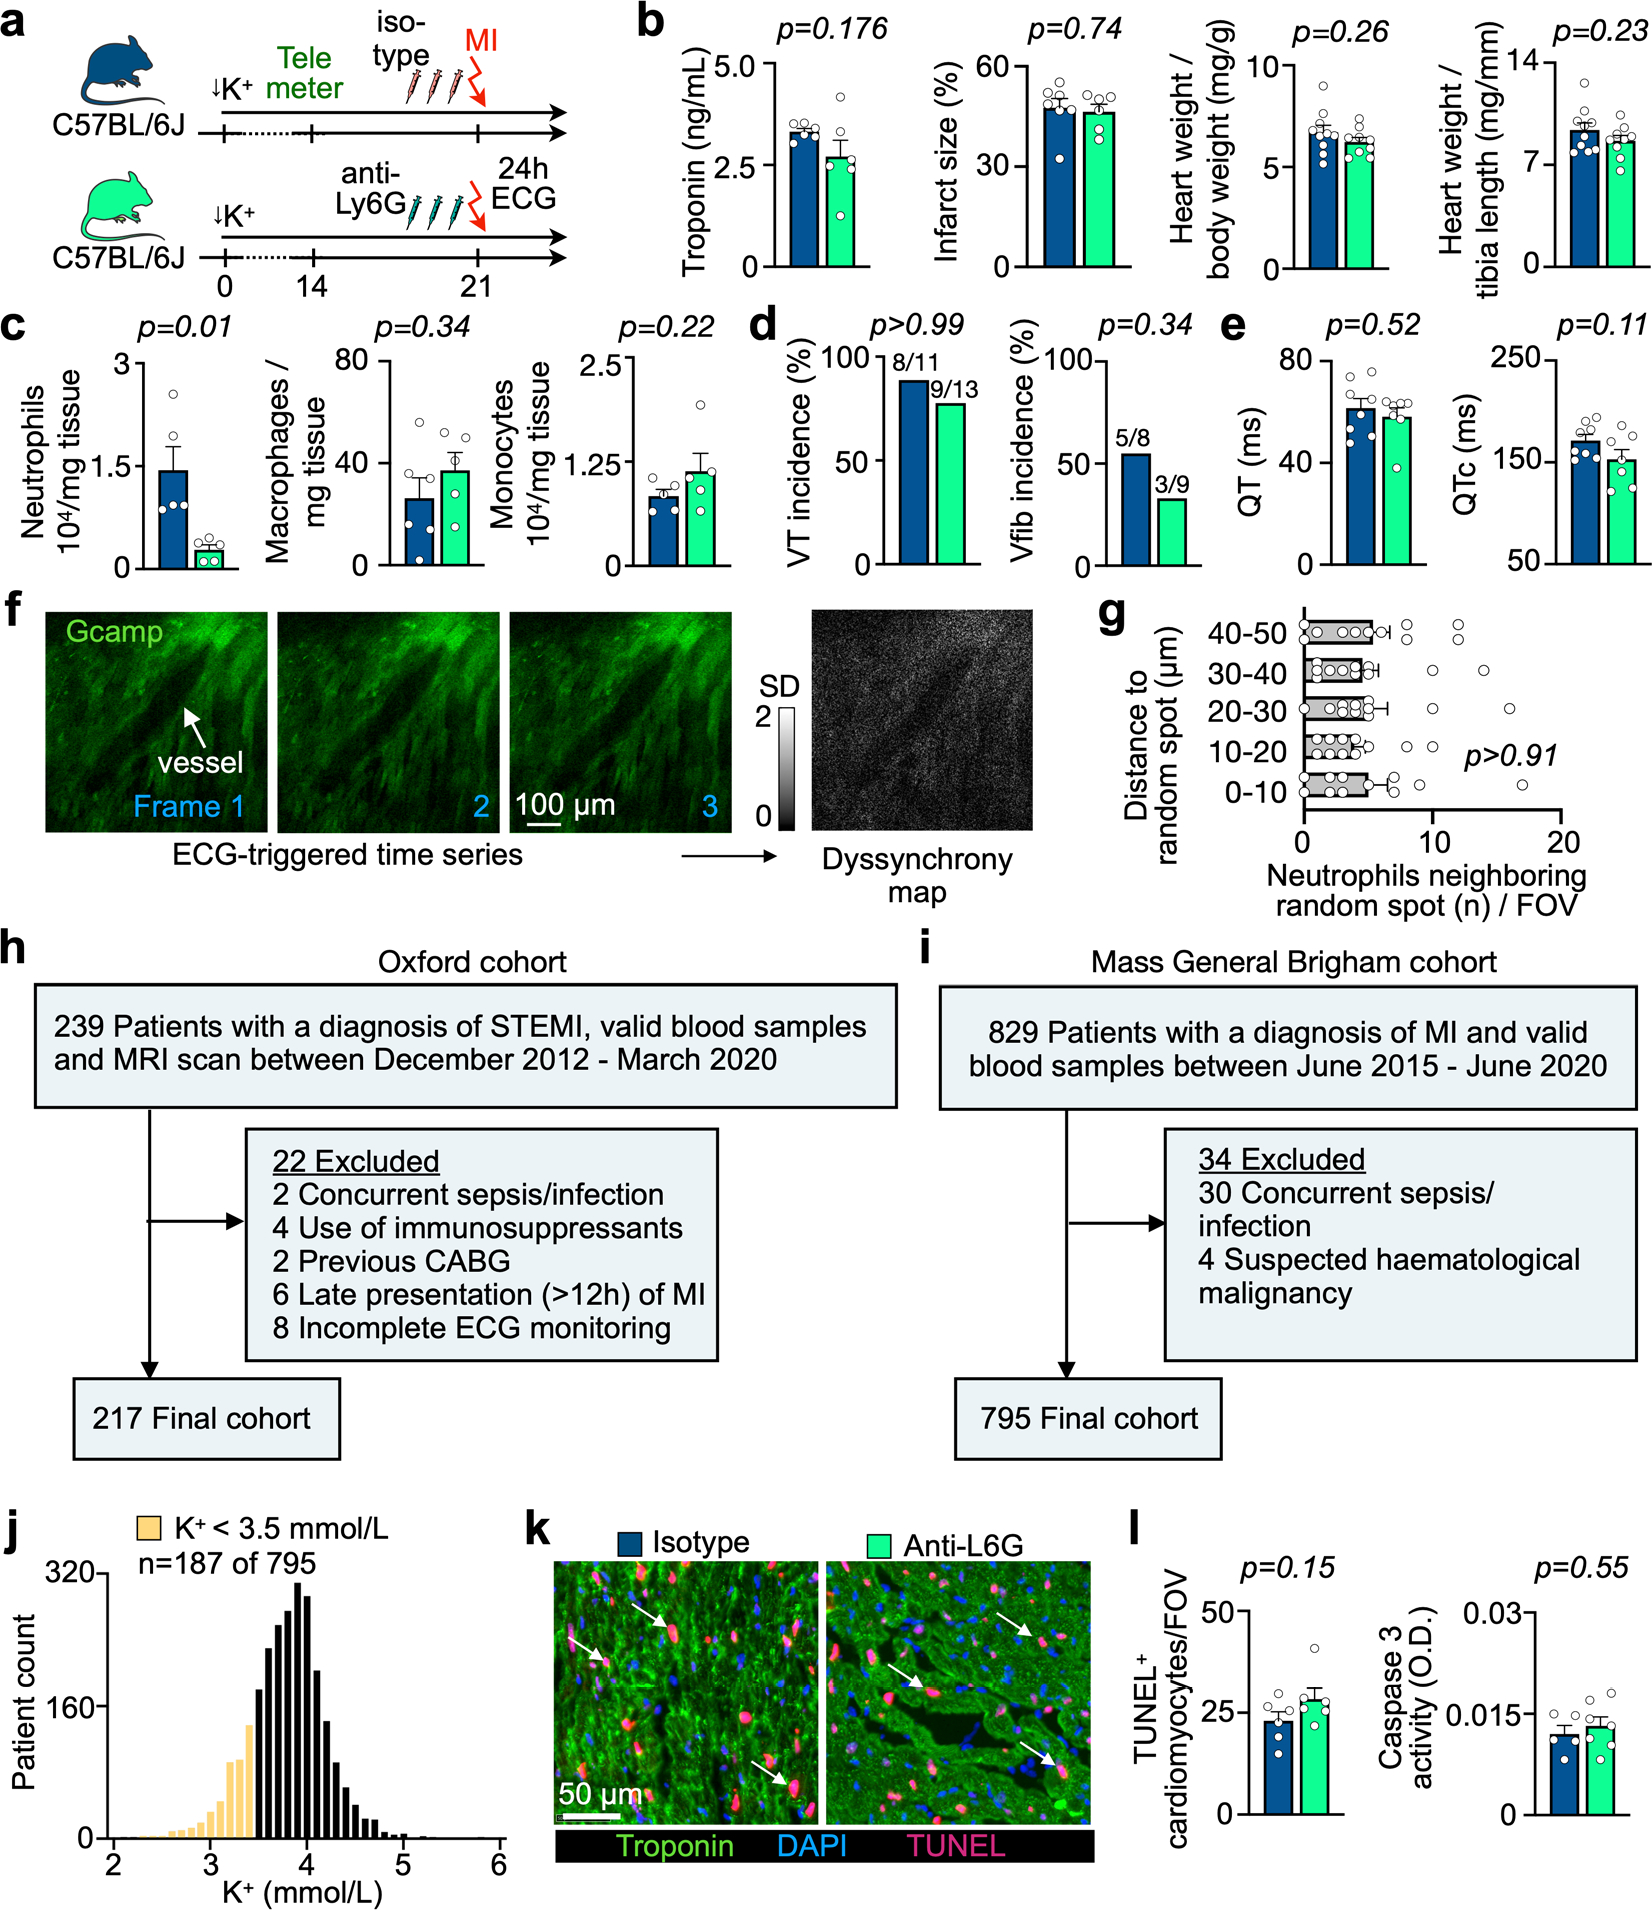
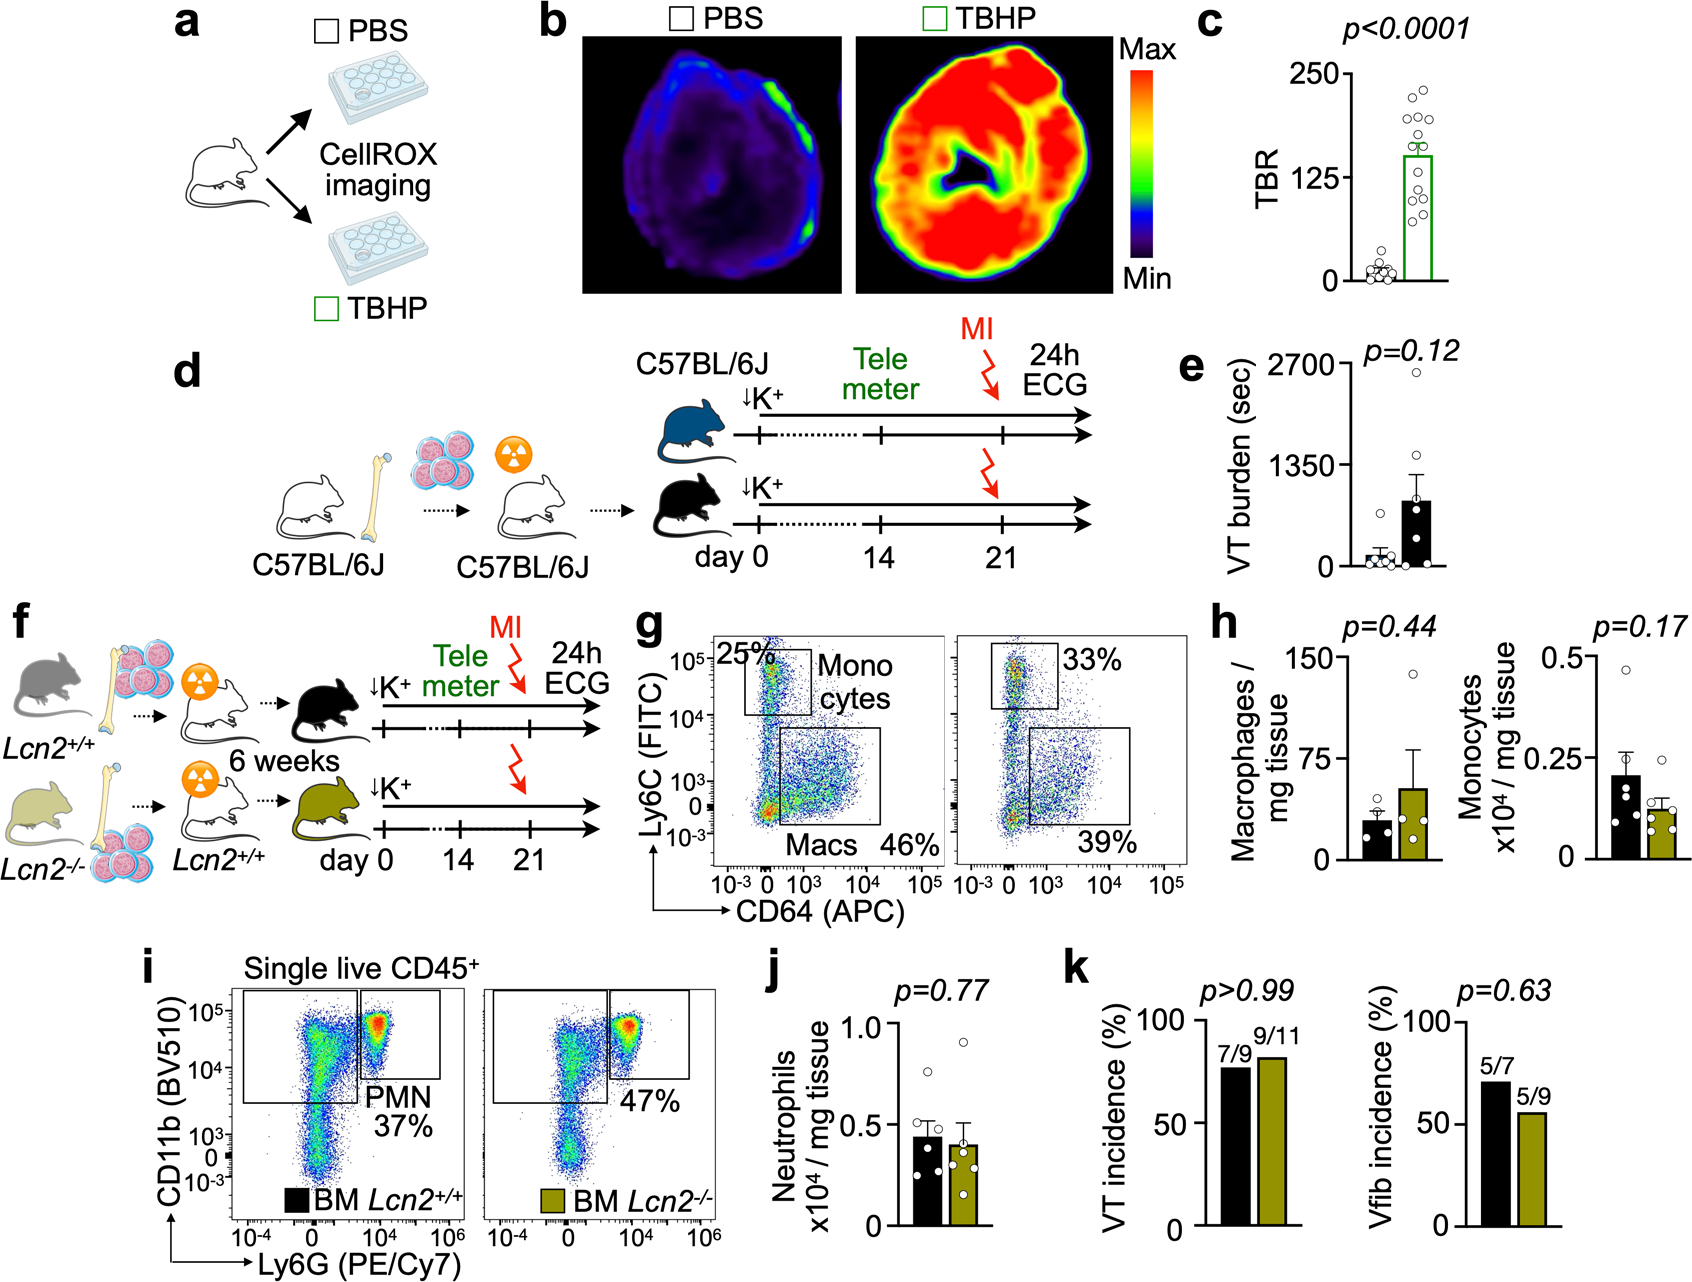
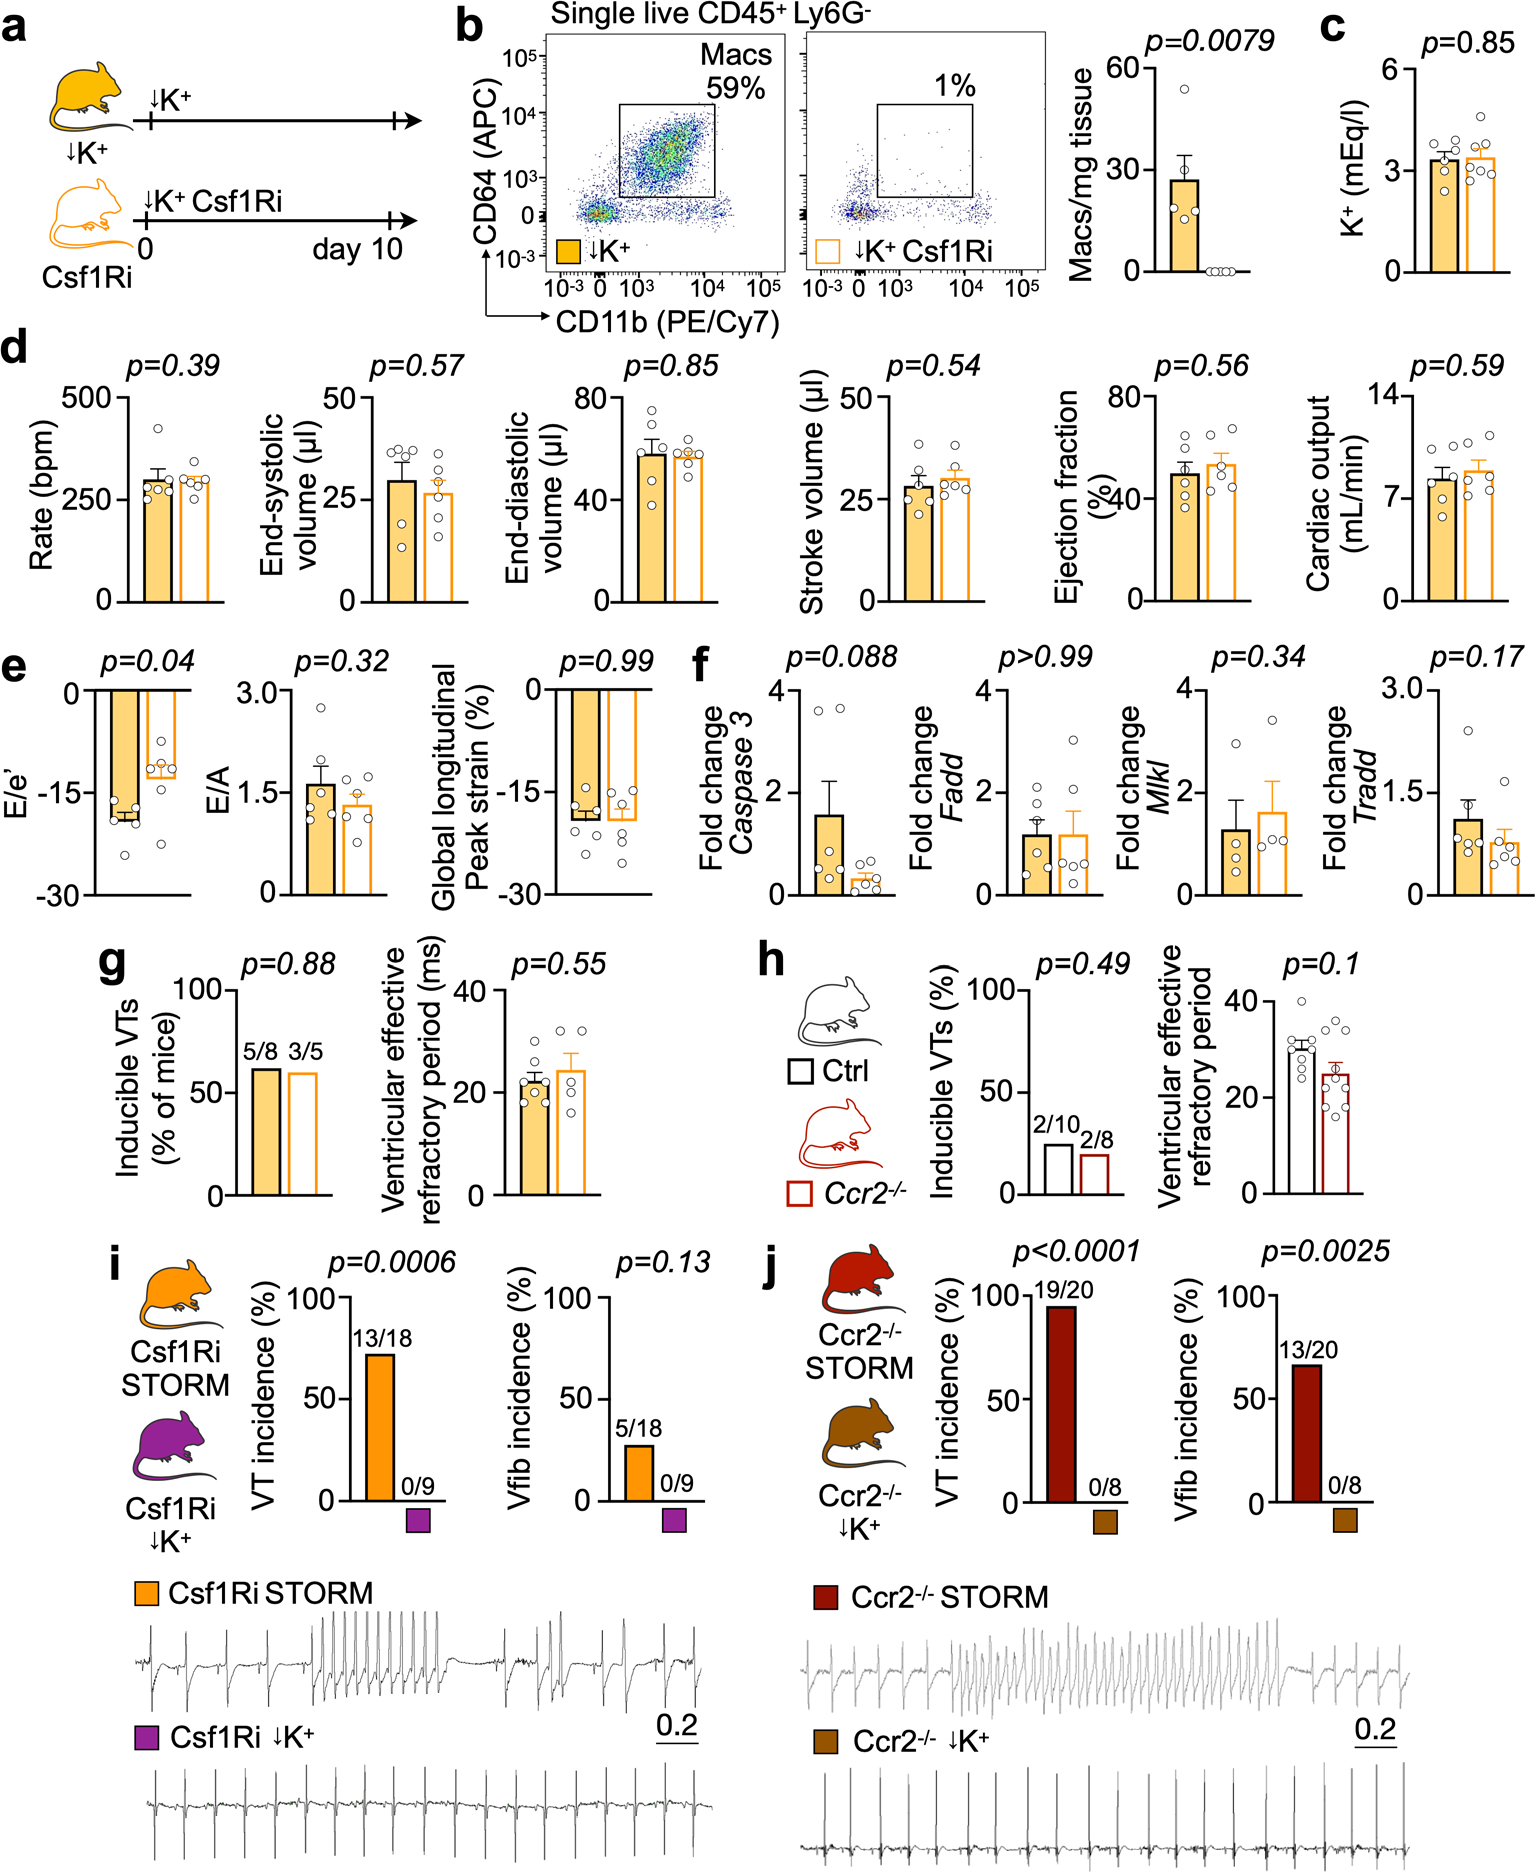
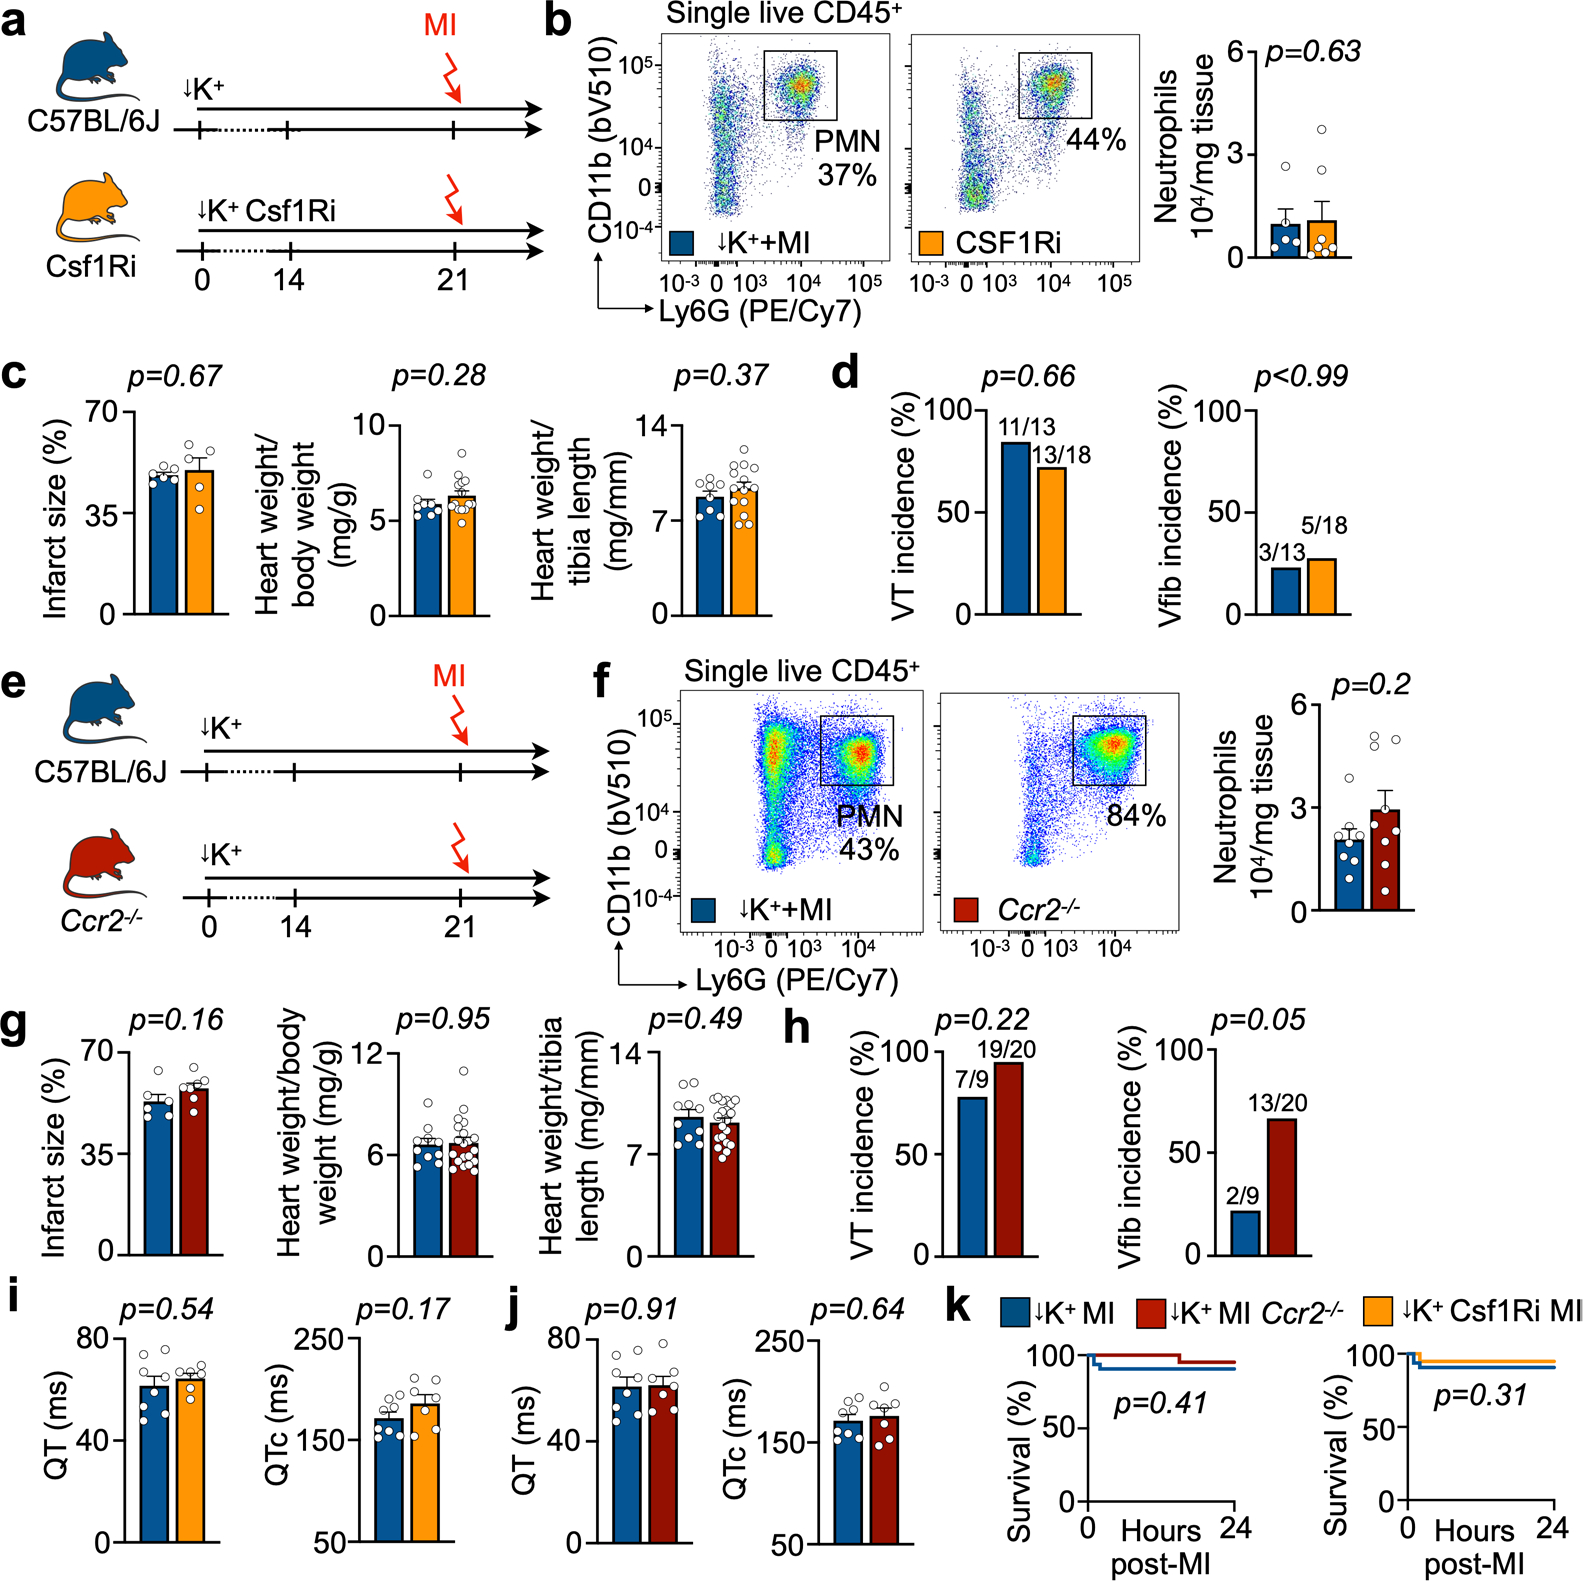
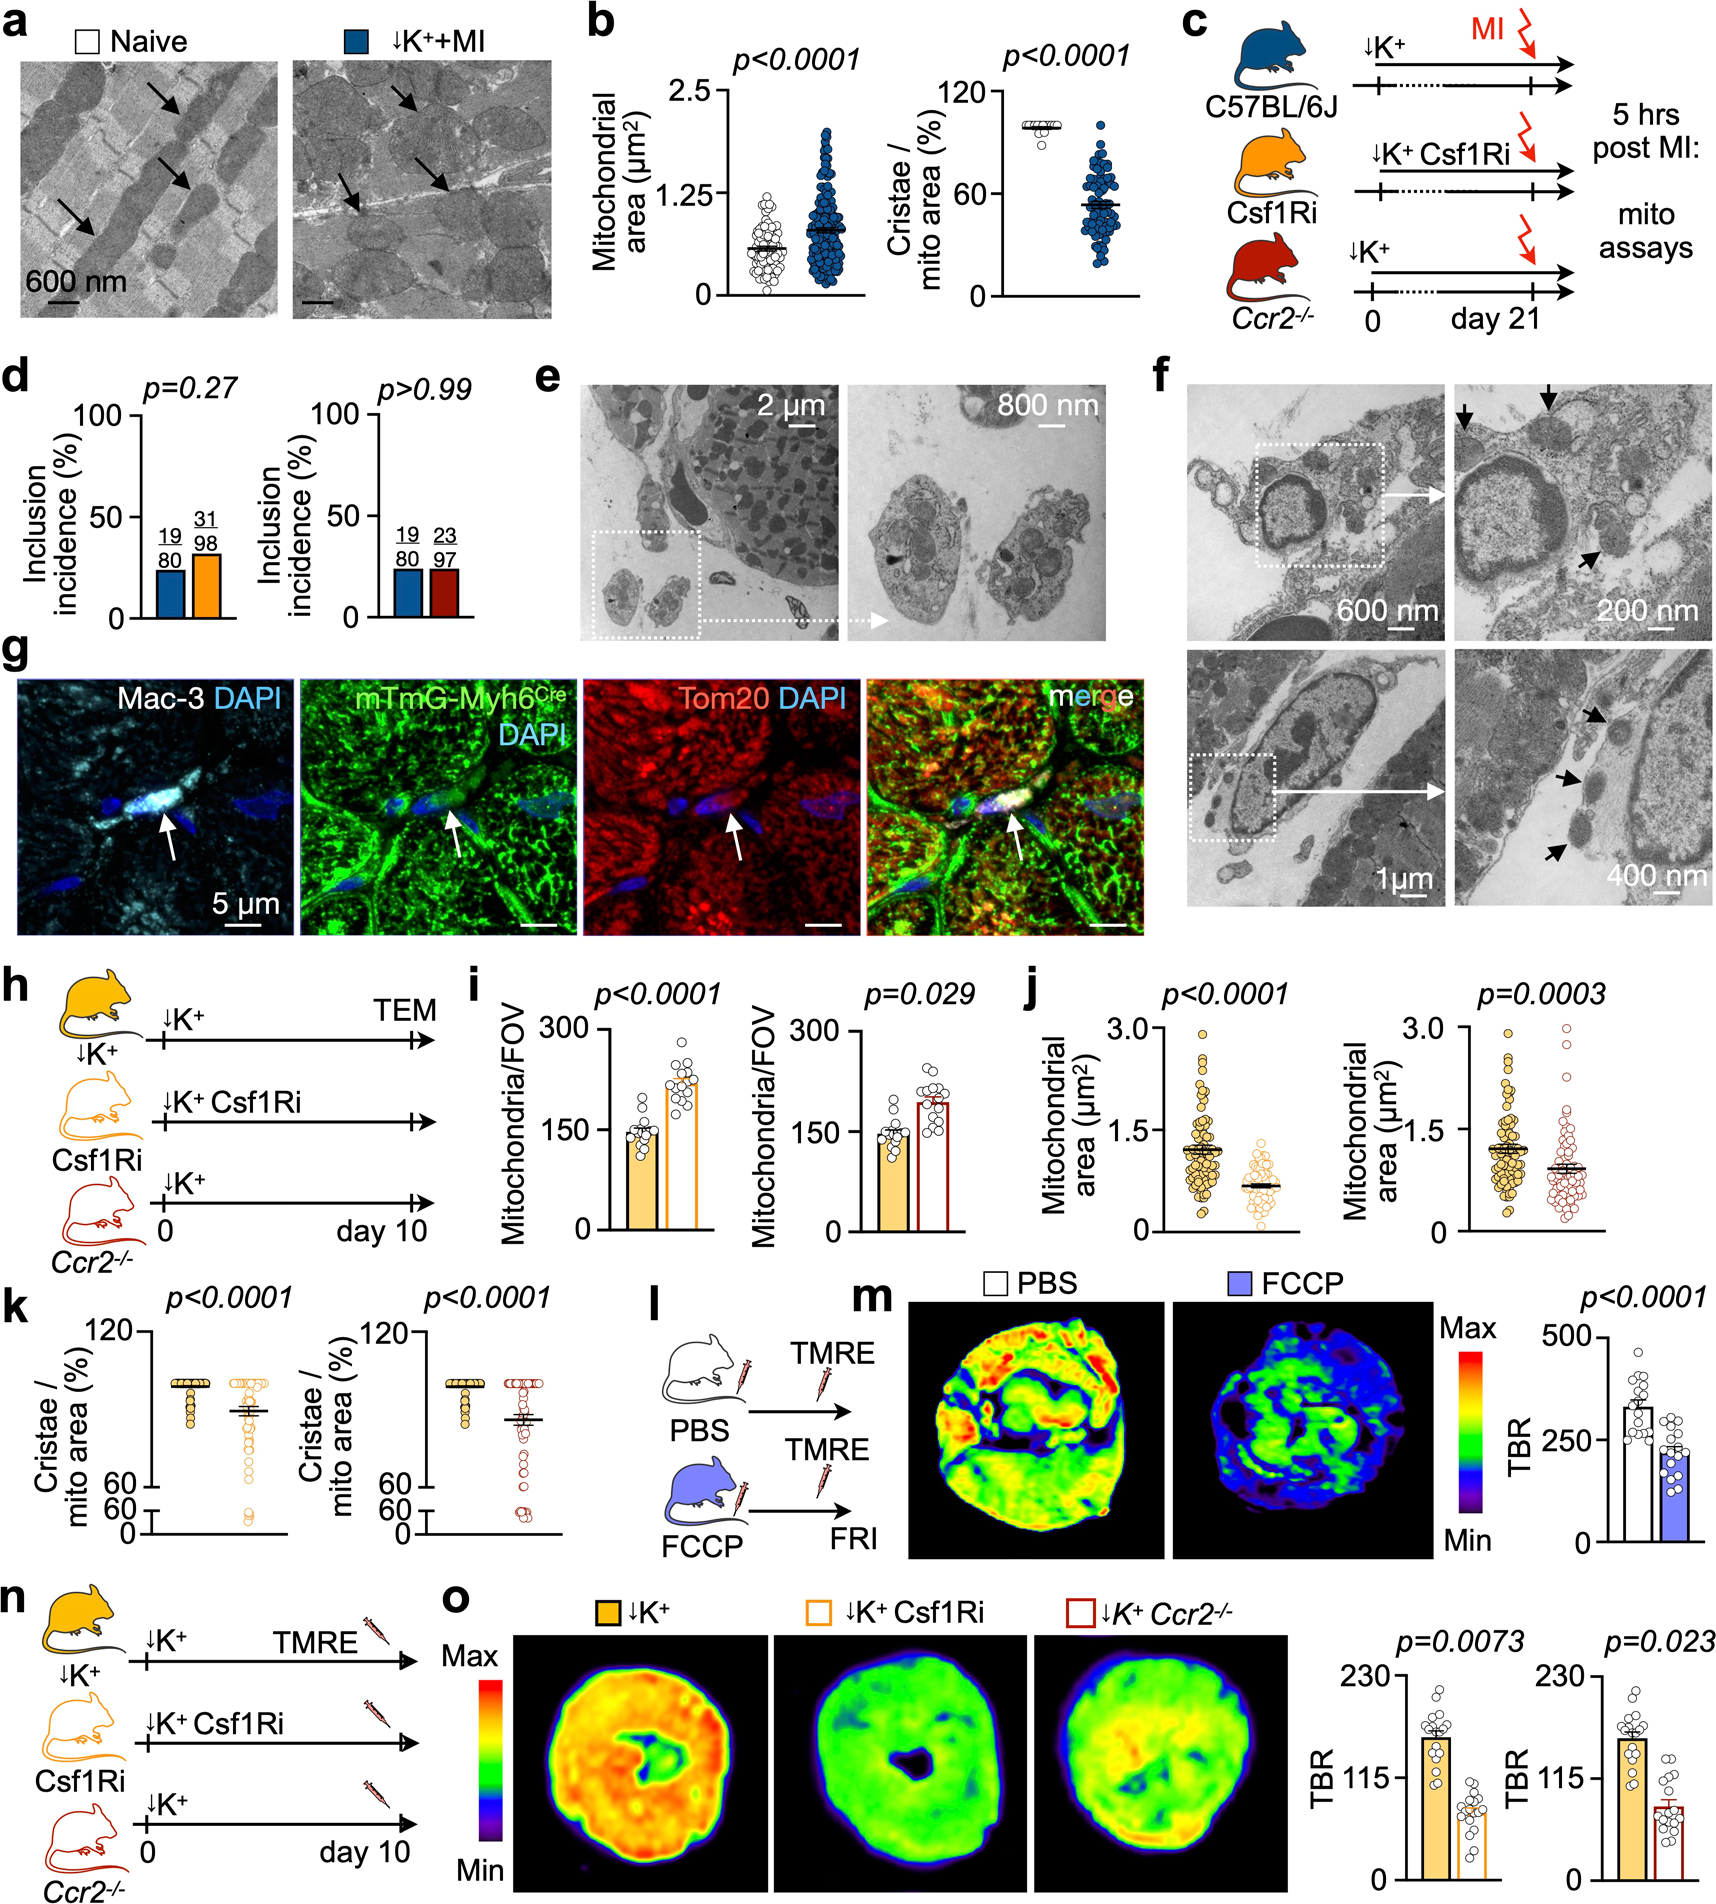
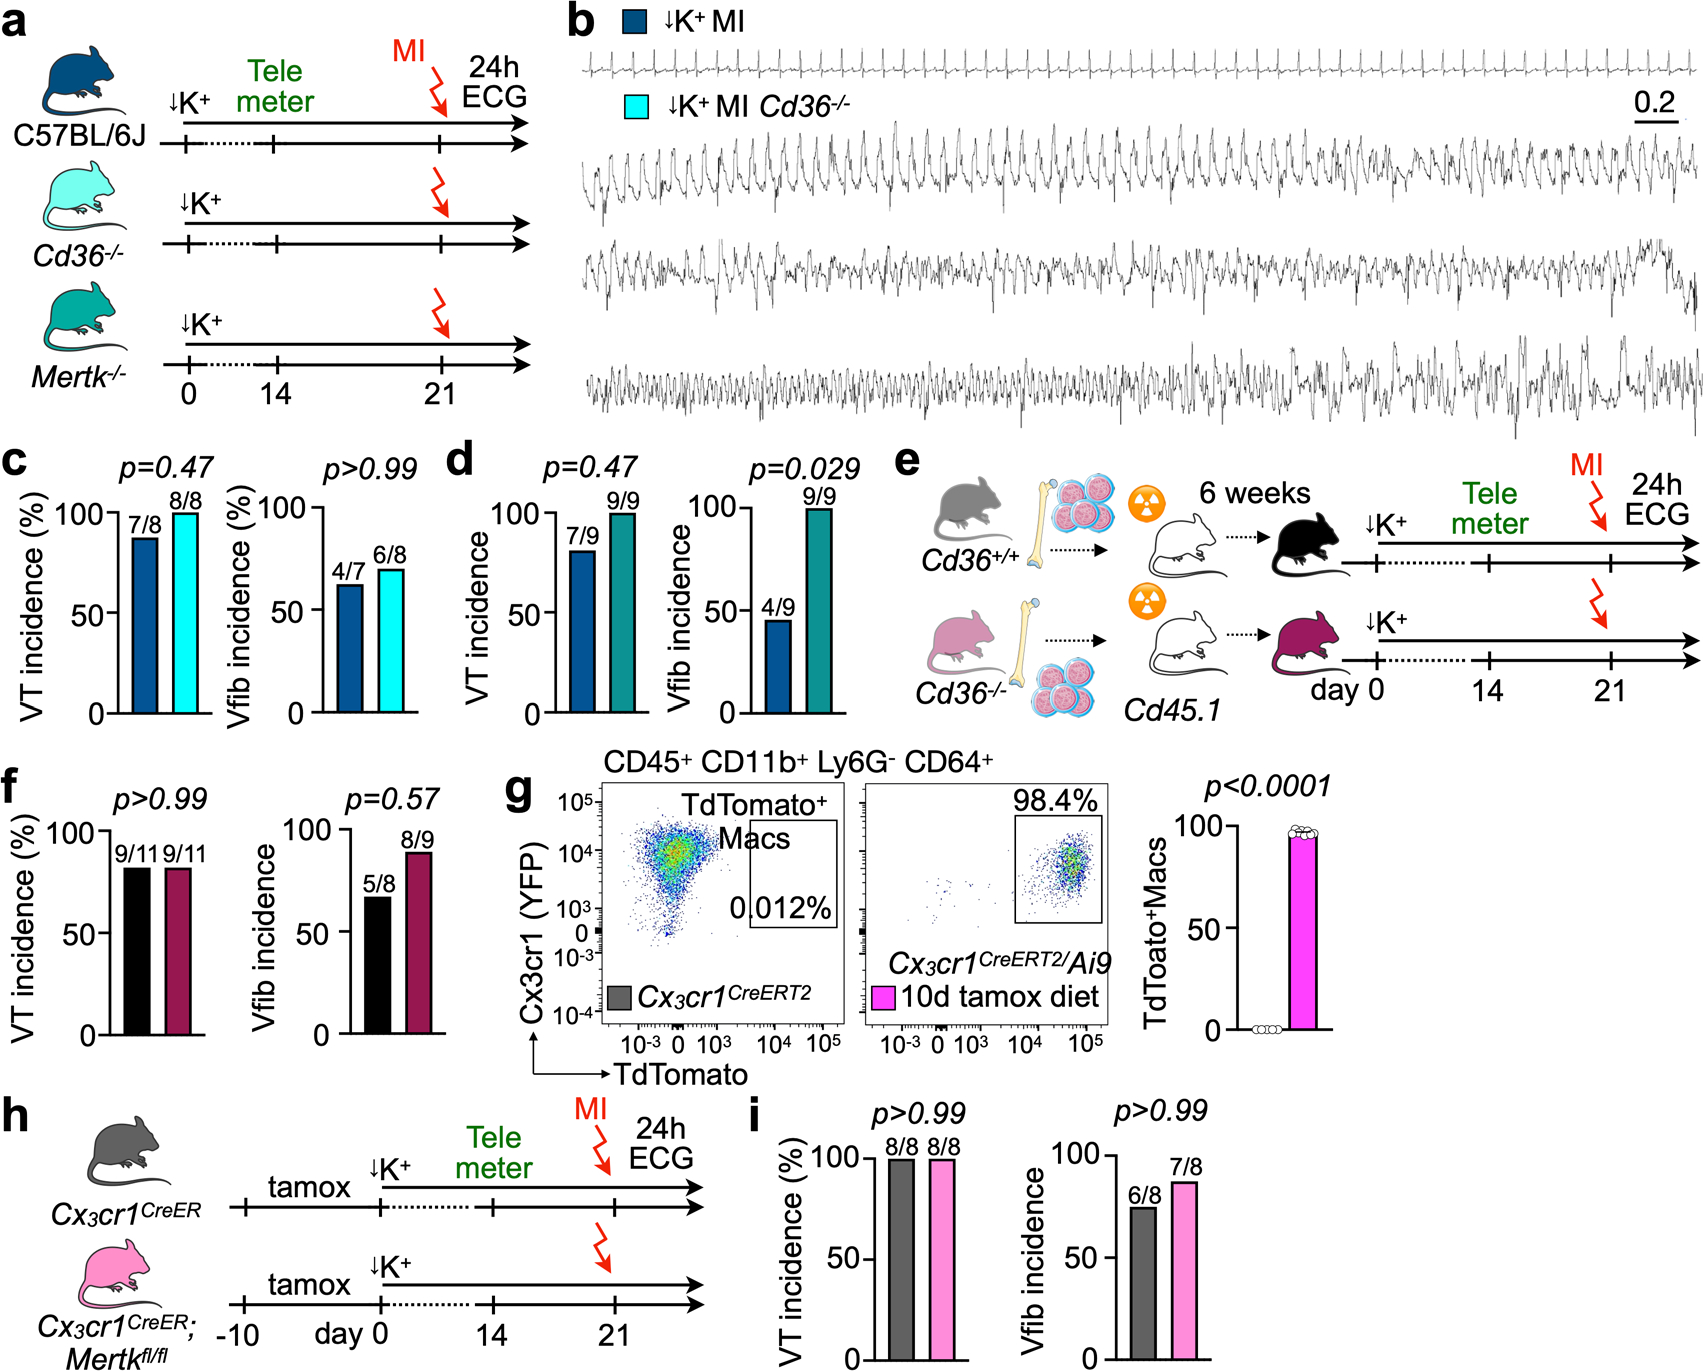
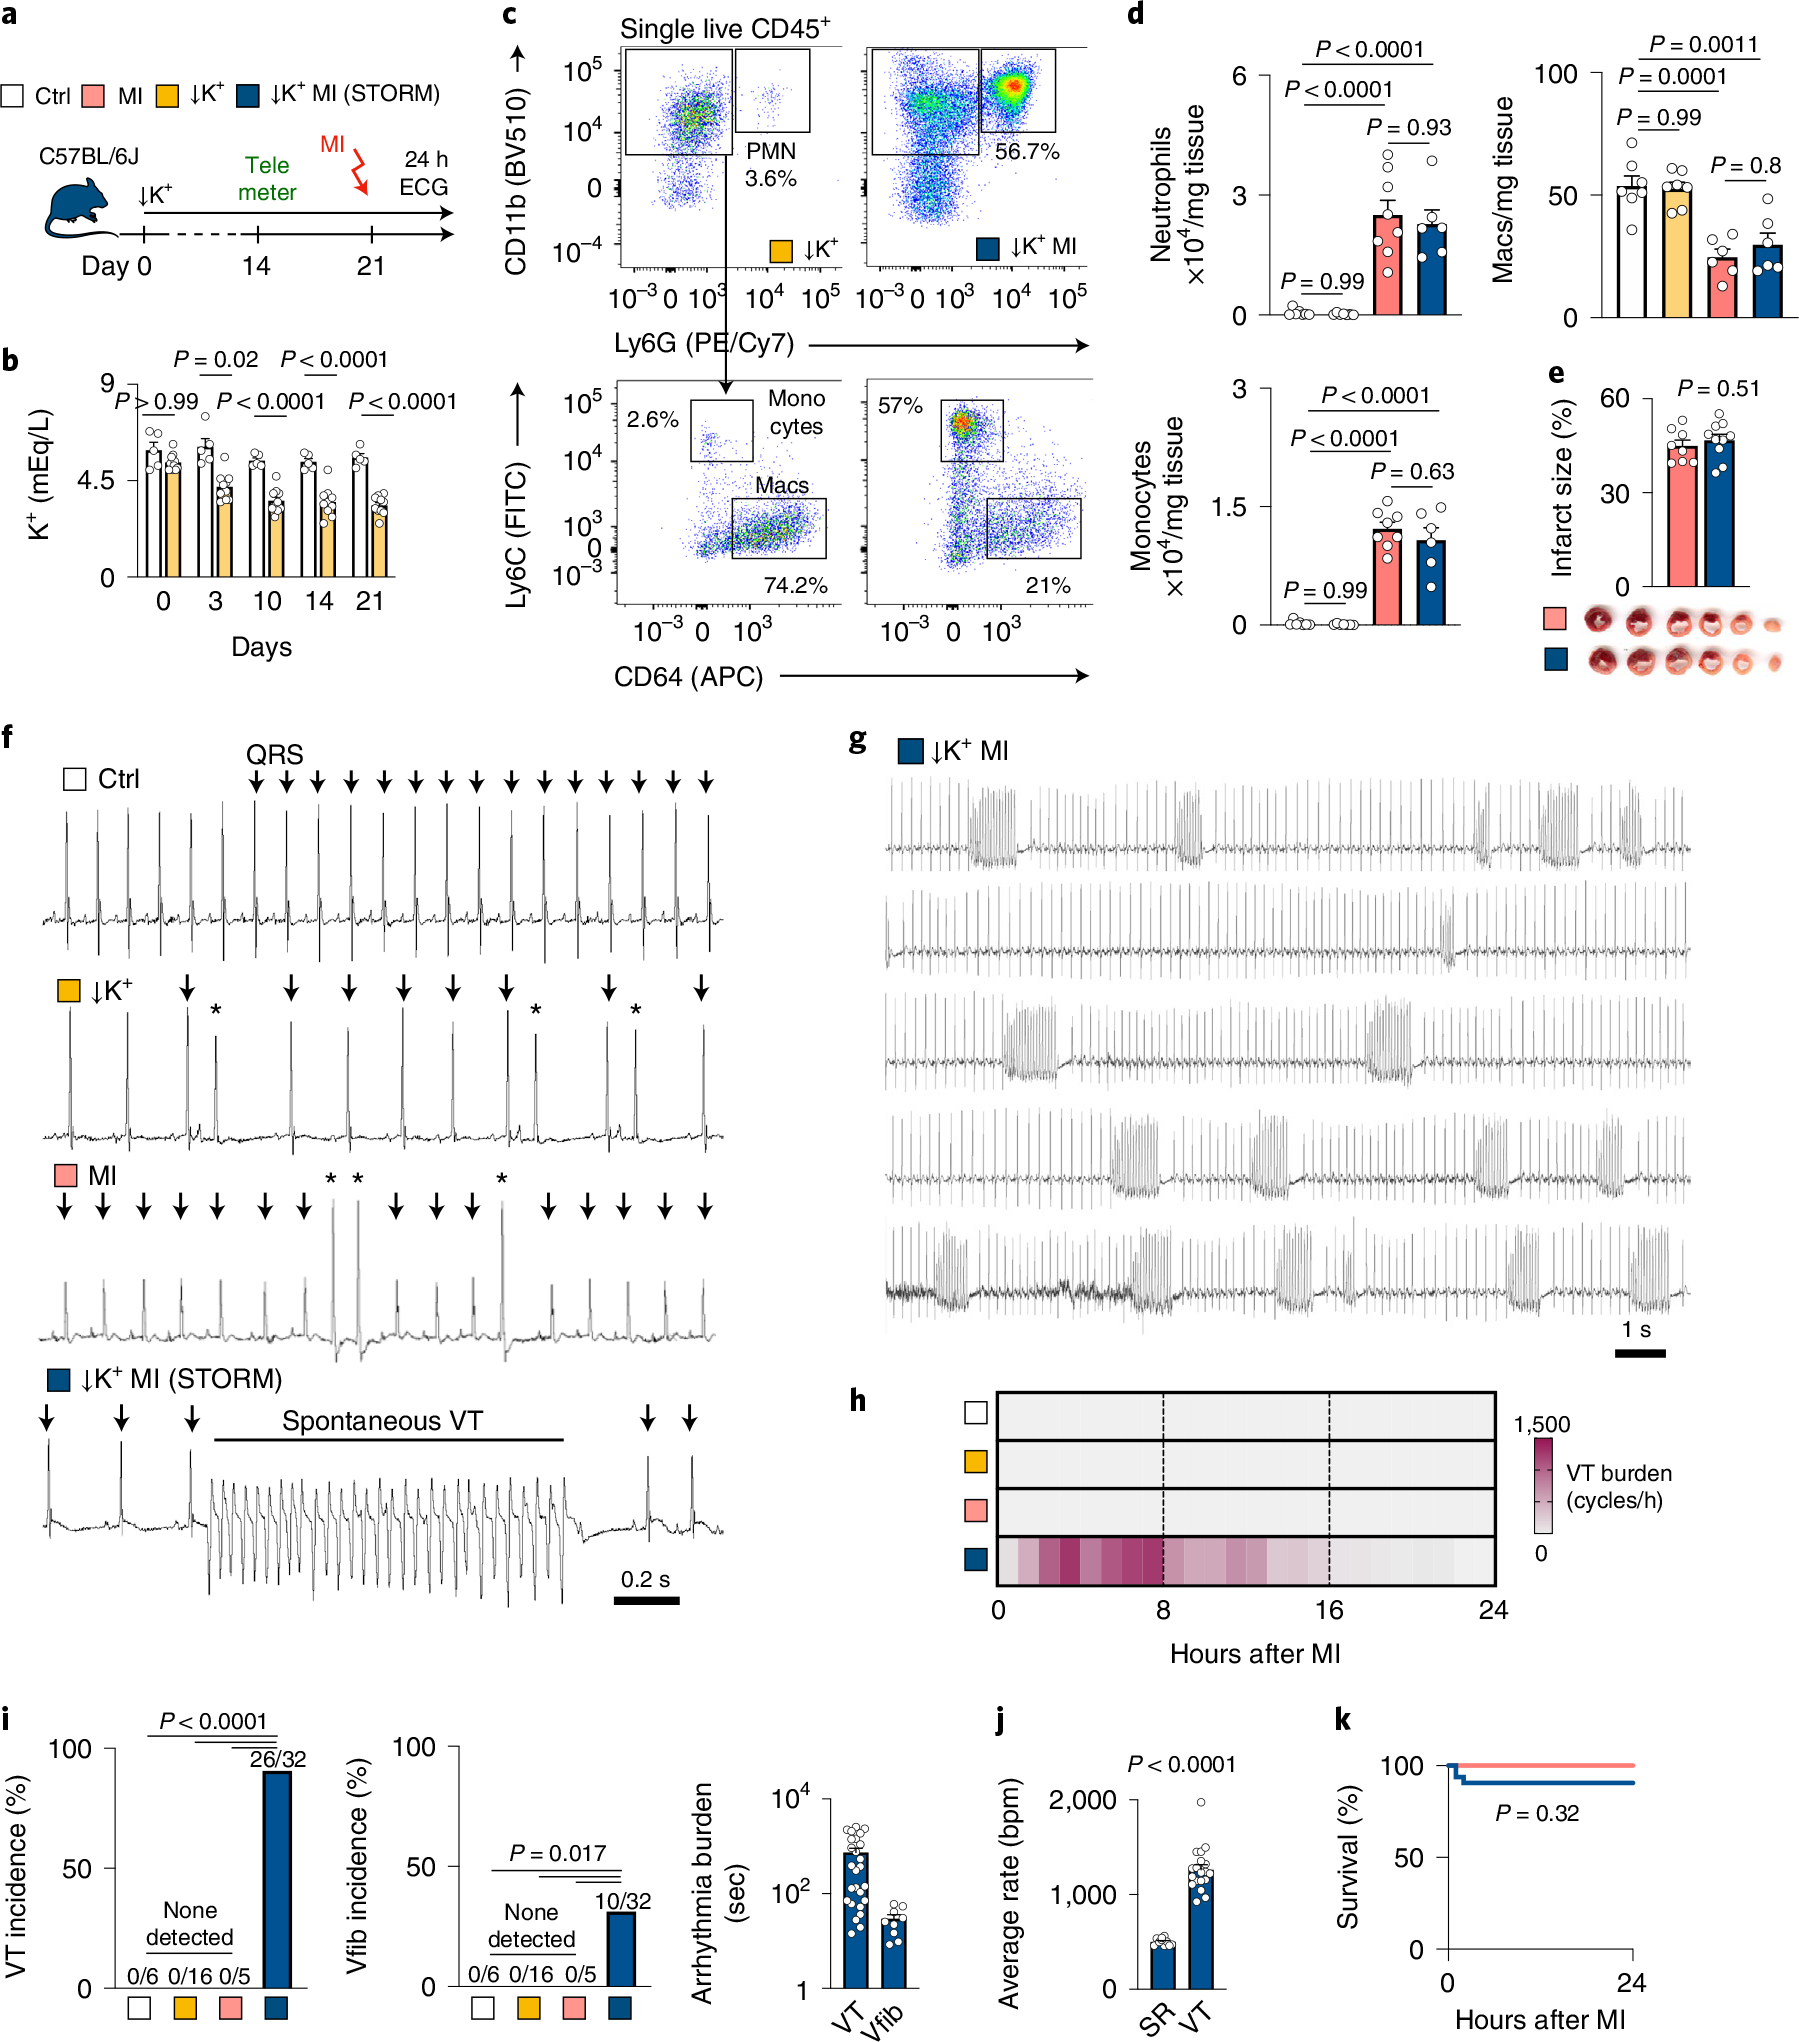
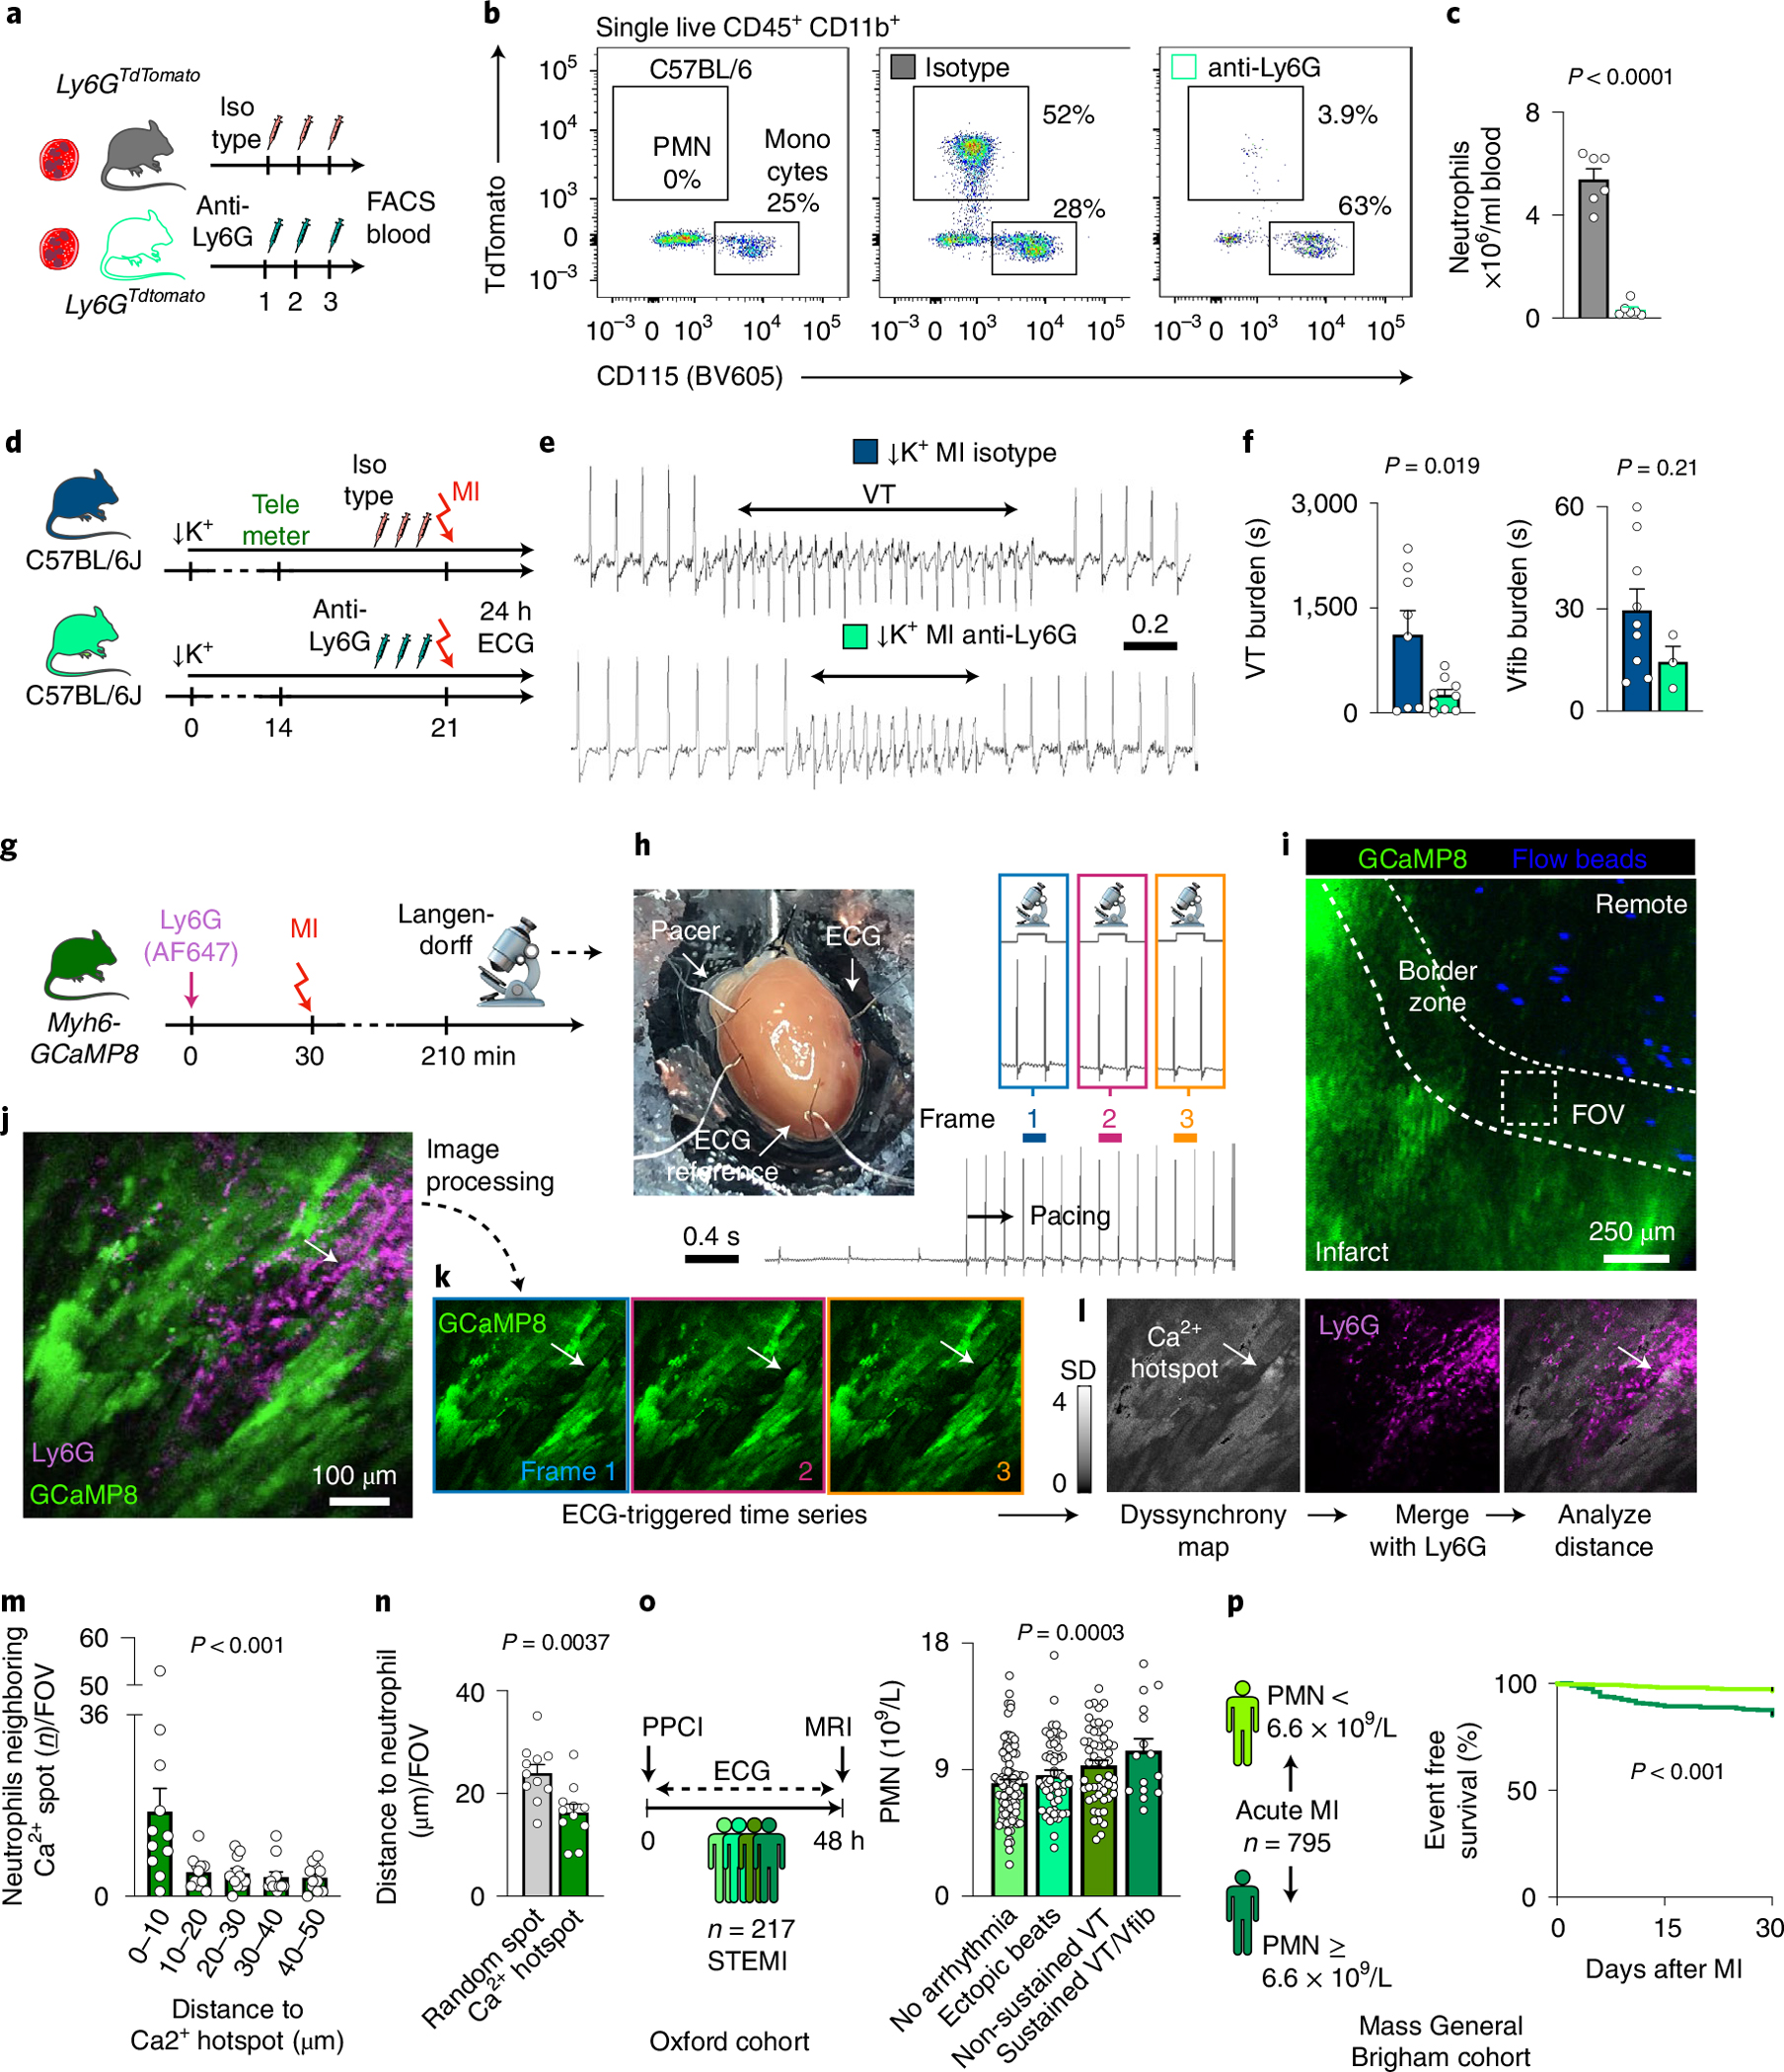
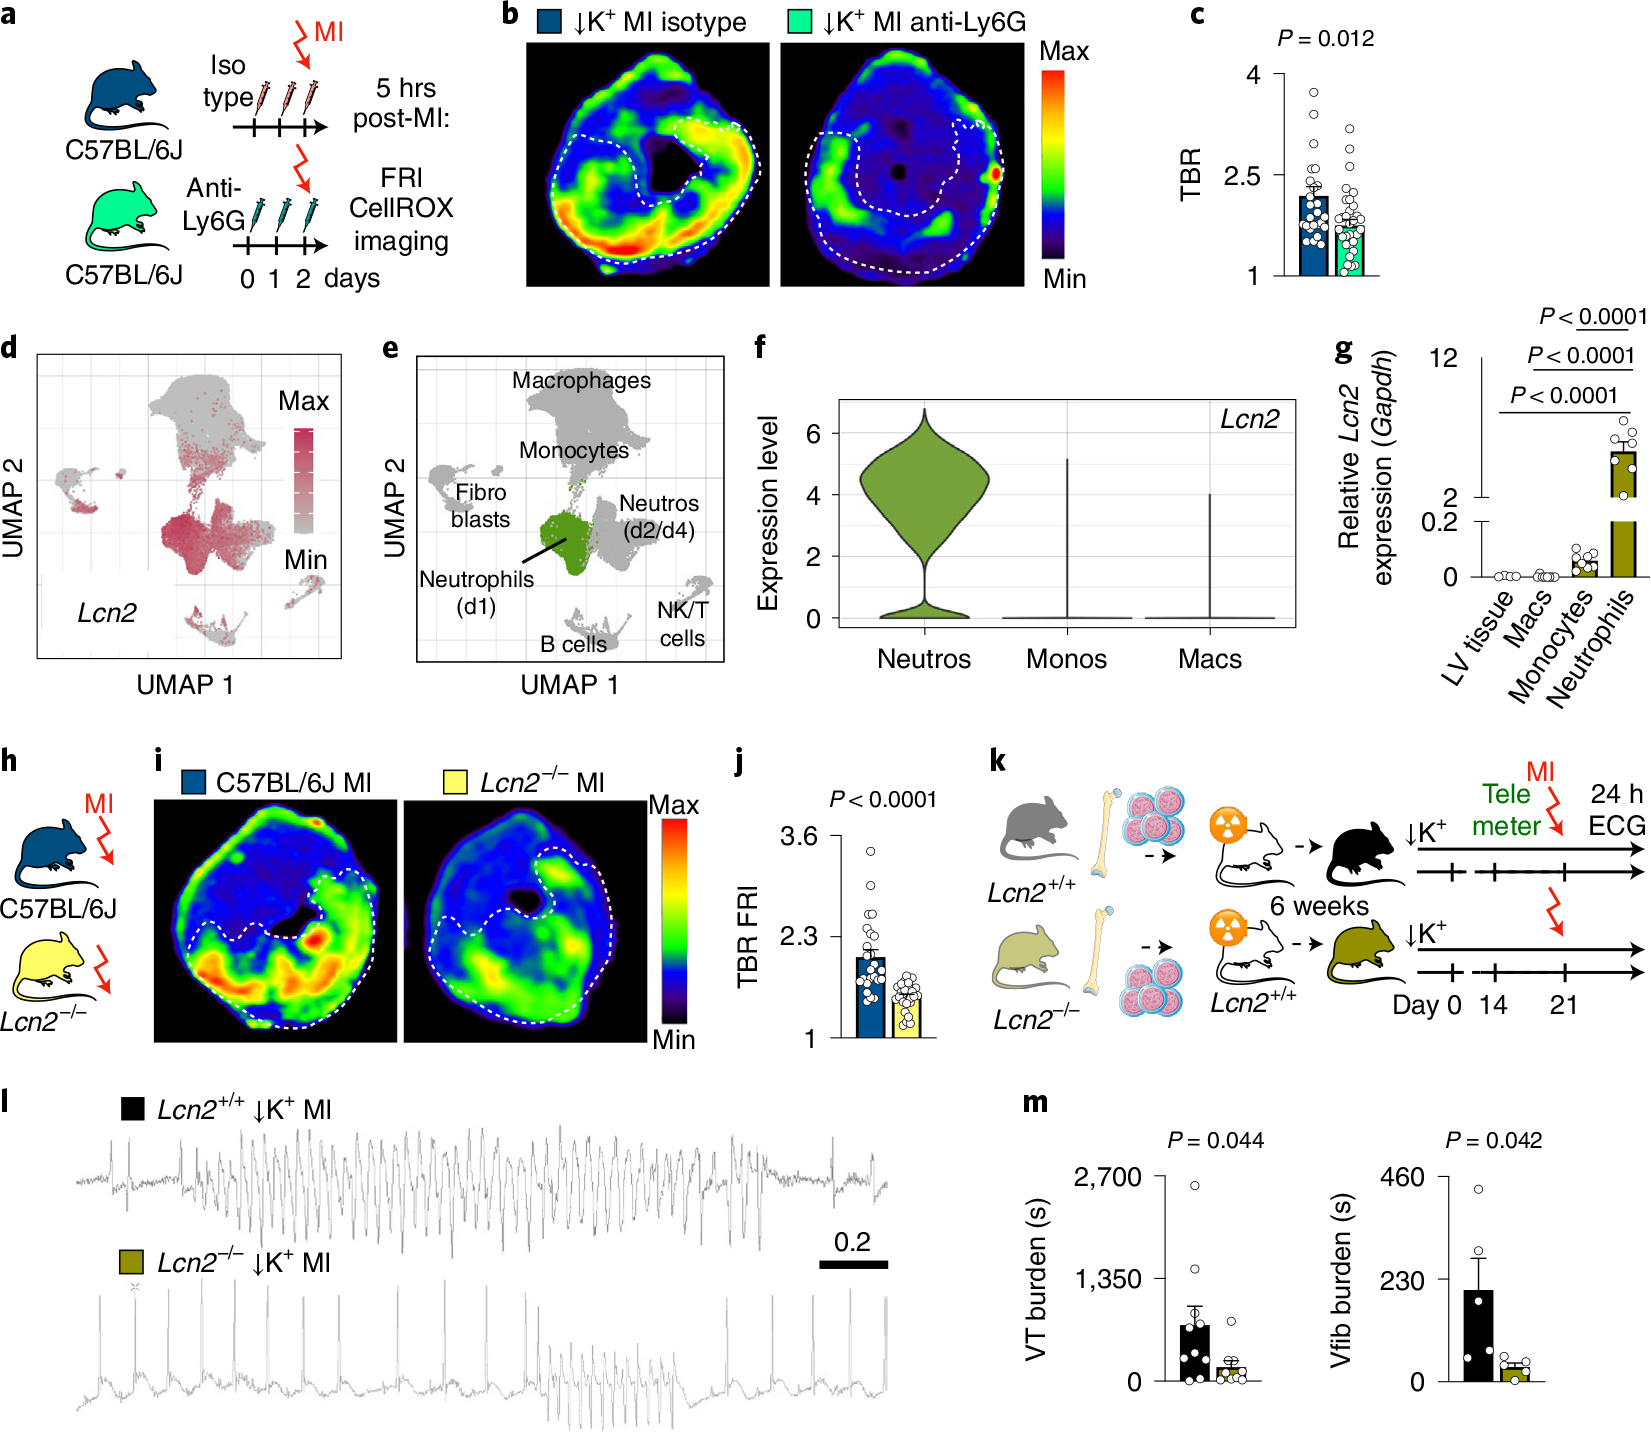
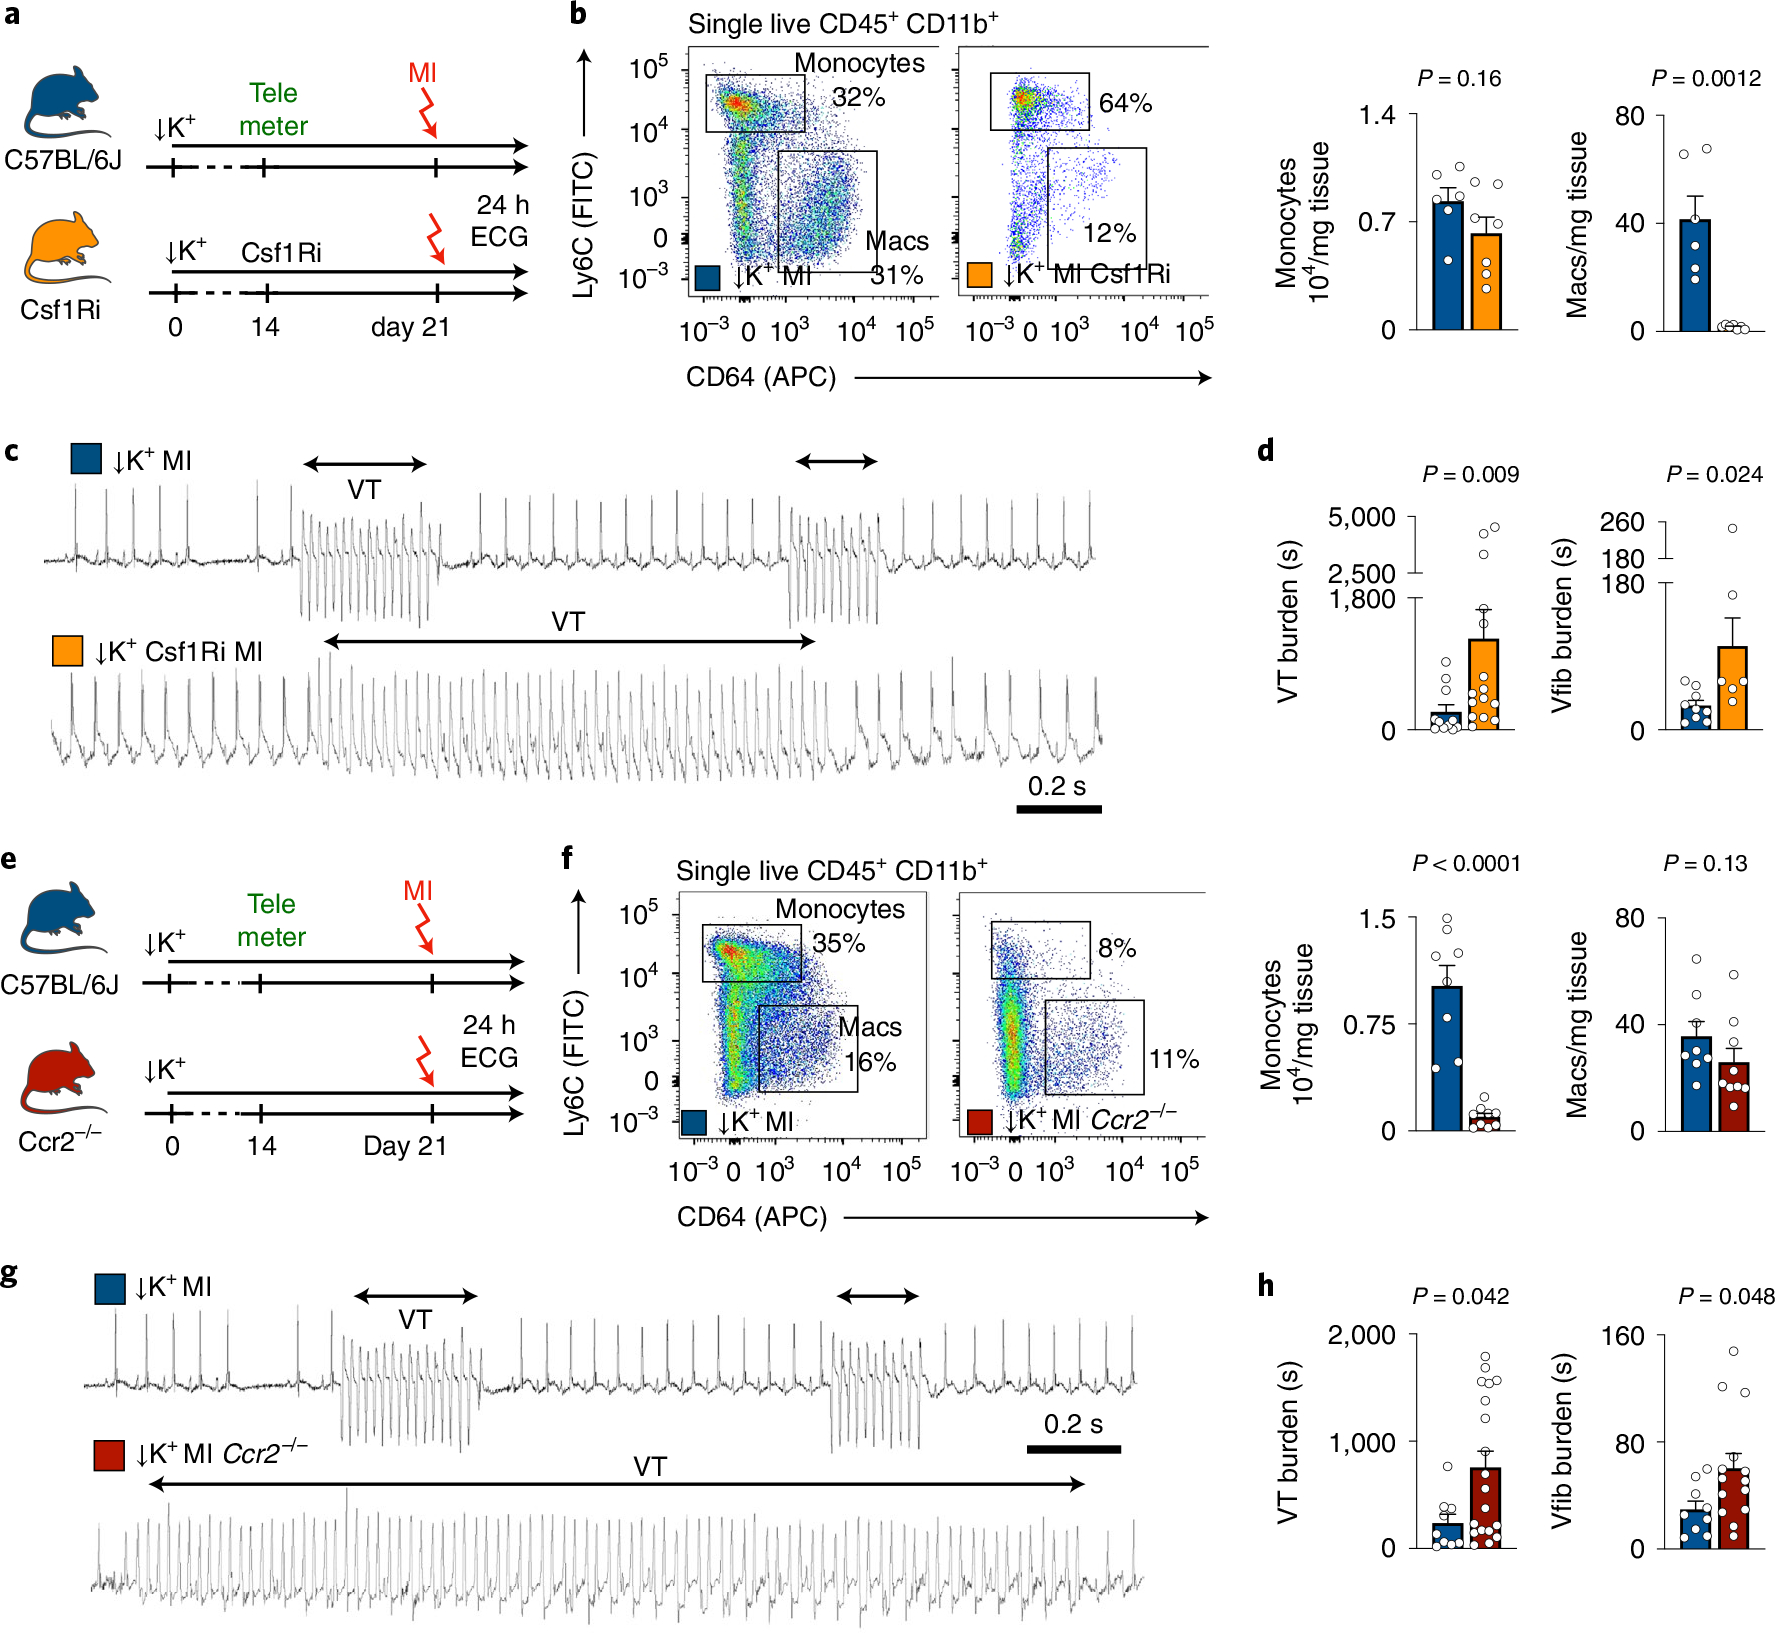
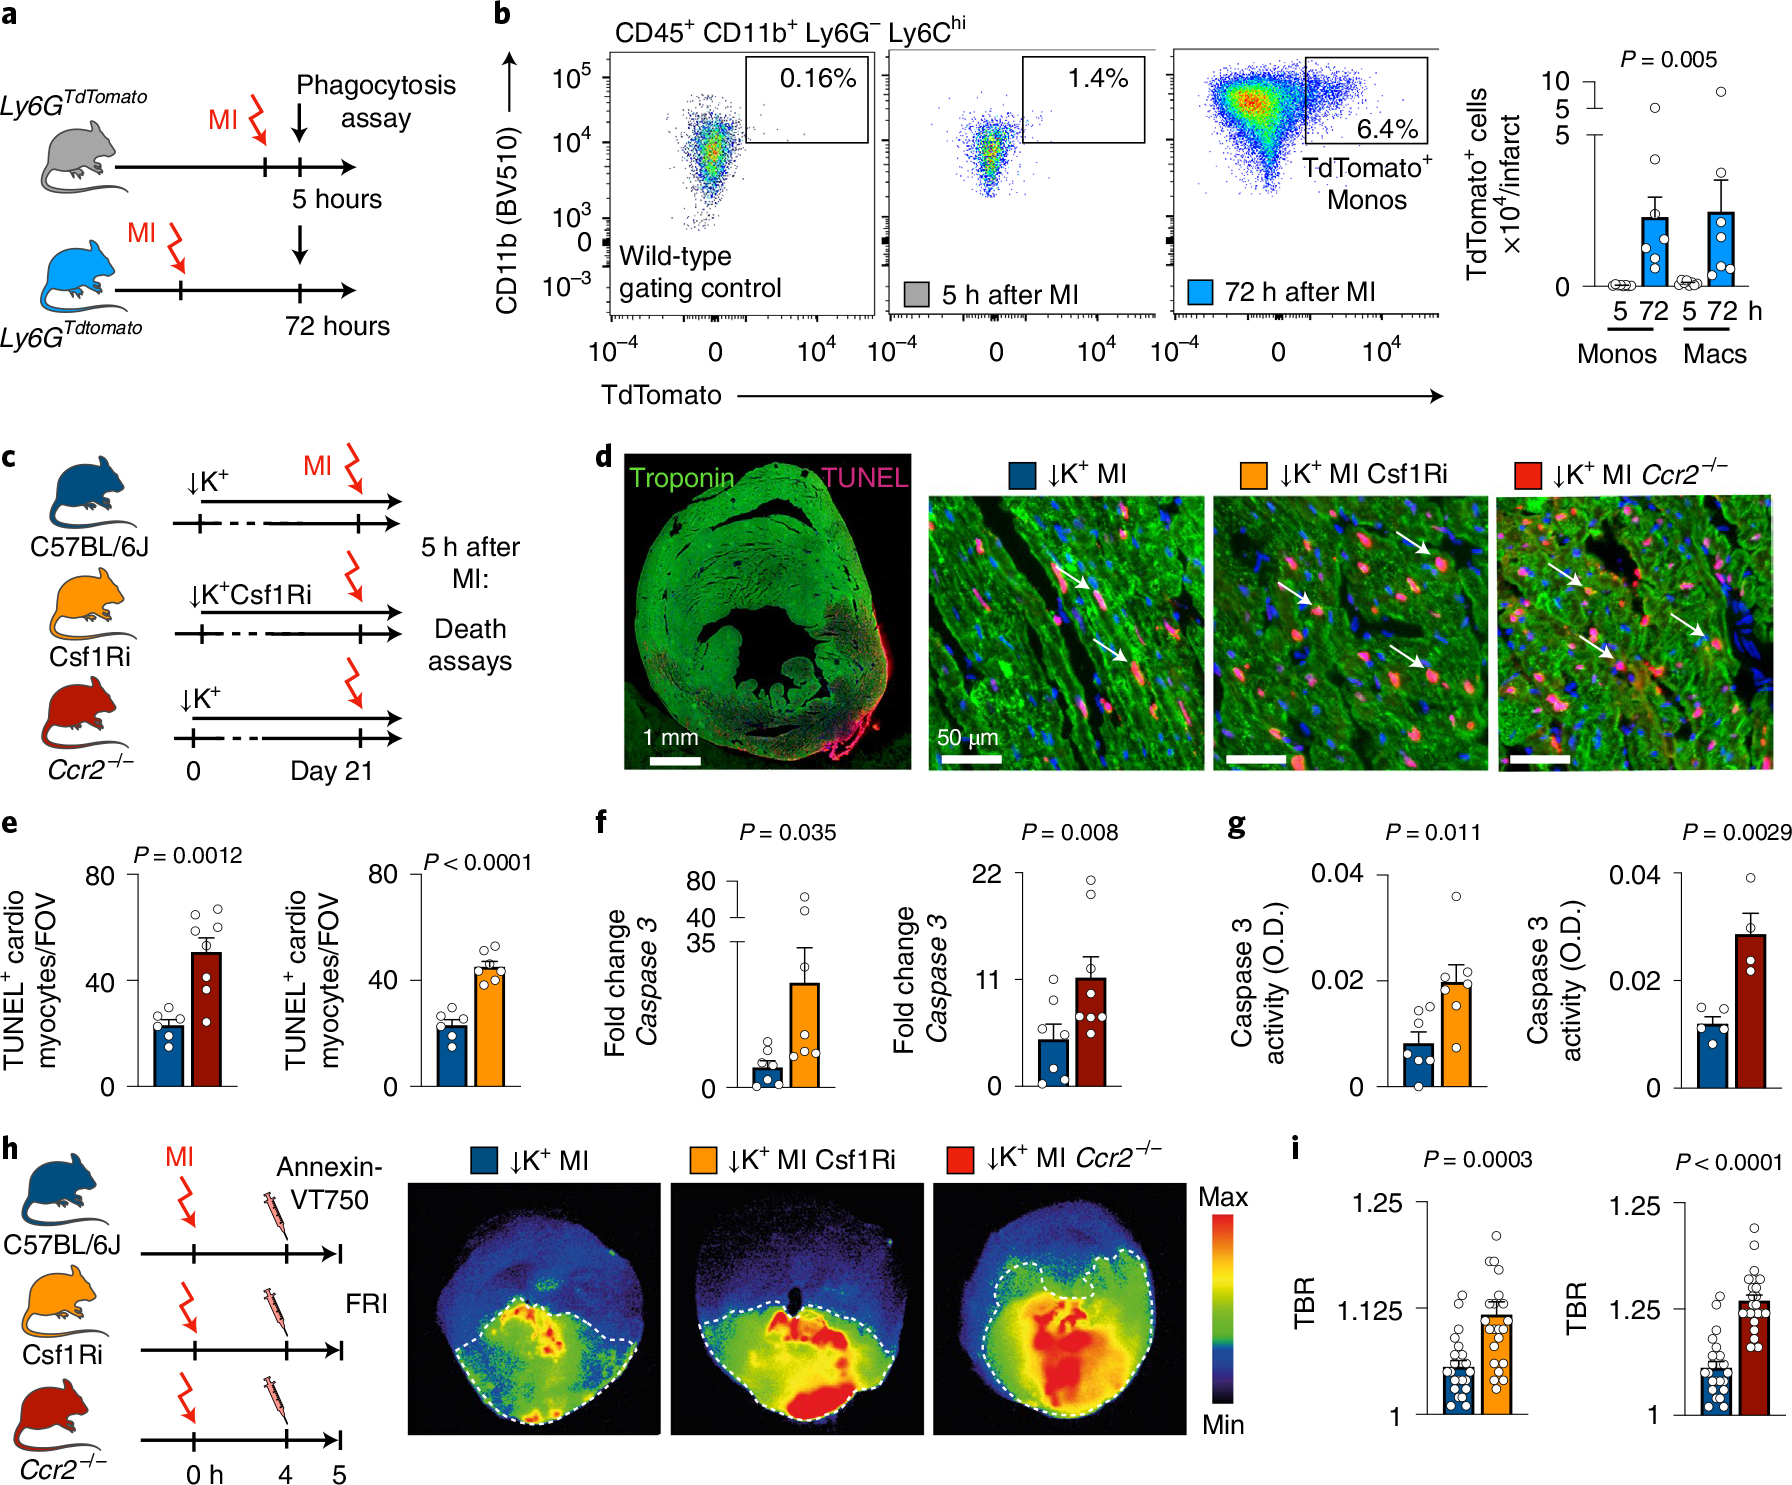
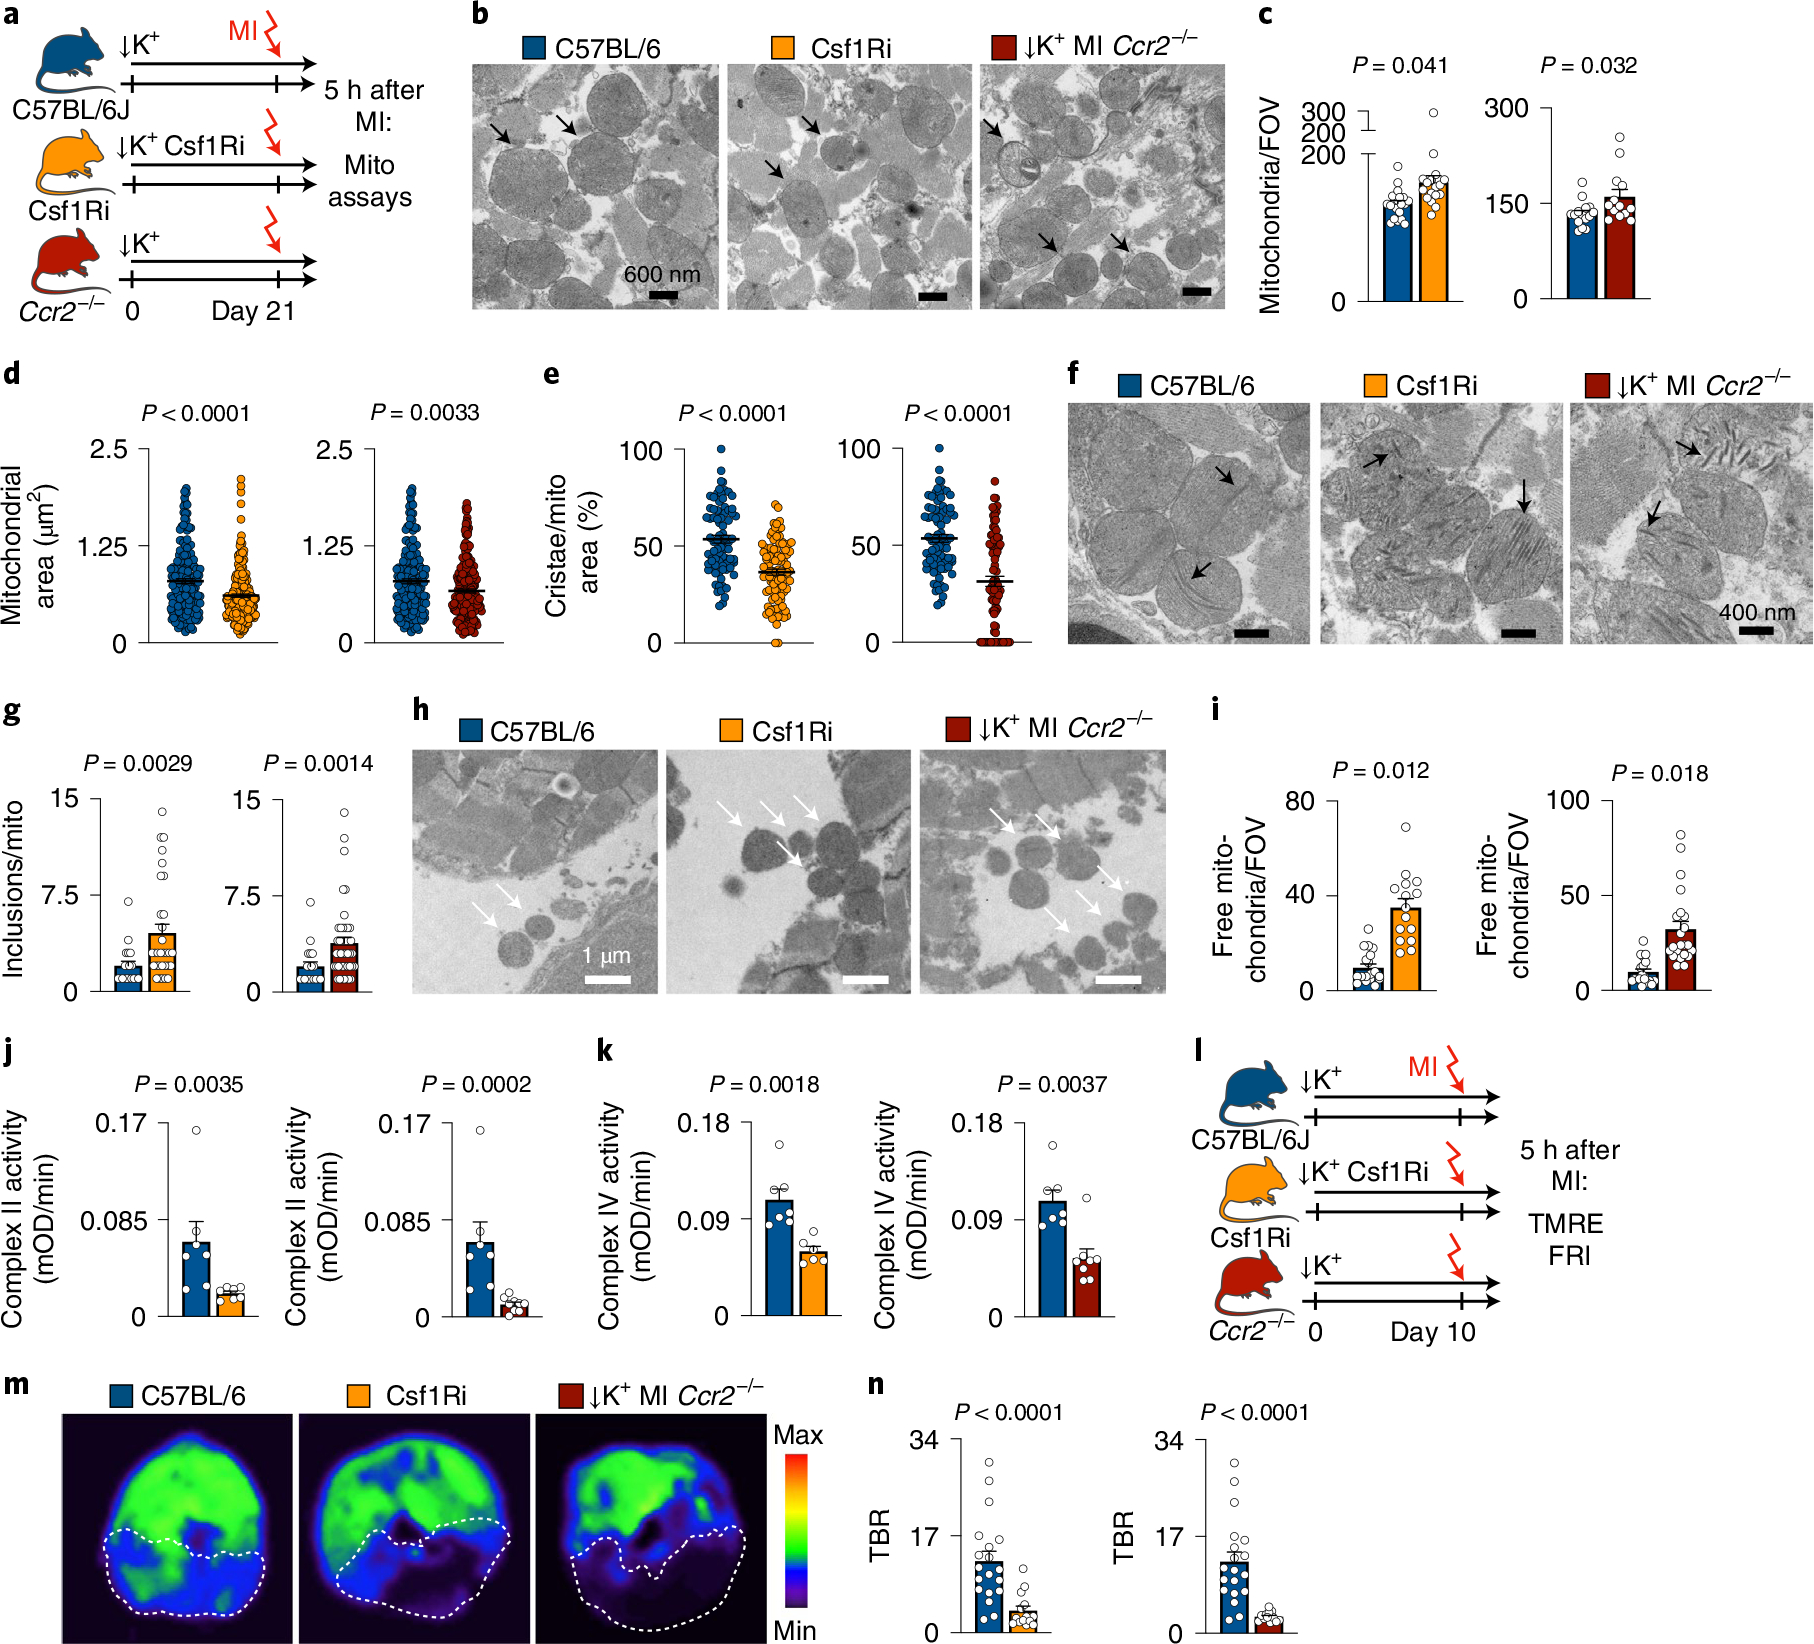
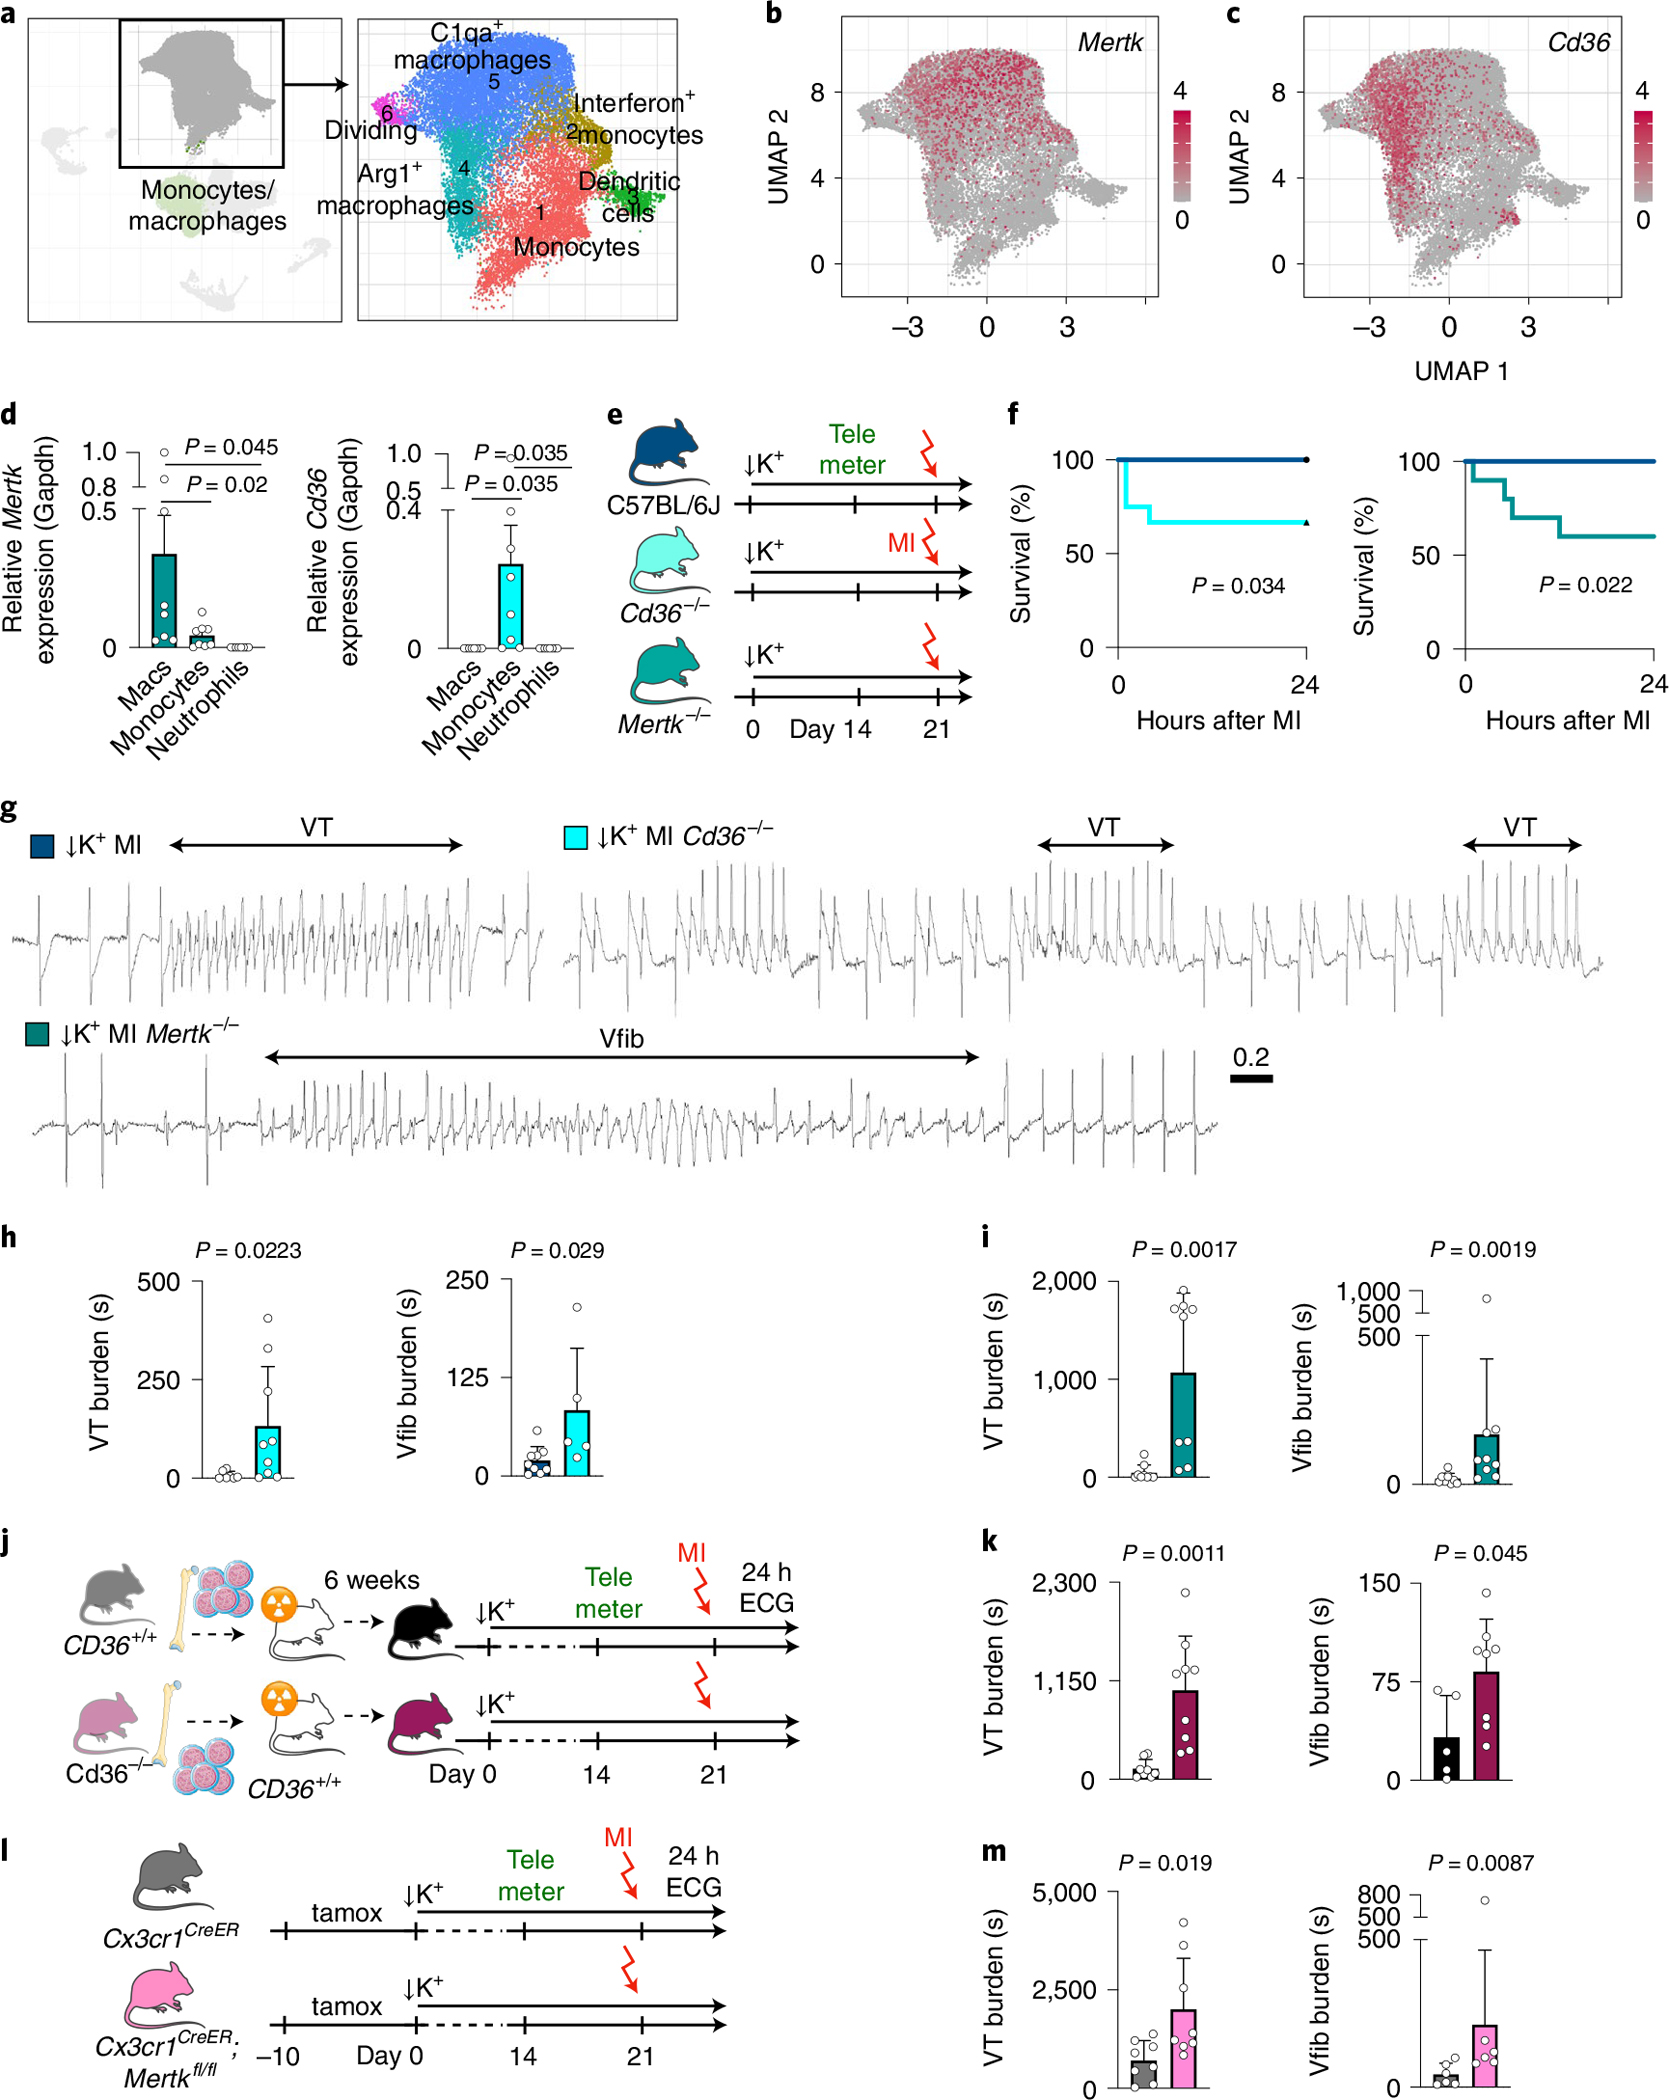
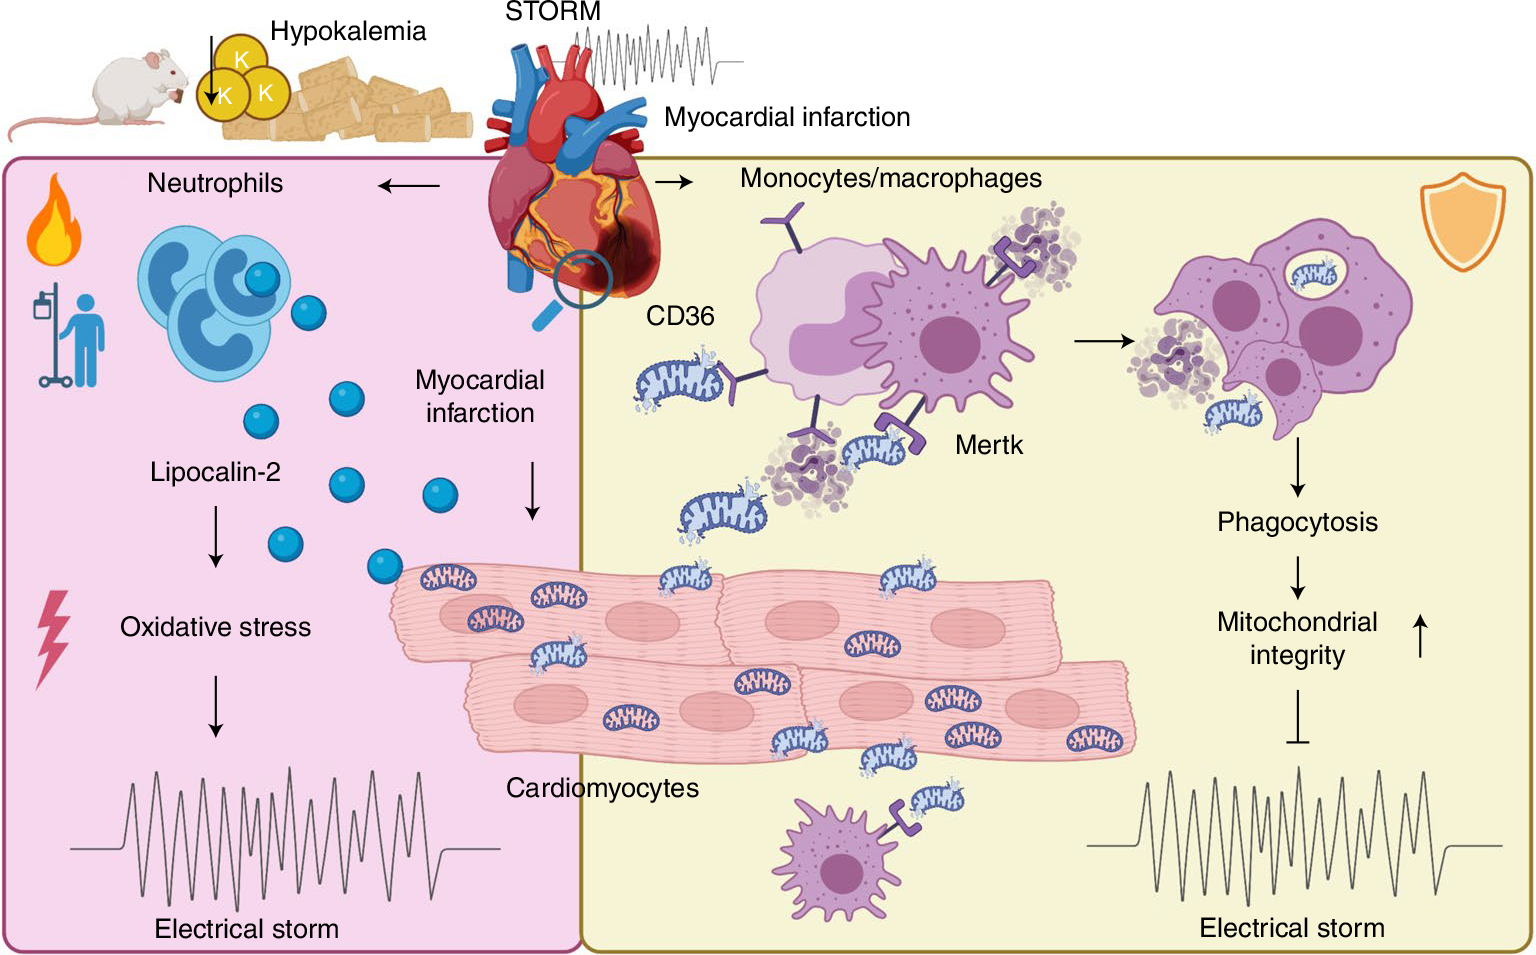
Sudden cardiac death, arising from abnormal electrical conduction, occurs frequently in patients with coronary heart disease. Myocardial ischemia simultaneously induces arrhythmia and massive myocardial leukocyte changes. In this study, we optimized a mouse model in which hypokalemia combined with myocardial infarction triggered spontaneous ventricular tachycardia in ambulatory mice, and we showed that major leukocyte subsets have opposing effects on cardiac conduction. Neutrophils increased ventricular tachycardia via lipocalin-2 in mice, whereas neutrophilia associated with ventricular tachycardia in patients. In contrast, macrophages protected against arrhythmia. Depleting recruited macrophages in Ccr2 -/- mice or all macrophage subsets with Csf1 receptor inhibition increased both ventricular tachycardia and fibrillation. Higher arrhythmia burden and mortality in Cd36 -/- and Mertk -/- mice, viewed together with reduced mitochondrial integrity and accelerated cardiomyocyte death in the absence of macrophages, indicated that receptor-mediated phagocytosis protects against lethal electrical storm. Thus, modulation of leukocyte function provides a potential therapeutic pathway for reducing the risk of sudden cardiac death.


Conflict of interest statement

Competing interests J.G. and M.N. filed an invention disclosure on the STORM model. M.N. has received funds or material research support from Alnylam, Biotronik, CSL Behring, GlycoMimetics, GlaxoSmithKline, Medtronic, Novartis and Pfizer as well as consulting fees from Eli Lilly, Biogen, Gimv, IFM Therapeutics, Molecular Imaging, Sigilon and Verseau Therapeutics. P.T.E. has received sponsored research support from Bayer AG and IBM Health and has consulted for Bayer AG, Novartis and MyoKardia. A.D.A. has received sponsored research support from Amgen and Philip Research. The other authors declare no competing interests.

Figures

Extended Data Fig. 1 |
Extended Data Fig. 1 |. Phenotyping hypokalemic mice.
a, Experimental outline. b, pH, Cl, iCa2+ and Na+ measured in normokalemic (n = 5 or n = 6 mice) and hypokalemic mice (n = 7 or n = 10). Two-sided unpaired t tests were used. c, Average heart rate by telemetric ECG recordings in ambulatory normokalemic (n = 9 mice) and hypokalemic mice (n = 8). Two-sided unpaired t tests were used. d, QT and QTc intervals in normokalemic (n = 8 mice) and hypokalemic mice (n = 8). Two-sided unpaired t tests were used. e, Diastolic function measured by echocardiography in normokalemic (n = 7 mice) and hypokalemic (n = 5 or n = 6) mice indicated by the ratio between mitral inflow velocity and mitral valve annular early diastolic velocity (E/e′), late diastolic trans-mitral flow velocity (E/A) and global longitudinal peak strain (GLS). Two-sided unpaired t tests were used. f, Systolic function by echocardiography in normokalemic (n = 7 mice) and hypokalemic (n = 6) mice, indicated by end-systolic and end-diastolic left ventricular volumes, stroke volume and ejection fraction. Two-sided unpaired t tests were used. g, Gating strategy for cardiac leukocytes. h, Bland-Altman diagram demonstrating the difference of the ventricular tachycardia (VT) burden between two observers in percent. Dashed line: Bias. Dotted lines: Limits of Agreement (LoA). i, Representative ECG tracings from an invasive electrophysiological study. j, Inducibility of ventricular tachycardia (VT) after pacing in naive, hypokalemic and MI mice. Mouse numbers are indicated in plot. MI mice were measured 5 hrs after surgical induction. One-sided Chi-square test was used. k, Ventricular effective refractory period (n = 6 or n = 8 mice per group) in naive, hypokalemic and mice 5 hrs after MI. For STORM mice, catheter insertion caused spontaneous VTs which made an EP study impossible. One-way ANOVA followed by Tukey’s multiple comparisons test were used. l, Experimental outline. m, Incidence of ventricular arrhythmias and VT burden in male (n = 10 mice) and female (n = 8) mice after STORM procedure. Fisher’s exact test (VT and Vfib incidence) and two-sided Mann Whitney test (VT burden) were used. Data are mean ± SEM.
Extended Data Fig. 2 |
Extended Data Fig. 2 |. Neutrophil depletion effects after MI.
a, Experimental outline. b, Serum troponin, infarct size, heart weight-to-body weight ratio and heart weight-to-tibia length ratio from isotype-injected (n = 6 or n = 10 mice) and anti-Ly6G antibody-injected (n = 6 or n = 9) mice. Two-sided unpaired t tests were used. c, Flow cytometric quantification of cardiac macrophages in STORM mice undergoing isotype (n = 6 mice) or anti-Ly6G antibody (neutrophil depletion, n = 5 mice) injections after MI. Two-sided unpaired t test was used. d, Ventricular tachycardia (VT) incidence, ventricular fibrillation (Vfib) incidence (n-numbers indicated in plots) obtained by telemetric ECG recordings in ambulatory isotype-injected (n = 8 mice) and anti-Ly6G-injected (n = 7) mice, all after STORM exposure. Two-sided Fisher’s exact tests was used. e, QT and QTc intervals assessed in STORM mice (n = 10 mice) and STORM mice undergoing neutrophil depletion (n = 7). Two-sided unpaired t tests were used. f, Confocal microscopy image of isolated Langendorff heart from a control Myh6-GCaMP8 mouse. The ECG-triggered time series was used to calculate a dyssynchrony map (standard deviation of the Ca2+ channel (gcamp) over time). None were identified in this control experiment. Scale bar indicates 100 μm. This experiment was repeated independently four times. g, Distances from anti-Ly6G-labeled neutrophils to randomly distributed spots in individual fields of view (FOVs). Data were generated from n = 3 mice and n = 11 FOVs. Three random spots were assigned in each FOV and the distance to neutrophils closer than 50 μm was measured. One-way ANOVA was used. h, Exclusion chart for Oxford cohort. i, Exclusion chart for Mass General Brigham cohort. j, Serum potassium levels measured in MI patients (n = 795) in the Mass General Brigham cohort. Data represent the lowest potassium level measured during hospitalization due to MI. k, TUNEL, troponin and DAPI staining of sections from the infarct 5 hrs after MI in STORM mice. Scale bar indicates 50 μm. l, Analysis of TUNEL+ myocytes in STORM mice injected with isotype (n = 6) or anti-Ly6G neutrophil depleting antibody (n = 6). Caspase 3 activity measured in infarcted myocardium (5 hrs post MI) from isotype control antibody injected C57BL/6 mice (n = 6 mice) and mice with neutrophil depletion treatment (n = 7), all after STORM procedure. Two-sided unpaired t tests were used. Data are mean ± SEM.
Extended Data Fig. 3 |
Extended Data Fig. 3 |. Lcn2 deletion in bone marrow cells.
a, Experimental outline for CellROX validation. Mice were intravenously injected with CellROX. After 30 min, hearts were excised and cardiac slices were incubated either in PBS or a tert-butyl hydroxyperoxide (TBHP) solution that increases oxidative stress. b, Fluorescence images from cardiac short axis slices after intravenous injection of CellROX and incubation with either control PBS or TBHP. c, Quantification of target-to-background ratio (TBR) from FRI. Background mean fluorescence intensity was measured in the image background outside tissue. Data are from incubation with PBS (n = 4 mice) or TBHP (n = 4). Each dot represents a cardiac slice. Two-sided unpaired t test was used. d, Experimental outline. Lethal irradiation was followed by bone marrow transplantation and the STORM procedure. e, Ventricular tachycardia (VT) burden in mice without (n = 7 mice) and with bone marrow transplantation (n = 7), after STORM procedure. Two-sided Mann Whitney test was used. f, Experimental outline of bone marrow transplantation approach using wild type or Lcn2−/− donor mice followed by STORM procedure. g, Flow plots of cardiac monocyte and macrophage populations in Lcn2+/+ and Lcn2/ bone marrow chimeras after STORM procedure, 5hrs after MI. h, Quantification of cardiac monocyte and macrophages in Lcn2+/+ (n = 6 mice) and Lcn2−/− bone marrow chimeras (n = 6) after STORM protocol. Two-sided unpaired t tests were used. i, Flow plots of cardiac neutrophils (PMN) in Lcn2+/+ and Lcn2/ bone marrow chimeras after STORM procedure, 5hrs after MI. j, Quantification of cardiac monocyte and macrophages in Lcn2+/+ (n = 6 mice) and Lcn2/ bone marrow chimeras (n = 6) after STORM protocol. A Mann Whitney test (monocytes) and a two-sided unpaired t test (Macrophages) were used. k, Ventricular tachycardia (VT) incidence and ventricular fibrillation (Vfib) incidence (n-numbers indicated in plots) in ambulatory Lcn2+/+ (n = 7 mice) and Lcn2/ bone marrow chimeras (n = 9) after STORM procedure. Two-sided Fisher’s exact tests were used. Data are mean ± SEM.
Extended Data Fig. 4 |
Extended Data Fig. 4 |. Myeloid cell ablation and steady-state cardiac function.
a, Experimental outline. b, Flow plots and quantification of cardiac macrophages in hypokalemic (n = 5 mice) and hypokalemic mice undergoing macrophage depletion by Csf1Ri (n = 5). Two-sided Mann Whitney test were used. c, Serum potassium in hypokalemic (n = 6 mice) and Csf1Ri-treated hypokalemic mice (n = 7). Two-sided unpaired t tests were used. d, Systolic function by echocardiography in hypokalemic (n = 6 mice) and Csf1Ri treated hypokalemic mice (n = 6). Two-sided unpaired t tests were used (except for heart rate, two-sided Mann Whitney test). e, Diastolic function by echocardiography in hypokalemic (n = 6 mice, except E/e′: n = 5) and Csf1Ri treated hypokalemic mice (n = 6). Ratio between mitral inflow velocity and mitral valve annular early diastolic velocity, E/e′; late diastolic trans-mitral flow velocity, E/A; global longitudinal peak strain, GLS. Two-sided unpaired t tests were used. f, Caspase 3, Fadd, Mlkl and Tradd expression measured by quantitative PCR in hypokalemic (n = 4 or n = 6 mice, respectively) and Csf1Ri treated hypokalemic mice (n = 4 or n = 6 mice, respectively). Data from macrophage depletion group was normalized to data from hypokalemic mice. Two-sided unpaired t tests were used (except Mlkl and Tradd, Mann Whitney test). g, Ventricular tachycardia (VT) inducibility and ventricular effective refractory period in an invasive electrophysiological study in hypokalemic (n = 7 mice) and Csf1Ri treated hypokalemic mice (n = 5). Fischer’s exact test (VT inducibility) and unpaired t test were used (ventricular effective refractory period). h, VT inducibility and ventricular effective refractory period in an invasive electrophysiological study in hypokalemic (n = 8 mice) and Ccr2−/− treated hypokalemic mice (n = 10). Fischer’s exact test (VT inducibility) and unpaired t test were used (ventricular effective refractory period). i, VT incidence and Vfib incidence in C57BL/6 mice treated with Csf1Ri and undergoing STORM (n = 18 mice) or hypokalemia (n = 9). ECG recordings are from ambulatory mice for 24 hrs. Two-sided Fischer’s exact tests were used. j, Ventricular tachycardia (VT) incidence and ventricular fibrillation (Vfib) incidence in Ccr2−/− mice undergoing STORM (n = 20 mice) or hypokalemia (n = 8). ECG recordings are from ambulatory mice for 24 hrs. Two-sided Fischer’s exact tests were used. Data are mean ± SEM.
Extended Data Fig. 5 |
Extended Data Fig. 5 |. Electrophysiological effects of myeloid cell ablation in.
a, Experimental outline for macrophage depletion by feeding Csf1Ri PLX5622 via potassium-deficient diet in STORM mice. b, Flow plots and quantification of neutrophils (PMN) in STORM mice (n = 5 mice) and mice undergoing Csf1Ri macrophage depletion (n = 7). A two-sided Mann Whitney test was used. c, Infarct size, heart-weight-to-body-weight ratio and heart-weight-to-tibia-length ratio in STORM mice (n = 6 or n = 8 mice, respectively) and macrophage-depleted STORM mice (n = 5 or n = 14, respectively). All measurements were done 24hrs post MI. Two-sided unpaired t tests were used. d, Ventricular tachycardia (VT) incidence and ventricular fibrillation (Vfib) incidence from telemetric ECG recordings in ambulatory STORM mice (n = 11 mice) and macrophage-depleted STORM mice (n = 12). Two-sided Fischer’s exact tests were used. e, Experimental outline for wild type C57BL/6 J and Ccr2−/− mice undergoing STORM procedure. f, Flow plots and quantification of neutrophils (PMN) in C57BL/6 J STORM mice (n = 8) and Ccr2−/− STORM mice (n = 9). Two-sided unpaired t tests were used. g, Infarct size, heart-weight-to-body-weight ratio and heart-weight-to-tibia-length ratio in C57BL/6 J STORM mice (n = 6 or n = 10 mice, respectively) and Ccr2−/− STORM mice (n = 7 or n = 20, respectively). All measurements were done 24hrs post MI. Two-sided unpaired t tests and Mann Whitney test (heart-weight-to-body-weight ratio) were used. h, VT incidence and Vfib incidence obtained by telemetric ECG-recordings in ambulatory C57BL/6 J STORM mice (n = 11 mice) and Ccr2−/− STORM mice (n = 12). Two-sided Fischer’s exact tests were used. i, QT and QTc intervals in STORM mice (n = 10 mice) and STORM mice with Csf1Ri (n = 6–7). Two-sided unpaired t test was used. j, QT and QTc intervals in C57BL/6 J STORM mice (n = 10 mice) and Ccr2−/− STORM mice (n = 7). Two-sided unpaired t test was used. k, Kaplan-Meier survival curves of C57BL/6 STORM mice (n = 32 mice), Ccr2−/− STORM mice (n = 21) and Csf1Ri STORM mice (n = 19). A log-rank Mantel-Cox test was used. Data are mean ± SEM.
Extended Data Fig. 6 |
Extended Data Fig. 6 |. Mitochondrial health after myeloid cell ablation.
a, Electron microscopy. Arrows indicate mitochondria. Scale bar indicates 600 nm. Experiment was repeated independently three times. b, Mitochondrial area and cristae formation in naive C57BL/6 (n = 83 mitochondria (left) or n = 16 (right), n = 1 mouse) and mice undergoing STORM model (n = 178 (left) or n = 80 (right), n = 3 mice, 5 FOVs/mouse). Dots are mitochondria. Two-sided Mann Whitney test (area) and two-sided unpaired t test (cristae) were used. c, Experimental outline. d, Incidence of paracrystalline inclusions in C57BL/6, Csf1Ri and Ccr2−/− STORM mice (mouse numbers are indicated in plots). Two-sided unpaired t tests were used. e, Exopher containing mitochondria in the extracellular space in the infarct of STORM mice. Scale bar indicates 2 μm or 800 nm. Experiment was repeated independently three times. f, Phagocyte with mitochondrial content in the infarct of STORM mouse. Scale bar indicates 600 nm or 200 nm and 1 μm or 400 nm. Experiment was repeated independently three times. g, Histological DAPI, mTmG/myh6-GFP, Mac3 and Tom20 staining from infarcts. Circles indicate area of interest. Scale bar indicates 5 μm. Experiment was repeated independently three times. h, Experimental outline. i, Mitochondrial count per field of view (FOV) in C57BL/6 (n = 15 FOV), mice with Csf1Ri (n = 15) and Ccr2−/− mice (n = 15). n = 3 mice/group, 5 FOVs/mouse. Nested t tests were used. j, Mitochondrial area in wild type mice (n = 80 mitochondria), mice after Csf1Ri (n = 72) and Ccr2−/− mice (n = 66). n = 3 mice/group; 5 FOVs/mouse. Dots are mitochondria. Two-sided Mann Whitney tests were used. k, Percent of cristae area per mitochondrial area in hearts of wild type mice (n = 80 mitochondria), mice after Csf1Ri (n = 72) and Ccr2−/− mice (n = 66). n = 3 mice/group; 5 FOVs/mouse. Dots are mitochondria. Two-sided Mann Whitney tests were used. l, Experimental outline. m, Fluorescence images from cardiac short axis slices after injection of PBS or FCCP. Target-to-background ratio (TBR) from FRI. Background mean fluorescence intensity: image background outside tissue. PBS (n = 3 mice) and FCCP (n = 4 mice). Dots are cardiac slices. Unpaired t test was used. n, Experimental outline o, TBR from FRI. Background fluorescence intensity was measured in image backgrounds. Control mice (n = 18 images), mice treated with Csf1Ri (n = 18 images) and Ccr2−/− mice (n = 17 images), all without MI. n = 3 mice/group. Dots are cardiac slices. Two-sided unpaired t test was used. Data are mean ± SEM.
Extended Data Fig. 7 |
Extended Data Fig. 7 |. Scavenger receptor deletion facilitates post-MI ventricular.
a, Experimental outline for C57BL/6 controls, Cd36−/− and Mertk−/− mice, all undergoing STORM. b, ECG tracing from a Cd36−/− mouse experiencing sustained ventricular tachycardia (VT) transforming into ventricular fibrillation (Vfib) and leading to sudden cardiac death shortly after MI induction. c, VT incidence and Vfib incidence (mouse numbers in plots) from telemetric ECG recordings in ambulatory C57BL/6 STORM mice (n = 7 mice) and Cd36−/− STORM mice (n = 8). Two-sided Fisher’s exact tests were used. d, VT incidence and Vfib incidence (mouse numbers in plots) from telemetric ECG recordings in ambulatory C57BL/6 STORM mice (n = 9 mice) and Mertk−/− STORM mice (n = 9). Two-sided Fisher’s exact tests were used. e, Experimental outline for bone marrow transplantation using wild type Cd36+/+ or Cd36−/− donor mice. Lethally irradiated recipients were Cd36+/+ mice that subsequently underwent STORM. f, VT incidence and Vfib incidence (mouse numbers in plots) from telemetric ECG recordings in ambulatory Cd36+/+ control bone marrow chimeras (n = 8 mice) and Cd36−/− bone marrow chimeras (n = 9) after STORM procedure. Two-sided Fisher’s exact tests were used. g, Flow plots demonstrating Cre activity in resident cardiac macrophages of Cx3cr1CreERT2/Ai9 mice after consuming tamoxifen diet for 10 days. Unpaired t-test was used. h, Experimental outline. Cx3cr1CreER;Mertkfl/fl mice and Cx3cr1CreER control mice were fed with tamoxifen (tamox)-containing diet for 10 days. i, VT incidence and Vfib incidence (mouse numbers in plots) from telemetric ECG recordings in ambulatory Cx3cr1CreER controls and Cx3cr1CreER;Mertkfl/fl mice after STORM procedure. Two-sided Fisher’s exact tests were used. Data are mean ± SEM.
Fig. 1 |
Fig. 1 |. A mouse model of spontaneous electrical storm.
a, Experimental outline for electrical storm induced by hypokalemia (K+) and MI. ECG recordings are from ambulatory mice within 24 hours after MI. b, Plasma potassium levels in control mice (n = 5) and mice fed a potassium-deficient diet (n = 10). A two-way ANOVA followed by Tukey’s multiple comparisons test was used for statistical analysis. c, Flow plots showing neutrophils (PMN), monocytes and cardiac macrophages (Macs) in hearts of hypokalemic and STORM mice. d, Quantification of flow cytometry for cardiac neutrophils, monocytes and macrophages in naive mice (n = 7), hypokalemic mice (n = 7), MI mice (n = 8) and STORM mice 24 hours after MI (n = 6). A one-way ANOVA followed by Tukey’s multiple comparisons test was used for statistical analysis. e, Infarct size in normokalemic (n = 8) and STORM (n = 10) mice by triphenyltetrazolium chloride (TTC) staining 24 hours after MI. An unpaired two-sided t-test was used for statistical analysis. f, ECG from telemetric recordings in ambulatory mice. Arrows indicate regular QRS complex; asterisks indicate extrasystoles and VT ventricular tachycardia. g, Long ECG strip from a STORM mouse. h, Heat map of VT burden expressed as cardiac cycles spent in VT per hour. i, VT incidence, Vfib incidence and VT and Vfib burden expressed as seconds spent within 24 hours after MI. Mouse numbers are indicated in brackets. A one-sided chi-square test was used for statistical analysis. j, Heart rate during sinus rhythm (SR) and VT expressed as beats per minute (bpm) in STORM mice. A Mann–Whitney test was used for statistical analysis. k, Kaplan–Meier survival curve of mice with MI (n = 10) and STORM (n = 32). A two-sided log-rank Mantel–Cox test was used for statistical analysis. Data are mean ± s.e.m.
Fig. 2 |
Fig. 2 |. Neutrophils promote ventricular arrhythmia.
a, Experimental outline for Ly6GTdtomato mice with neutrophil depletion, numbers indicate days. b, Flow cytometry for blood neutrophils (PMN) and monocytes in Ly6GTdtomato mice undergoing isotype or anti-Ly6G antibody injections. c, Blood neutrophil counts in isotype (n = 6) and anti-Ly6G depleting antibody (n = 7) injected mice. A two-sided unpaired t-test was used. d, Experimental outline for neutrophil depletion in STORM mice, numbers indicate days. e, ECG recordings in STORM mice treated with isotype or anti-Ly6G antibody. f, VT burden and Vfib burden detected during 24 hours after MI (isotype: n = 8, anti-Ly6G: n = 9). A two-sided unpaired t-test was used. g, Experimental design. Langendorff-perfused hearts from Myh6-GCaMP8 mice were injected with anti-Ly6G (AF647) to label neutrophils, 3 hours after MI. h, Original ECG recordings indicating imaging acquisition protocol. i, Confocal microscopy of infarct border zone. Blood flow determination beads separate the remote from the infarct zone. Scale bar, 250 μm. j, Cardiomyocyte with asynchronous Ca2+ signal (arrow) surrounded by Ly6G+ neutrophils. Scale bar, 100 μm. This experiment was repeated independently four times. k, Time series of Ca2+ signal used to identify Ca2+ hotspots. The arrow indicates an asynchronous myocyte (see also Supplementary Video 1). l, Dyssynchrony map reveals asynchronous cardiomyocytes and was merged with the Ly6G channel. m, Distances from neutrophils to Ca2+ hotspots (n = 11 FOVs from n = 3 mice). A one-way ANOVA was used. n, Distance of neutrophils to a random spot (gray bar) or a Ca2+ hotspot (green). A two-sided unpaired t-test was used. o, Neutrophil counts from patients with STEMI and PPCI in the Oxford cohort (n = 217) were stratified across the following groups: (i) no arrhythmia (n = 91 patients), (ii) ventricular ectopic beats (n = 57 patients), (iii) non-sustained VT (n = 54 patients) and (iv) sustained VT or Vfib (n = 15 patients). A Jonkheere–Terpstra test was used. p, Patients with acute MI (n = 795, Mass General Brigham cohort) were dichotomized at the median neutrophil count and followed for a composite outcome of death or cardiac arrest. A Gehan–Breslow–Wilcoxon test was used. Data are mean ± s.e.m. FACS, fluorescence-activated cell sorting.
Fig. 3 |
Fig. 3 |. Neutrophil Lcn2 promotes ventricular arrhythmia.
a, Experimental outline. FRI of ROS in hearts 5 hours after MI using the CellROX imaging agent. b, Fluorescence images from cardiac short axis slices after injection of CellROX. c, Quantification of TBR from FRI. Data are from isotype antibody-injected controls (n = 6 mice) and neutrophil-depleted mice (n = 7). Each dot represents a cardiac slice. A two-sided Mann–Whitney test was used for statistical analysis. d, scRNA-seq data obtained in three mice after MI. Uniform manifold approximation and projection (UMAP) for dimension reduction indicates Lcn2 expression and (e) cell population identities. f, Violin plots indicating Lcn2 expression in neutrophils, monocytes and macrophages after MI (n = 3 mice 24 hours after MI, n = 3 mice 48 hours after MI and n = 8 mice 4 days after MI; FDR < 0.001). g, Lcn2 expression by quantitative PCR in ischemic myocardium (n = 4 mice), flow-isolated macrophages (Macs) (n = 8), monocytes (Monos) (n = 8) and neutrophils (Neutros) (n = 7) 5 hours after MI. Lcn2 expression was normalized to Gapdh. A one-way ANOVA followed by Tukey’s multiple comparisons test was used for statistical analysis. h, Experimental outline. FRI of ROS in Lcn2-deficient mice and Lcn2+/+ controls 5 hours after MI using CellROX sensor. i, Fluorescence images after intravenous CellROX injection. j, Quantification of TBR from FRI. Data are from Lcn2+/+ (n = 6) and Lcn2−/− (n = 4) mice. Each dot represents a cardiac slice. A two-sided Mann–Whitney test was used for statistical analysis. k, Experimental outline. Bone marrow donors were either wild-type (Lcn2+/+) or Lcn2−/− mice. Transplant recipients were wild-type mice that subsequently underwent STORM protocol. l, ECG recordings from STORM Lcn2+/+ control and Lcn2−/− bone marrow chimeras. m, VT burden and Vfib burden (Lcn2+/+ control, n = 8 mice; Lcn2−/− n = 9 mice) within 24 hours after MI. A two-sided Mann–Whitney test (VT burden) and two-sided unpaired t-test (Vfib burden) was used for statistical analysis. Data are mean ± s.e.m. FDR, false discovery rate; LV, left ventricular; NK, natural killer.
Fig. 4 |
Fig. 4 |. Macrophages protect against ventricular arrhythmia.
a, Experimental outline for macrophage depletion with Csf1R inhibitor in STORM mice. b, Flow plots and quantification of cardiac monocytes and macrophages (Macs) in STORM control mice (n = 6) and after macrophage depletion by Csf1Ri (n = 7). A two-sided unpaired t-test (monocytes) and a two-sided Mann–Whitney test (macrophages) were used for statistical analysis. c, ECG recordings from STORM mice with and without macrophage depletion after MI. d, VT burden (STORM control mice, n = 11; STORM Csf1Ri, n = 15) and Vfib burden (STORM control mice, n = 6; STORM Csf1R, n = 5) within 24 hours after MI. Two-sided Mann–Whitney tests were used for statistical analysis. e, Experimental outline. f, Flow cytometry for cardiac monocytes and macrophages (Macs) in wild-type STORM control mice (n = 8) and Ccr2−/− STORM mice (n = 9). A two-sided unpaired t-test (monocytes) and a two-sided Mann–Whitney test (macrophages) were used for statistical analysis. g, ECG recordings from wild-type STORM control and Ccr2−/− STORM mice. h, VT burden (wild-type STORM control, n = 10 mice; Ccr2−/− STORM, n = 19) and Vfib burden (wild-type STORM control, n = 8; Ccr2−/− STORM, n = 14) after MI. Two-sided Mann–Whitney tests were used for statistical analysis. Data are mean ± s.e.m.
Fig. 5 |
Fig. 5 |. Macrophage depletion accelerates myocyte death and impairs efferocytosis during acute MI.
a, Experimental outline. b, Flow plots after gating for cardiac macrophages (Macs). Bar graphs show quantification of TdTomato+ cardiac monocytes (Monos) and TdTomato+Macs at 5 hours (n = 7 mice) or 72 hours (n = 7 mice) after MI. One-way ANOVA followed by Tukey’s multiple comparison’s test was used for statistical analysis. c, Experimental outline for wild-type C57BL/6 mice, mice after Csf1Ri macrophage depletion and Ccr2−/− mice, all after STORM protocol. d, TUNEL, troponin and DAPI staining of sections from the infarct region 5 hours after MI. Scale bar, 50 μm. This experiment was repeated independently twice. e, Analysis of TUNEL+ myocytes in hearts of C57BL/6 mice (n = 6), mice treated with Csf1Ri (n = 7) and Ccr2−/− mice (n = 8), all after STORM protocol. FOVs were analyzed in the infarct core. Two-sided unpaired t-tests were used for statistical analysis. f, Caspase-3 expression by quantitative PCR in infarct tissue from C57BL/6 mice (n = 7), mice treated with Csf1Ri (n = 7) and Ccr2−/− mice (n = 8), all after STORM protocol. Data from macrophage depletion groups were normalized to data from STORM mice. Two-sided Mann–Whitney tests were used for statistical analysis. g, Enzymatic activity of Caspase-3 measured in left ventricular infarct tissue from C57BL/6 mice (n = 5 (left) or n = 7 (right)), mice treated with Csf1Ri (n = 7) and Ccr2−/− mice (n = 5). Two-sided unpaired t-tests were used for statistical analysis. h, Experimental outline and images from FRI after intravenous injection of Annexin-VT750. i, TBR from FRI. Data are from STORM control mice (n = 22 slices), mice treated with Csf1Ri (n = 23) and Ccr2−/− mice (n = 25). Data are from n = 4–5 mice per group. Each dot represents a cardiac slice from an infarcted mouse. Two-sided Mann–Whitney tests were used for statistical analysis. Data are mean ± s.e.m.
Fig. 6 |
Fig. 6 |. Macrophages preserve mitochondrial integrity after MI.
a, Experimental outline. b, Electron microscopy in infarcts. Arrows indicate mitochondria; scale bar, 600 nm. This experiment was repeated independently three times. c, Mitochondrial count per FOV in wild-type mice (n = 15 FOVs), mice with Csf1Ri (n = 21) and Ccr2−/− mice (n = 13) (n = 3 mice per group, 3–5 FOVs per mouse). A two-sided nested t-test was used. d, Mitochondrial area in infarcts of wild-type mice (n = 178 mitochondria), mice after Csf1Ri (n = 239) and Ccr2−/− mice (n = 229) (n = 3 mice per group; 5 FOVs per mouse). Dots indicate individual mitochondria. A two-sided Mann–Whitney test was used. e, Percent cristae area per mitochondrial area in infarcts of wild-type (n = 80 mitochondria), mice with Csf1Ri (n = 98) and Ccr2−/− mice (n = 87) (n = 3 mice per group, 10 FOVs per mouse). Each dot represents a mitochondrion. A two-sided unpaired t-test (Csf1Ri) and Mann–Whitney test (Ccr2−/−) was used. f, Electron micrographs of mitochondrial ultrastructure with paracrystalline inclusions (arrows). g, Paracrystalline inclusions per mitochondrion in wild-type (n = 19 mitochondria), after Csf1Ri macrophage depletion (n = 31) and Ccr2−/− mice (n = 44). Dots are mitochondria. A two-sided Mann–Whitney test was used. h, Electron micrographs of free mitochondria (arrows) in the extracellular space. Scale bar, 1 μm. This experiment was repeated independently three times. i, Free mitochondria in wild-type (n = 15 FOVs), mice with Csf1Ri (n = 15) and Ccr2−/− mice (n = 19) (n = 3 mice per group, 5–7 FOVs per mouse). A two-sided nested t-test was used. j, Enzymatic activity of mitochondrial complex II in infarcts of wild-type (n = 7 mice), after Csf1Ri (n = 7) and Ccr2−/− mice (n = 9). A two-sided Mann–Whitney test was used. k, Enzymatic activity of mitochondrial complex IV in infarcts of wild-type (n = 7 mice), after Csf1Ri (n = 6) and Ccr2−/− (n = 8), all after STORM protocol. A two-sided Mann–Whitney test was used. l, Experimental outline of TMRE perchlorate imaging. m, Representative images of TMRE imaging. n, TBR from FRI. STORM mice (n = 19 slices), STORM mice with Csf1Ri (n = 14) and STORM Ccr2−/− mice (n = 12). Data are from n = 3 or n = 4 mice per group. Dots indicate cardiac slices. A two-sided Mann–Whitney test was used. Data are mean ± s.e.m.
Fig. 7 |
Fig. 7 |. Phagocytosis receptor deletion causes sudden cardiac death.
a, scRNA-seq data from n = 3 mice each on days 1, 2 and 4 after MI. Uniform manifold approximation and projection (UMAP) indicates cell subset. b, UMAP of Mertk expression by cell populations shown in a. c, UMAP of Cd36 expression by cell populations shown in a. d, Mertk and Cd36 expression in flow-sorted macrophages (Macs) (n = 8 mice), monocytes (n = 8 mice) and neutrophils (n = 7 mice) 5 hours after MI, normalized to Gapdh. One-way ANOVA followed by Tukey’s multiple comparisons test were used for statistical analysis. e, Experimental outline. C57BL/6, Cd36−/− and Mertk−/− mice underwent STORM protocol. f, Kaplan–Meier survival curve of wild-type (n = 14 mice, left, and n = 11 mice, right), Cd36−/− (n = 14) and Mertk−/− (n = 10) mice. P values were calculated using the log-rank (Mantel–Cox) test. g, ECG recordings from C57BL/6, Cd36−/− and Mertk−/− mice, all after STORM procedure. h, VT burden and Vfib burden in C57BL/6 mice (n = 9) and Cd36−/− mice (n = 9) after STORM procedure, within 6 hours after MI. A two-sided Mann–Whitney test was used for statistical analysis. i, VT burden and Vfib burden in C57BL/6 mice (n = 8) and Mertk−/− mice (n = 9) after STORM procedure, within 6 hours after MI. Two-sided Mann–Whitney tests were used for statistical analysis. j, Experimental outline. Bone marrow donors were either wild-type or Cd36−/− mice. Recipient wild-type mice underwent STORM protocol. k, VT burden and Vfib burden in wild-type controls (Cd36+/+, n = 8 mice) or Cd36−/− (n = 9) bone marrow chimeras 24 hours after MI. Two-sided Mann–Whitney tests were used for statistical analysis. l, Experimental outline. Cx3cr1CreERt;Mertkfl/fl mice and Cx3cr1CreERt control mice were fed a tamoxifen (tamox) diet for 10 days. All mice underwent STORM protocol after tamoxifen exposure. m, VT burden and Vfib burden in Cx3cr1CreERt controls (n = 8 mice) or Cx3cr1CreERt;Mertkfl/fl mice (n = 8) 24 hours after MI. A two-sided unpaired t-test (VT burden) and a Mann–Whitney test (Vfib burden) were used for statistical analysis. Data are mean ± s.e.m.
Fig. 8 |
Fig. 8 |
Summary of findings.

Comment in

References

    1. Chugh SS et al. Current burden of sudden cardiac death: multiple source surveillance versus retrospective death certificate-based review in a large U.S. community. J. Am. Coll. Cardiol. 44, 1268–1275 (2004). - PubMed
    1. Borne RT, Varosy PD & Masoudi FA Implantable cardioverter-defibrillator shocks: epidemiology, outcomes, and therapeutic approaches. JAMA Intern. Med. 173, 859–865 (2013). - PubMed
    1. Bhar-Amato J, Davies W & Agarwal S Ventricular arrhythmia after acute myocardial infarction: ‘the perfect storm’. Arrhythm. Electrophysiol. Rev. 6, 134–139 (2017). - PMC - PubMed
    1. Suga H Ventricular energetics. Physiol. Rev. 70, 247–277 (1990). - PubMed
    1. Brown DA & O’Rourke B Cardiac mitochondria and arrhythmias. Cardiovasc. Res. 88, 241–249 (2010). - PMC - PubMed