

National trends in the use of oral chemotherapy over 13 years
- PMID: 36034797
- PMCID: PMC9399396
- DOI: 10.3389/fphar.2022.909948
National trends in the use of oral chemotherapy over 13 years
Abstract
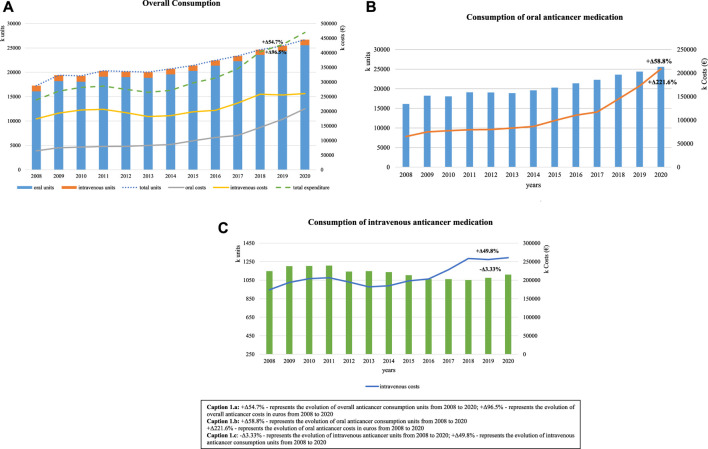
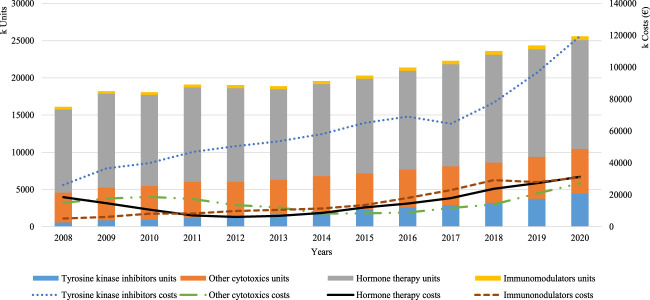
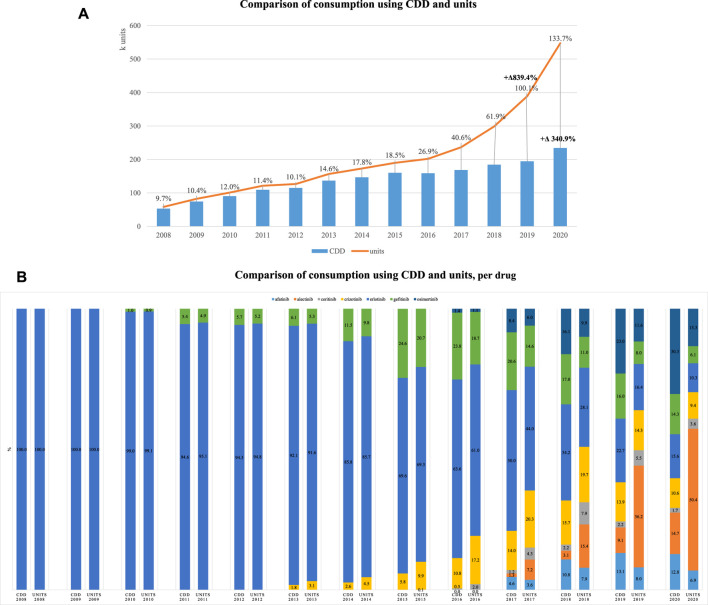
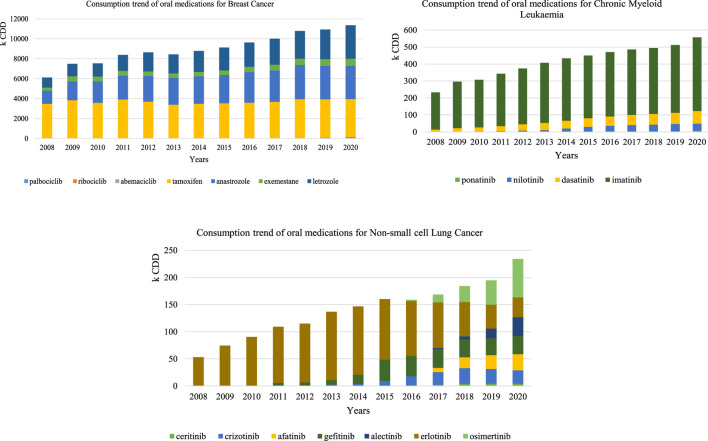
Background: Systemic cancer therapy has traditionally been administered using an intravenous (IV) route, implying patients' frequent visits to hospitals to access to their therapy. If we consider the actual pipeline in oncology, oral chemotherapy will be the main component of cancer treatment in the next few years. This shift in the administration route requires different care models in order to guarantee treatment efficacy and safety. Objective: To analyze time trends in oral chemotherapy consumption in Portugal. Method: Oral chemotherapy consumption over a 13-year period (2008-2020) was analyzed, considering dispensed units by the administration route with respective costs, resorting to the drug regulatory agency (INFARMED I.P.) database. Oral consumption patterns were further explored using common daily doses (CDD) for three conditions, including chronic myeloid leukemia (CML), non-small-cell lung cancer (NSCLC), and breast cancer (BC), to adjust for the effect of varying doses. Data were analyzed descriptively resorting to Microsoft Office Excel 2010. Results: Overall chemotherapy consumption increased +Δ54.7%, with the highest contribution in units observed in oral forms (+Δ58.8%). The total expenditure increased +Δ96.5%, and despite the increase in oral forms (+Δ221.6%), intravenous forms continued to be the major cost driver, with an important contribution from immunotherapy. Much of the increase was led by the approval of 40 new IV and 48 new oral cancer medications with higher costs introduced in the market. Using CDD as an alternative metric to units had varying impacts by indication. The observed increases seemed to focus on specific cancer sites with varying effect; in CML, there was a 2.39-fold increase, compared to 4.41 for NSCLC and 1.86 for BC. However, for BC, two distinct sub-patterns were observed for hormone therapy (increasing 1.83) and for the novel tyrosine kinase inhibitors (increasing 40.8). Conclusion: The growing use of oral chemotherapy is obvious and calls for investments in supporting patients in managing medication adherence and adverse events. The shifts in the healthcare system are complex and need to be prioritized. Our data suggest that priority could be attributed to cancer sites driving innovation, namely, advanced breast cancer.
Keywords: common daily doses; consumption data; hospital oncology; medication adherence; oral chemotherapy; time trends.
Copyright © 2022 Moreira, Bernardo, Ramos, Aguiar and Alves da Costa.
Conflict of interest statement
The authors declare that the research was conducted in the absence of any commercial or financial relationships that could be construed as a potential conflict of interest.
Figures
References
-
- ACSS - Administração Central do Sistema de Saúde (2019). Relatório de Atividade 2018. Available at: http://www.acss.min-saude.pt/wp-content/uploads/2016/10/Relatorio-de-Ati... .
LinkOut - more resources
Full Text Sources