. 2022 Aug 11:13:866696.
doi: 10.3389/fgene.2022.866696. eCollection 2022.

An inflammation-related signature could predict the prognosis of patients with kidney renal clear cell carcinoma

Affiliations

An inflammation-related signature could predict the prognosis of patients with kidney renal clear cell carcinoma

Qingxin Yu et al. Front Genet. .

Abstract

Background: Kidney renal clear cell carcinoma (KIRC) is an inflammation-related carcinoma, and inflammation has been recognized as an important factor in inducing carcinogenesis. To further explore the role of inflammation in KIRC, we developed an inflammation-related signature and verified its correlation with the tumor micro-environment. Methods: After the differential inflammation-related prognostic genes were screened by Lasso regression, the inflammation-related signature (IRS) was constructed based on the risk score of multivariate Cox regression. Then, the prognostic value of the IRS was evaluated by Kaplan-Meier analysis, receiver operating characteristic (ROC) curve analysis and multivariate Cox regression. Gene set variation analysis (GSVA) was applied to screen out enriched signaling pathways. Infiltrated immune cells, tumor mutational burden (TMB) and immune checkpoints were explored by CIBERSORTx and maftool. Results: Four genes (TIMP1, PLAUR, CCL22, and IL15RA) were used to construct the IRS in patients with KIRC. Kaplan-Meier analysis and multivariate Cox regression identified that the IRS could independently predict the prognosis of patients with KIRC in the training and validation groups. The diagnostic value of the nomogram increased from 0.811 to 0.845 after adding the IRS to the multiparameter ROC analysis. The GSVA results indicated that IRS was closely related to primary immunodeficiency and antigen processing and presentation. The immune checkpoint LAG3 was highly expressed in patients with high-risk score (p < 0.05), while CD274 (PD-L1) and HAVCR2 were highly expressed in patients with low-risk score (p < 0.001). There was a significant positive correlation between the high-risk score group and CD8+ T, activated CD4+ memory T, gamma and delta regulatory T and M0 macrophage cells, while the low-risk score group was negatively associated with B memory, plasma, resting CD4+ memory T, activated NK, M1 macrophages and resting mast cells. Conclusion: We found that the IRS might serve as a biomarker to predict the survival of KIRC. Moreover, patients with high or low-risk score might be sensitive to immune drugs at different immune checkpoints.

Keywords: immune checkpoint; immune infiltration; inflammation; renal clear cell carcinoma; signature.


Conflict of interest statement

The authors declare that the research was conducted in the absence of any commercial or financial relationships that could be construed as a potential conflict of interest.

Figures

FIGURE 1
FIGURE 1
The workflow of this study.
FIGURE 2
FIGURE 2
Construction of inflammation-related signature: the overall survival of included patients (A), the Venn diagram of differentially coexpressed genes (B), the GO result (C), the KEGG result (D), the results of five genes in multivariate Cox regression model (E), the result of protein–protein interaction network (F).
FIGURE 3
FIGURE 3
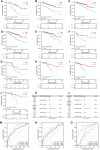
Prognostic performance of the inflammation-related signature: Principal component analysis results of the TCGA training group (A), TCGA test (B) and GSE29609 (C). Kaplan-Meier analysis results of the TCGA training group (D), TCGA test (E) and GSE29609 (F). The risk score plots of TCGA training group (G), TCGA test (H) and GSE29609 (I).
FIGURE 4
FIGURE 4
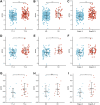
The risk scores of patients in different clinicopathological parameters: TCGA training group: T stage (A), M stage (B), AJCC stage (C). TCGA-test group: T stage (D), M stage (E), AJCC stage (F). GSE29609: T stage (G), M stage (H), AJCC stage (I).
FIGURE 5
FIGURE 5
The prognostic ability of the risk scores: Kaplan-Meier analysis results of subgroups in TCGA training group: female (A), male (B), T1_2 (C), M0 (D) and AJCC stage I-II (E); Kaplan-Meier analysis results of subgroups in TCGA test group: female (F), male (G), T1_2 (H), M0 (I) and AJCC stage I_II (J); Results of multivariate Cox regression model for parameters in TCGA training group (K); Results of multivariate Cox regression model for parameters in TCGA test group (L); Receiver operating characteristic curve analysis results of TCGA training group (M), TCGA test group (N) and GSE29609 (O).
FIGURE 6
FIGURE 6
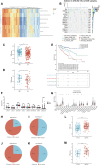
The results of gene set variation analysis (A), the results of tumor mutational burden analysis (B), the correlation of tumor mutational burden scores and the risk scores in the TCGA training group (C), the correlation of tumor mutational burden scores and the risk scores in the TCGA test group (D), the OS of the high-risk group compared with that in the low-risk group in the TCGA training group (E), the expression of immune checkpoints in the high-risk group compared with that in the low-risk group in the TCGA training group (F), and the immune cell infiltration in the high-risk group compared with that in the low-risk group in the TCGA training group (G). The TIDE immunotherapy response outcome of high-risk score group (H) and low-risk score group (I) in the TCGA training group, high-risk score group (J) and low-risk score group (K) in the TCGA test group. The TIDE score of the TCGA training group (L) and the TCGA test group (M).
FIGURE 7
FIGURE 7
The nomogram of the inflammation-related gene signature and its performance: the nomogram (A), the calibration curves of the nomogram (B), the calibration curves of different factors (C) and the nomogram (D), the result of ROC analysis with different factors (E), the result of multiparameter ROC analysis without the risk scores (F), the result of multiparameter ROC analysis with the risk scores (G).

Similar articles

Cited by

References

    1. Borrelli C., Ricci B., Vulpis E., Fionda C., Ricciardi M. R., Petrucci M. T., et al. (2018). Drug-induced senescent multiple myeloma cells elicit NK cell proliferation by direct or exosome-mediated IL15 trans-presentation. Cancer Immunol. Res. 6 (7), 860–869. 10.1158/2326-6066.Cir-17-0604 - DOI - PubMed
    1. De Mattia E., Polesel J., Roncato R., Labriet A., Bignucolo A., Gagno S., et al. (2021). IL15RA and SMAD3 genetic variants predict overall survival in metastatic colorectal cancer patients treated with folfiri therapy: A new paradigm. Cancers (Basel) 13 (7), 1705. 10.3390/cancers13071705 - DOI - PMC - PubMed
    1. Edeline J., Mottier S., Vigneau C., Jouan F., Perrin C., Zerrouki S., et al. (2012). Description of 2 angiogenic phenotypes in clear cell renal cell carcinoma. Hum. Pathol. 43 (11), 1982–1990. 10.1016/j.humpath.2012.01.023 - DOI - PubMed
    1. Edgar R., Domrachev M., Lash A. E. (2002). Gene expression Omnibus: NCBI gene expression and hybridization array data repository. Nucleic Acids Res. 30 (1), 207–210. 10.1093/nar/30.1.207 - DOI - PMC - PubMed
    1. Escudier B., Porta C., Schmidinger M., Rioux-Leclercq N., Bex A., Khoo V., et al. (2019). Renal cell carcinoma: ESMO clinical practice guidelines for diagnosis, treatment and follow-up. Ann. Oncol. 30 (5), 706–720. 10.1093/annonc/mdz056 - DOI - PubMed