

Winter locations of red-throated divers from geolocation and feather isotope signatures
- PMID: 36035269
- PMCID: PMC9399444
- DOI: 10.1002/ece3.9209
Winter locations of red-throated divers from geolocation and feather isotope signatures
Abstract
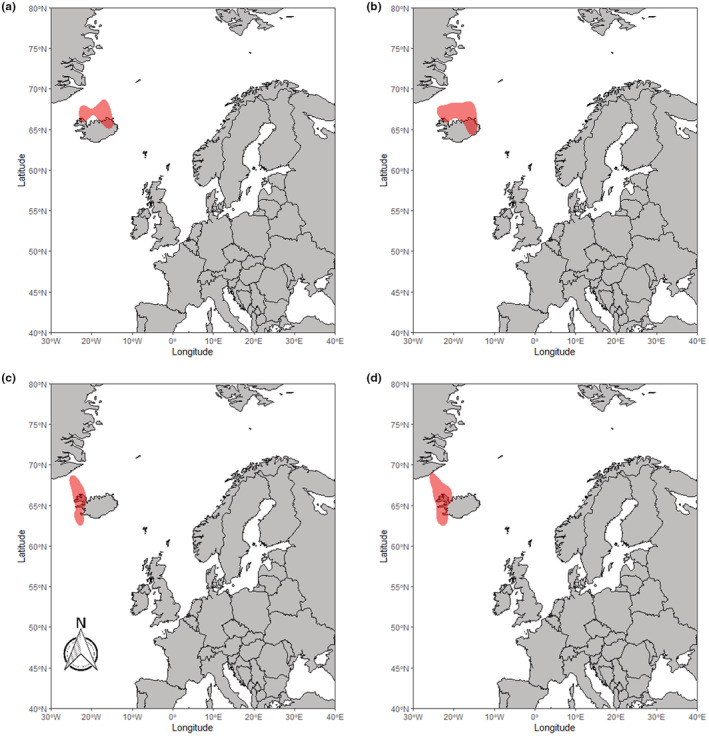
Migratory species have geographically separate distributions during their annual cycle, and these areas can vary between populations and individuals. This can lead to differential stress levels being experienced across a species range. Gathering information on the areas used during the annual cycle of red-throated divers (RTDs; Gavia stellata) has become an increasingly pressing issue, as they are a species of concern when considering the effects of disturbance from offshore wind farms and the associated ship traffic. Here, we use light-based geolocator tags, deployed during the summer breeding season, to determine the non-breeding winter location of RTDs from breeding locations in Scotland, Finland, and Iceland. We also use δ15N and δ13C isotope signatures, from feather samples, to link population-level differences in areas used in the molt period to population-level differences in isotope signatures. We found from geolocator data that RTDs from the three different breeding locations did not overlap in their winter distributions. Differences in isotope signatures suggested this spatial separation was also evident in the molting period, when geolocation data were unavailable. We also found that of the three populations, RTDs breeding in Iceland moved the shortest distance from their breeding grounds to their wintering grounds. In contrast, RTDs breeding in Finland moved the furthest, with a westward migration from the Baltic into the southern North Sea. Overall, these results suggest that RTDs breeding in Finland are likely to encounter anthropogenic activity during the winter period, where they currently overlap with areas of future planned developments. Icelandic and Scottish birds are less likely to be affected, due to less ship activity and few or no offshore wind farms in their wintering distributions. We also demonstrate that separating the three populations isotopically is possible and suggest further work to allocate breeding individuals to wintering areas based solely on feather samples.
Keywords: GLS; Gavia; isotope; loon; movement.
© 2022 The Authors. Ecology and Evolution published by John Wiley & Sons Ltd.
Conflict of interest statement
All authors declare no conflict of interest.
Figures


References
-
- Bairlein, F. (2001). Results of bird ringing in the study of migration routes. Ardea, 89, 7–19.
-
- Bindoff, A. D. , Wotherspoon, S. J. , Guinet, C. , & Hindell, M. A. (2018). Twilight‐free geolocation from noisy light data. Methods in Ecology and Evolution, 9, 1190–1198.
-
- Bodey, T. W. , Cleasby, I. R. , Bell, F. , Parr, N. , Schultz, A. , Votier, S. C. , & Bearhop, S. (2018). A phylogenetically controlled meta‐analysis of biologging device effects on birds: Deleterious effects and a call for more standardized reporting of study data. Methods in Ecology and Evolution, 9(4), 946–955.
-
- Buckingham, L. , Bogdanova, M. I. , Green, J. A. , Dunn, R. E. , Wanless, S. , Bennett, S. , Bevan, R. M. , Call, A. , Canham, M. , Corse, C. J. , Harris, M. P. , Heward, C. J. , Jardine, D. C. , Lennon, J. , Parnaby, D. , Redfern, C. P. F. , Scott, L. , Swann, R. L. , … Daunt, F. (2022). Interspecific variation in non‐breeding aggregation: A multi‐colony tracking study of two sympatric seabirds. Marine Ecology Progress Series, 684, 181–197.
-
- Buckingham, L. , Daunt, F. , Bogdanova, M. I. , Furness, R. W. , Bennett, S. , Duckworth, J. , Dunn, R. E. , Wanless, S. , Harris, M. P. , Jardine, D. C. , Newell, M. A. , Ward, R. M. , Weston, E. D. , & Green, J. A. (2022). Synchrony in peak non‐breeding season energy expenditure for guillemots from four colonies: Implications for severity of marine threats. Journal of Avian Biology. In Review
LinkOut - more resources
Full Text Sources
Miscellaneous
