. 2022 Jul 8;4(9):100532.
doi: 10.1016/j.jhepr.2022.100532. eCollection 2022 Sep.

Novel role of macrophage TXNIP-mediated CYLD-NRF2-OASL1 axis in stress-induced liver inflammation and cell death

Affiliations

Novel role of macrophage TXNIP-mediated CYLD-NRF2-OASL1 axis in stress-induced liver inflammation and cell death

Yongqiang Zhan et al. JHEP Rep. .

Abstract

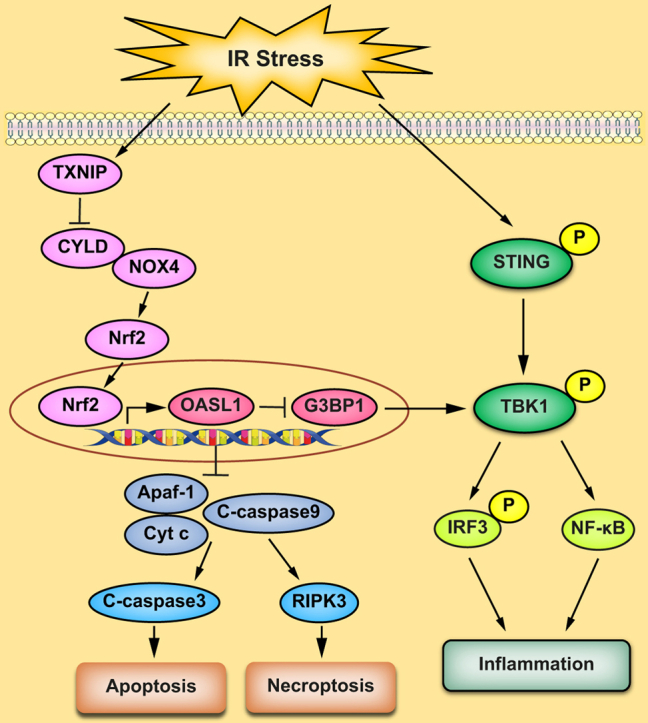
Background & aims: The stimulator of interferon genes (STING)/TANK-binding kinase 1 (TBK1) pathway is vital in mediating innate immune and inflammatory responses during oxidative/endoplasmic reticulum (ER) stress. However, it remains unknown whether macrophage thioredoxin-interacting protein (TXNIP) may regulate TBK1 function and cell death pathways during oxidative/ER stress.

Methods: A mouse model of hepatic ischaemia/reperfusion injury (IRI), the primary hepatocytes, and bone marrow-derived macrophages were used in the myeloid-specific TXNIP knockout (TXNIPM-KO) and TXNIP-proficient (TXNIPFL/FL) mice.

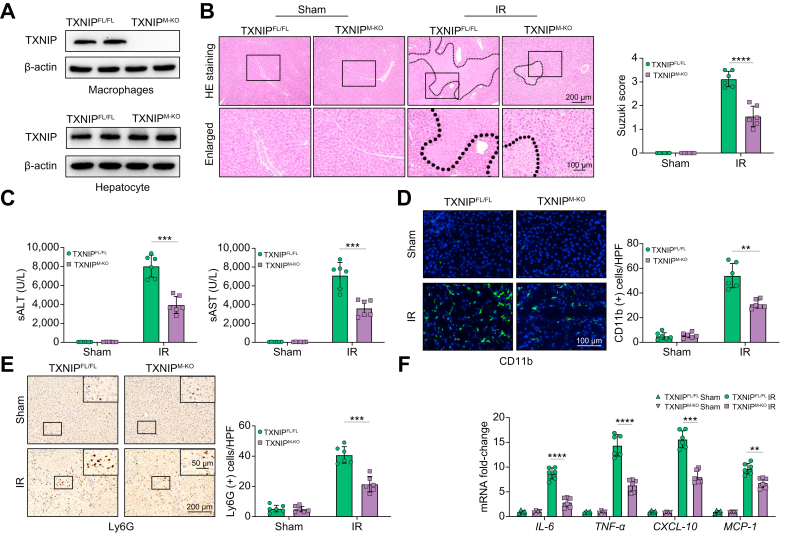
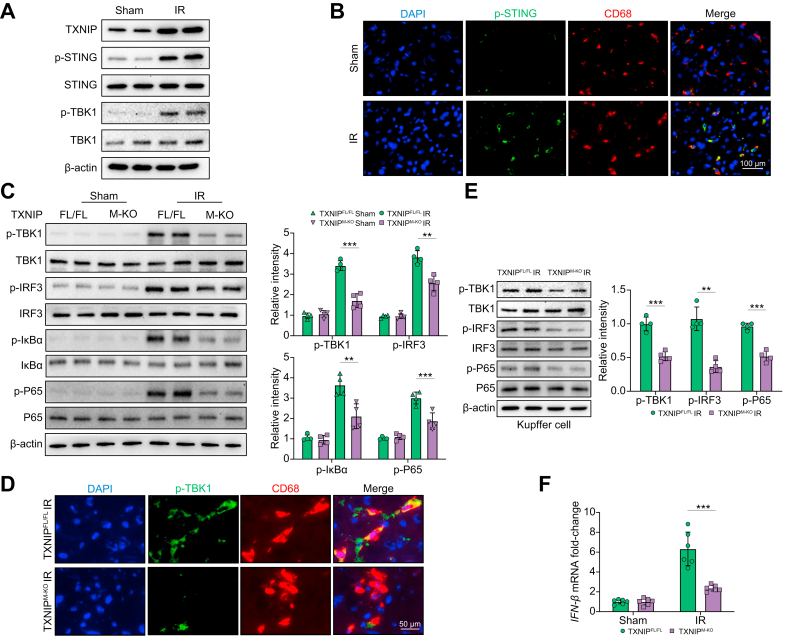
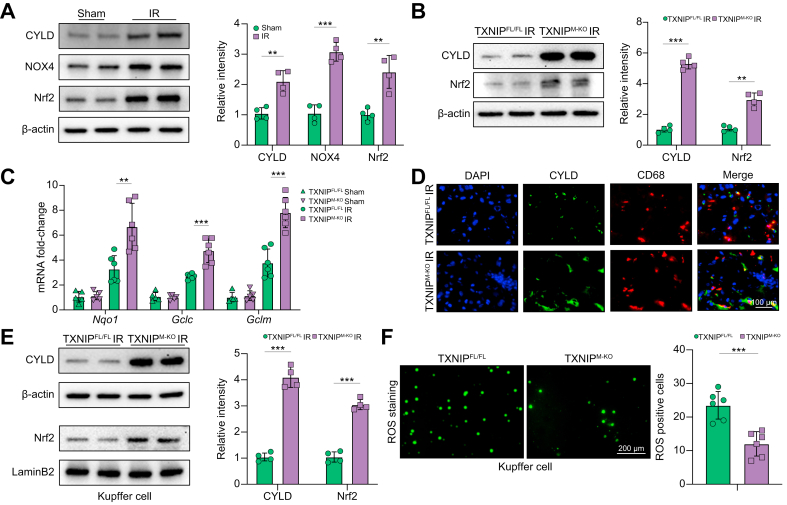
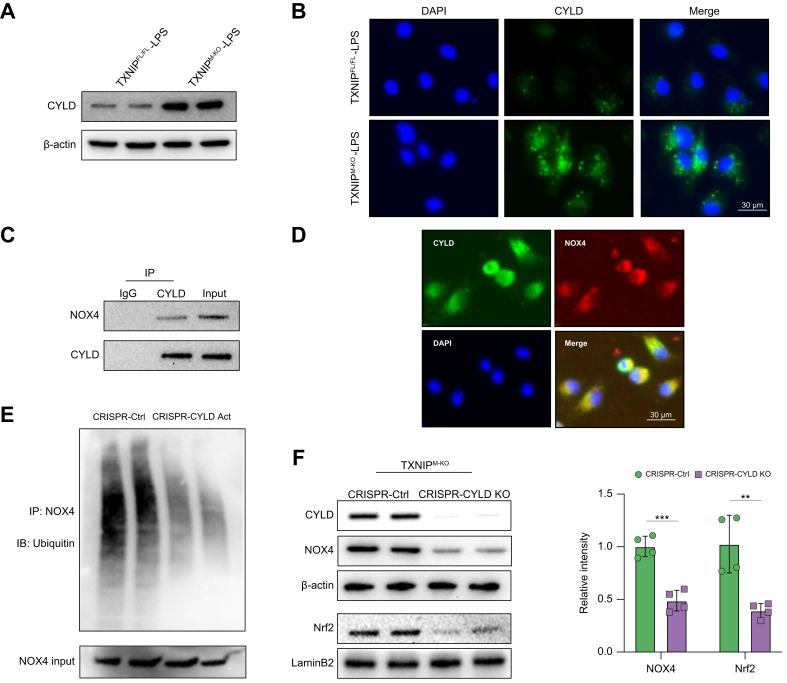
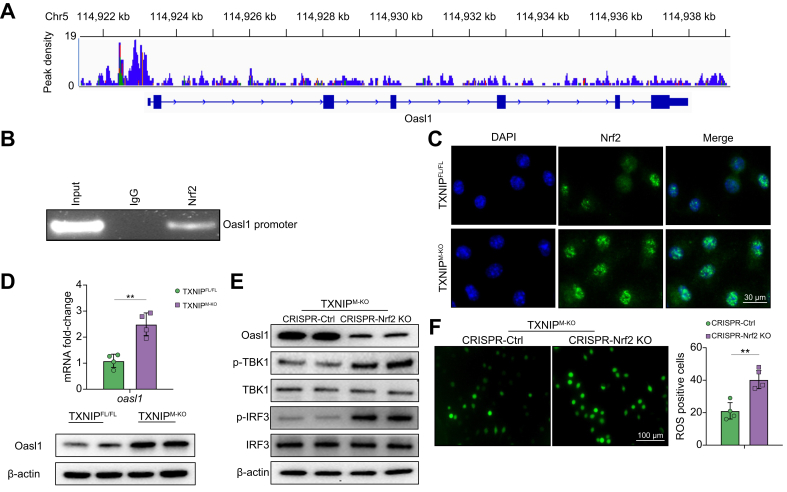
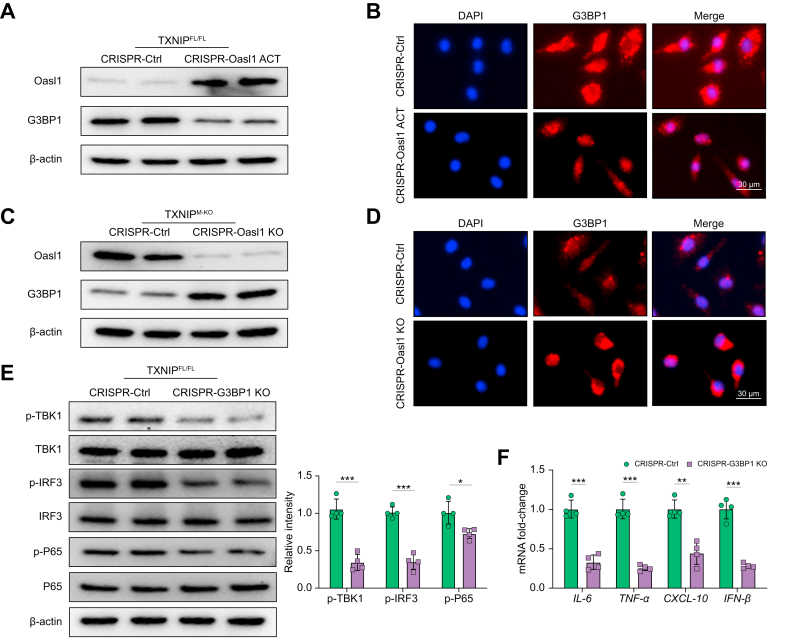
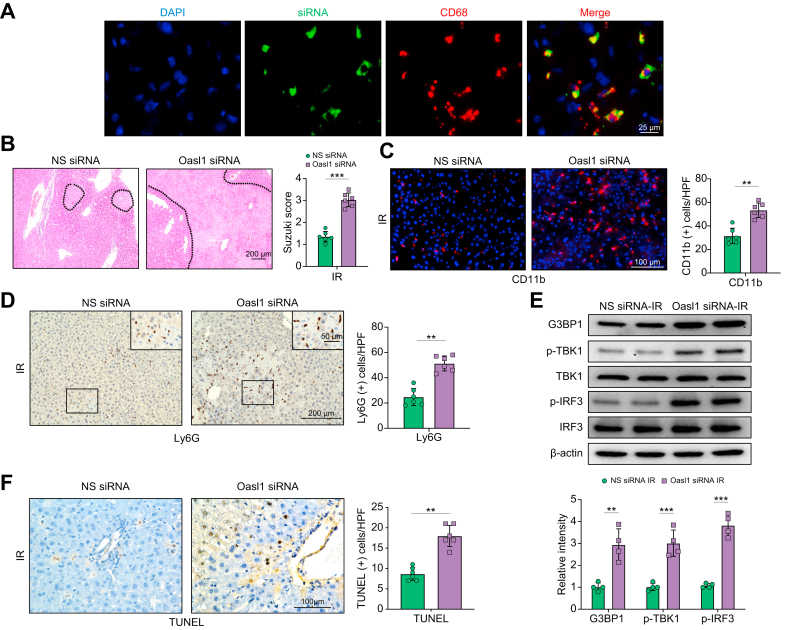
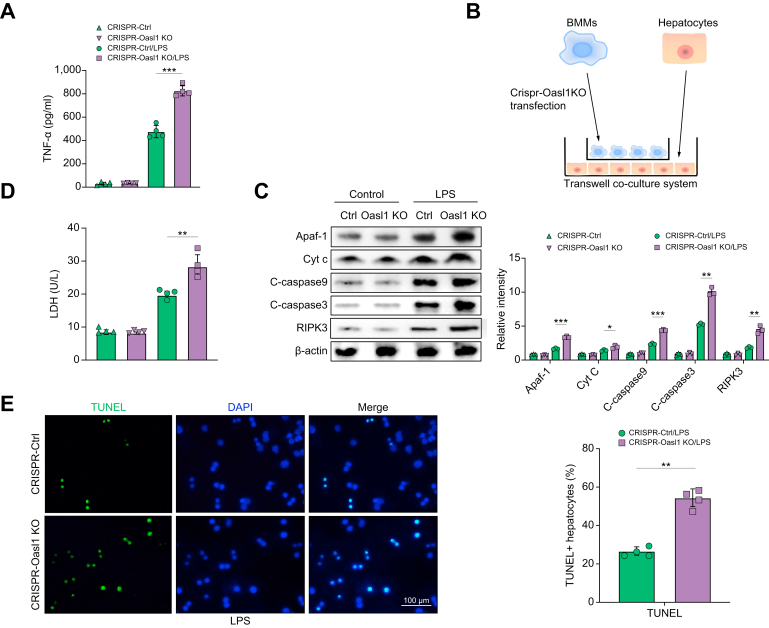
Results: The TXNIPM-KO mice were resistant to ischaemia/reperfusion (IR) stress-induced liver damage with reduced serum alanine aminotransferase (ALT)/aspartate aminotransferase (AST) levels, macrophage/neutrophil infiltration, and pro-inflammatory mediators compared with the TXNIPFL/FL controls. IR stress increased TXNIP, p-STING, and p-TBK1 expression in ischaemic livers. However, TXNIPM-KO inhibited STING, TBK1, interferon regulatory factor 3 (IRF3), and NF-κB activation with interferon-β (IFN-β) expression. Interestingly, TXNIPM-KO augmented nuclear factor (erythroid-derived 2)-like 2 (NRF2) activity, increased antioxidant gene expression, and reduced macrophage reactive oxygen species (ROS) production and hepatic apoptosis/necroptosis in IR-stressed livers. Mechanistically, macrophage TXNIP deficiency promoted cylindromatosis (CYLD), which colocalised and interacted with NADPH oxidase 4 (NOX4) to enhance NRF2 activity by deubiquitinating NOX4. Disruption of macrophage NRF2 or its target gene 2',5' oligoadenylate synthetase-like 1 (OASL1) enhanced Ras GTPase-activating protein-binding protein 1 (G3BP1) and TBK1-mediated inflammatory response. Notably, macrophage OASL1 deficiency induced hepatocyte apoptotic peptidase activating factor 1 (APAF1), cytochrome c, and caspase-9 activation, leading to increased caspase-3-initiated apoptosis and receptor-interacting serine/threonine-protein kinase 3 (RIPK3)-mediated necroptosis.

Conclusions: Macrophage TXNIP deficiency enhances CYLD activity and activates the NRF2-OASL1 signalling, controlling IR stress-induced liver injury. The target gene OASL1 regulated by NRF2 is crucial for modulating STING-mediated TBK1 activation and Apaf1/cytochrome c/caspase-9-triggered apoptotic/necroptotic cell death pathway. Our findings underscore a novel role of macrophage TXNIP-mediated CYLD-NRF2-OASL1 axis in stress-induced liver inflammation and cell death, implying the potential therapeutic targets in liver inflammatory diseases.

Lay summary: Liver inflammation and injury induced by ischaemia and reperfusion (the absence of blood flow to the liver tissue followed by the resupply of blood) is a significant cause of hepatic dysfunction and failure following liver transplantation, resection, and haemorrhagic shock. Herein, we uncover an underlying mechanism that contributes to liver inflammation and cell death in this setting and could be a therapeutic target in stress-induced liver inflammatory injury.

Keywords: ALT, alanine aminotransferase; APAF1, apoptotic peptidase activating factor 1; ASK1, apoptosis signal-regulating kinase 1; AST, aspartate aminotransferase; Apoptosis; BMM, bone marrow-derived macrophage; CXCL-10, C-X-C motif chemokine ligand 10; CYLD, cyclindromatosis; ChIP, chromatin immunoprecipitation; DAMP, damage-associated molecular pattern; DUB, deubiquitinating enzyme; ER, endoplasmic reticulum; ES, embryonic stem; G3BP1; G3BP1, Ras GTPase-activating protein-binding protein 1; GCLC, glutamate-cysteine ligase catalytic subunit; GCLM, glutamate-cysteine ligase regulatory subunit; IHC, immunohistochemistry; INF-β, interferon-β; IR, ischaemia/reperfusion; IRF3; IRF3, interferon regulatory factor 3; IRF7, IFN-regulating transcription factor 7; IRI, ischaemia/reperfusion injury; Innate immunity; KO, knockout; LPS, lipopolysaccharide; Liver inflammation; Lyz2, Lysozyme 2; MCP-1, monocyte chemoattractant protein 1; NOX2, NADPH oxidase 2; NOX4, NADPH oxidase 4; NQO1, NAD(P)H quinone dehydrogenase 1; NRF2, nuclear factor (erythroid-derived 2)-like 2; NS, non-specific; Necroptosis; OASL1, 2′,5′oligoadenylate synthetase-like 1; PAMP, pathogen-derived molecular pattern; RIPK3, receptor-interacting serine/threonine-protein kinase 3; ROS, reactive oxygen species; STING; STING, stimulator of interferon genes; TBK1, TANK-binding kinase 1; TLR4, Toll-like receptor 4; TNF-α, tumour necrosis factor-alpha; TRX, thioredoxin; TSS, transcription start sites; TXNIP, thioredoxin-interacting protein; TXNIPFL/FL, floxed TXNIP; TXNIPM-KO, myeloid-specific TXNIP KO; UTR, untranslated region; sALT, serum ALT; sAST, serum AST; siRNA, small interfering RNA.


Conflict of interest statement

The authors declare no conflict of interest. Please refer to the accompanying ICMJE disclosure forms for further details.

Figures

None
Graphical abstract
Fig. 1
Fig. 1
Disruption of myeloid-specific TXNIP ameliorates IR-induced liver injury and diminishes macrophage/neutrophil accumulation and proinflammatory mediators in IR-stressed liver. The TXNIPFL/FL and TXNIPM-KO mice were subjected to 90 min of partial liver warm ischaemia, followed by 6 h of reperfusion. (A) The TXNIP expression was detected in hepatocytes and liver macrophages from IR-stressed livers by Western blot assay. Representative of 4 experiments. (B) Representative histological staining (H&E) of ischaemic liver tissue (n = 6 mice/group) and Suzuki’s histological score. Scale bars, 200 and 100 μm. (C) Liver function in serum samples was evaluated by sALT and sAST levels (IU/L) (n = 6 samples/group). (D) Immunofluorescence staining of CD11b+ macrophages in ischaemic livers (n = 6 mice/group). Quantification of CD11b+ macrophages. Scale bars, 100 μm. (E) Immunohistochemistry staining of Ly6G+ neutrophils in ischaemic livers (n = 6 mice/group). Quantification of Ly6G+ neutrophils. Scale bars, 200 and 50 μm. (F) Quantitative RT-PCR analysis of IL-6, TNF-α, CXCL-10, and MCP-1 mRNA levels in ischaemic livers (n = 6 samples/group). All data represent the mean ± SD. Statistical analysis was performed using the Permutation t test. ∗∗p <0.01. ∗∗∗p <0.005, ∗∗∗∗p <0.001. ALT, alanine aminotransferase; AST, aspartate aminotransferase; CXCL-10, chemokine (C-X-C motif) ligand 10; HPF, high power field; IR, ischaemia/reperfusion; MCP-1, monocyte chemoattractant protein 1; sALT, serum ALT; sAST, serum AST; TNF-α, tumour necrosis factor alpha; TXNIP, thioredoxin-interacting protein; TXNIPFL/FL, floxed TXNIP; TXNIPM-KO, myeloid-specific TXNIP knockout.
Fig. 2
Fig. 2
Disruption of myeloid-specific TXNIP inhibits STING-mediated TBK1 and IRF3/NF-κB activation in IR-stressed liver. The WT, TXNIPFL/FL, and TXNIPM-KO mice were subjected to 90 min of partial liver warm ischaemia, followed by 6 h of reperfusion. (A) Western-assisted analysis of TXNIP, p-STING, STING, p-TBK1, and TBK1 in the WT livers after IR stress. (B) Immunofluorescence staining of p-STING and CD68 in ischaemic livers (n = 6 mice/group). Scale bars, 100 μm. (C) Western-assisted analysis and relative density ratio of p-TBK1, TBK1, p-IRF3, IRF3, p-IκBα, IκBα, p-P65, and P65 in the TXNIPFL/FL and TXNIPM-KO livers after IR stress. (D) Immunofluorescence staining of p-TBK1 and CD68 in ischaemic livers (n = 6 mice/group). Scale bars, 50 μm. (E) The Kupffer cells were isolated from the TXNIPFL/FL and TXNIPM-KO livers after IR stress. Western-assisted analysis and relative density ratio of p-TBK1, TBK1, p-IRF3, IRF3, p-P65, and P65 in Kupffer cells from the TXNIPFL/FL and TXNIPM-KO livers after IR stress. Representative of 3 experiments. (F) Quantitative RT-PCR analysis of IFN-β mRNA levels in Kupffer cells from the TXNIPFL/FL and TXNIPM-KO livers after IR stress (n = 6 samples/group). All Western blots represent 4 experiments, and the data represent the mean ± SD. Statistical analysis was performed using the Permutation t test. ∗∗p <0.01. ∗∗∗p <0.005. IFN-β, interferon-β; IR, ischaemia/reperfusion; IRF3, interferon regulatory factor 3; STING, stimulator of interferon genes; TBK1, TANK-binding kinase 1; TXNIP, thioredoxin-interacting protein; TXNIPFL/FL, floxed TXNIP; TXNIPM-KO, myeloid-specific TXNIP knockout; WT, wild type.
Fig. 3
Fig. 3
Disruption of myeloid-specific TXNIP promotes CYLD and activates the NRF2 pathway in IR-stressed liver. The WT, TXNIPFL/FL, and TXNIPM-KO mice were subjected to 90 min of partial liver warm ischaemia, followed by 6 h of reperfusion. (A) Western-assisted analysis and relative density ratio of CYLD, NOX4, and NRF2 in IR-stressed livers. (B) Western-assisted analysis and relative density ratio of CYLD and NRF2 in the TXNIPFL/FL and TXNIPM-KO livers after IR stress. (C) Quantitative RT-PCR analysis of NQO1, GCLC, and GCLM mRNA levels in ischaemic livers (n = 6 samples/group). (D) Immunofluorescence staining of CYLD and CD68 in ischaemic livers (n = 6 mice/group). Scale bars, 100 μm. (E) The Kupffer cells were isolated from ischaemic livers, and then these cells were cultured for 2 h at 37 °C. Western-assisted analysis and relative density ratio of CYLD and nuclear NRF2 in Kupffer cells from the TXNIPFL/FL and TXNIPM-KO livers after IR stress. (F) The Kupffer cells (2 × 105/each group) were isolated from ischaemic livers and then cultured for 2 h. Detection of ROS production by Carboxy-H2DFFDA in Kupffer cells from the TXNIPFL/FL and TXNIPM-KO livers after IR stress. Quantification of ROS-producing Kupffer cells (green) (n = 6 mice/group). Scale bars, 200 μm. All Western blots represent 4 experiments, and the data represent the mean ± SD. Statistical analysis was performed using the Permutation t test. ∗∗p <0.01, ∗∗∗p <0.005. CYLD, cyclindromatosis; GCLC, glutamate-cysteine ligase catalytic subunit; GCLM, glutamate-cysteine ligase regulatory subunit; H2DFFDA, 2',7'-dihydrofluorescein diacetate; IR, ischaemia/reperfusion; NOX4, NADPH oxidase 4; NQO1, NAD(P)H quinone dehydrogenase 1; NRF2, nuclear factor (erythroid-derived 2)-like 2; ROS, reactive oxygen species; TXNIP, thioredoxin-interacting protein; TXNIPFL/FL, floxed TXNIP; TXNIPM-KO, myeloid-specific TXNIP knockout; WT, wild type.
Fig. 4
Fig. 4
CYLD interacts with NOX4 and regulates NRF2 activation by deubiquitinating NOX4 in macrophages. BMMs (1 × 106) were cultured with LPS (100 ng/ml) for 6 h. (A) Western blot analysis of CYLD in LPS-stimulated macrophages from the TXNIPFL/FL and TXNIPM-KO mice. (B) Immunofluorescence staining for CYLD expression in macrophages after LPS stimulation (n = 3–4 samples/group). DAPI was used to visualise nuclei. Scale bars, 30 μm. (C) Immunoprecipitation analysis of CYLD and NOX4 in LPS-stimulated macrophages. (D) Immunofluorescence staining for macrophage CYLD (green) and NOX4 (red) colocalisation in LPS-stimulated macrophages. DAPI was used to visualise nuclei (blue). Scale bars, 30 μm. (E) BMMs were transfected with CRISPR-mediated CYLD activation or control plasmid for 48 h. An immunoprecipitation assay was performed with anti-NOX4 and Ub antibodies. Representative of 3 experiments. (F) BMMs were transfected with CRISPR/Cas9-mediated CYLD KO or control vector. Western-assisted analysis and relative density ratio of CYLD, NOX4, and nuclear NRF2 in LPS-stimulated macrophages from the TXNIPM-KO mice. All immunoblots represent 4 experiments, and the data represent the mean ± SD. Statistical analysis was performed using the permutation t test. ∗∗p <0.01, ∗∗∗p <0.005. BMM, bone marrow-derived macrophage; Cas9, CRISPR associated protein 9; CRISPR, clustered regularly interspaced short palindromic repeats; CYLD, cyclindromatosis; GCLC, glutamate-cysteine ligase catalytic subunit; GCLM, glutamate-cysteine ligase regulatory subunit; IB, Immunoblotting; IP, Immunoprecipitation; IR, ischaemia/reperfusion; KO, knockout; LPS, lipopolysaccharide; NOX4, NADPH oxidase 4; NQO1, NAD(P)H quinone dehydrogenase 1; NRF2, nuclear factor (erythroid-derived 2)-like 2; ROS, reactive oxygen species; TXNIP, thioredoxin-interacting protein; TXNIPFL/FL, floxed TXNIP; TXNIPM-KO, myeloid-specific TXNIP KO; WT, wild type.
Fig. 5
Fig. 5
NRF2 targets OASL1 and modulates TBK1-mediated inflammatory response in macrophages. BMMs were collected and fixed after incubating LPS (100 ng/ml). Following chromatin shearing and NRF2 antibody selection, the precipitated DNA fragments bound by NRF2-containing protein complexes were used for sequencing. (A) Localisation of NRF2-binding sites on the mouse OASL1 gene. The 15 exons, 14 introns, 3′ UTR, 5′ UTR, and TSS of the mouse OASL1 gene on chromosome 5 are shown. (B) ChIP-PCR analysis of NRF2 binding to the OASL1 promoter. Protein-bound chromatin was prepared from BMMs and immunoprecipitated with NRF2 antibody, and then the immunoprecipitated DNA was analysed by PCR. The normal IgG was used as a negative control. (C) Immunofluorescence staining for nuclear NRF2 expression in LPS-stimulated macrophages from the TXNIPFL/FL and TXNIPM-KO mice (n = 3–4 samples/group). Scale bars, 30 μm. (D) Analysis of OASL1 mRNA levels and protein expression of LPS-stimulated macrophages from the TXNIPFL/FL and TXNIPM-KO mice. (E) BMMs were transfected with CRISPR/Cas9-mediated NRF2 KO or control vector. Western blot analysis of OASL1, p-TBK1, TBK1, p-IRF3, and IRF3 in LPS-stimulated macrophages from the TXNIPM-KO mice. (F) Detection of ROS production by Carboxy-H2DFFDA in LPS-stimulated macrophages from the TXNIPM-KO mice. Quantification of ROS-producing macrophages (green) (n = 4 samples/group). Scale bars, 100 μm. All immunoblots represent 4 experiments, and the data represent the mean ± SD. Statistical analysis was performed using the permutation t test. ∗∗p <0.01. BMM, bone marrow-derived macrophage; Cas9, CRISPR associated protein 9; CRISPR, clustered regularly interspaced short palindromic repeats; IRF3, interferon regulatory factor 3; KO, knockout; LPS, lipopolysaccharide; NRF2, nuclear factor (erythroid-derived 2)-like 2; OASL1, 2′,5′ oligoadenylate synthetase-like 1; ROS, reactive oxygen species; TBK1, TANK-binding kinase 1; TSS, transcription start sites; TXNIP, thioredoxin-interacting protein; TXNIPFL/FL, floxed TXNIP; TXNIPM-KO, myeloid-specific TXNIP KO; UTR, untranslated region.
Fig. 6
Fig. 6
OASL1 inhibits TBK1-mediated inflammation through regulation of G3BP1 activation in macrophages. (A) BMMs were isolated from TXNIPFL/FL mice transfected with p-CRISPR-OASL1 activation or control vector followed by 6 h of LPS (100 ng/ml) stimulation. Western-assisted analysis of OASL1 and G3BP1. (B) Immunofluorescence staining for the G3BP1 expression in LPS-stimulated macrophages after transfecting p-CRISPR-OASL1 activation or control vector (n = 3–4 samples/group). DAPI was used to visualise nuclei. Scale bars, 30 μm. (C) BMMs from TXNIPM-KO mice were transfected with the p-CRISPR-OASL1 KO or control vector followed by 6 h of LPS stimulation. Western blot analysis of OASL1 and G3BP1. (D) Immunofluorescence staining for the G3BP1 expression in LPS-stimulated macrophages after transfecting p-CRISPR-OASL1 KO or control vector (n = 3–4 samples/group). DAPI was used to visualise nuclei. Scale bars, 30 μm. (E) BMMs from TXNIPFL/FL mice were transfected with the p-CRISPR-G3BP1 KO or control vector followed by 6 h of LPS stimulation. Western blot analysis and relative density ratio of p-TBK1, TBK1, p-IRF3, IRF3, p-P65, and P65. (F) Quantitative RT-PCR analysis of IL-6, TNF-α, CXCL-10, and IFN-β mRNA levels in LPS-stimulated macrophages after transfecting p-CRISPR-G3BP1 KO or control vector (n = 4 samples/group). All Western blots represent 4 experiments, and the data represent the mean ± SD. Statistical analysis was performed using the permutation t test. ∗p <0.05, ∗∗p <0.01, ∗∗∗p <0.005. BMM, bone marrow-derived macrophage; CRISPR, clustered regularly interspaced short palindromic repeats; CXCL-10, chemokine (C-X-C motif) ligand 10; G3BP1, Ras GTPase-activating protein-binding protein 1; INF-β, interferon-β; IRF3, interferon regulatory factor 3; KO, knockout; LPS, lipopolysaccharide; OASL1, 2′,5′ oligoadenylate synthetase-like 1; TBK1, TANK-binding kinase 1; TNF-α, tumour necrosis factor-alpha; TXNIP, thioredoxin-interacting protein; TXNIPFL/FL, floxed TXNIP; TXNIPM-KO, myeloid-specific TXNIP KO.
Fig. 7
Fig. 7
OASL1 is essential for inhibiting G3BP1/TBK1 activation and cell death in myeloid TXNIP-deficient livers in response to IR. The TXNIPM-KO mice were injected via tail vein with OASL1 siRNA (2.5 mg/kg) or NS control siRNA mixed with mannose-conjugated polymers at 4 h before ischaemia. (A) Immunofluorescence staining of AlexaFluor488-labelled control siRNA and CD68-positive macrophages in ischaemic liver tissue (n = 6 mice/group), Scale bars, 25 μm. (B) Representative histological staining (H&E) of ischaemic liver tissue (n = 6 mice/group) and Suzuki’s histological score. Scale bars, 200 μm. (C) Immunofluorescence staining of CD11b+ macrophages in ischaemic livers (n = 6 mice/group). Quantification of CD11b+ macrophages. Scale bars, 100 μm. (D) Immunohistochemistry staining of Ly6G+ neutrophils in ischaemic livers (n = 6 mice/group). Quantification of Ly6G+ neutrophils. Scale bars, 200 and 50 μm. (E) Western blot analysis and relative density ratio of G3BP1, p-TBK1, and p-IRF3. Representative of 4 experiments. (F) Liver apoptosis by TUNEL staining in ischaemic livers (n = 6 mice/group). Results were scored semiquantitatively by averaging the number of apoptotic cells. Scale bars, 100 μm. All data represent the mean ± SD. Statistical analysis was performed using the permutation t test. ∗∗p <0.01, ∗∗∗p <0.005. G3BP1, Ras GTPase-activating protein-binding protein 1; HPF, high power field; IR, ischaemia/reperfusion; IRF3, interferon regulatory factor 3; NS, non-specific; OASL1, 2′,5′ oligoadenylate synthetase-like 1; siRNA, small interfering RNA; TBK1, TANK-binding kinase 1; TXNIP, thioredoxin-interacting protein; TXNIPM-KO, myeloid-specific TXNIP knockout.
Fig. 8
Fig. 8
Macrophage TXNIP deficiency-mediated OASL1 inhibits stress-induced hepatocyte death via modulating Apaf1/Cyt c/caspase-9 activation. BMMs were isolated from TXNIPM-KO mice and transfected with the p-CRISPR-OASL1 KO or control vector followed by LPS stimulation. (A) ELISA analysis of supernatant TNF-α levels in LPS-stimulated BMMs (n = 4 samples/group). (B) The schematic figure for the macrophage/hepatocyte coculture system. (C) BMMs transfected with the p-CRISPR-OASL1 KO were stimulated with LPS and then cocultured with primary hepatocytes supplemented with or without H2O2 for 24 h. Western-assisted analysis and relative density ratio of Apaf-1, Cyt c, cleaved caspase-9, cleaved caspase-3, and RIPK3 in hepatocytes after coculture. Representative of 4 experiments. (D) LDH release from hepatocytes in cocultures (n = 4 samples/group). (E) Immunofluorescence staining of TUNEL+ hepatocytes after coculture (n = 4 samples/group). Scale bars, 100 μm. All data represent the mean ± SD. Statistical analysis was performed using Permutation t-test. ∗p <0.05, ∗∗p <0.01, ∗∗∗p <0.001. Apaf1, apoptotic peptidase activating factor 1; BMM, bone marrow-derived macrophage; CRISPR, clustered regularly interspaced short palindromic repeats; Cyt c, cytochrome c; KO, knockout; LPS, lipopolysaccharide; OASL1, 2′,5′ oligoadenylate synthetase-like 1; TNF-α, tumour necrosis factor-alpha; TXNIP, thioredoxin-interacting protein; TXNIPM-KO, myeloid-specific TXNIP KO; RIPK3, receptor-interacting serine/threonine-protein kinase 3.

Similar articles

Cited by

References

    1. Li C., Sheng M., Lin Y., Xu D., Tian Y., Zhan Y., et al. Functional crosstalk between myeloid Foxo1-beta-catenin axis and Hedgehog/Gli1 signaling in oxidative stress response. Cell Death Differ. 2021;28:1705–1719. - PMC - PubMed
    1. Dara L., Ji C., Kaplowitz N. The contribution of endoplasmic reticulum stress to liver diseases. Hepatology. 2011;53:1752–1763. - PMC - PubMed
    1. Soehnlein O., Lindbom L. Phagocyte partnership during the onset and resolution of inflammation. Nat Rev Immunol. 2010;10:427–439. - PubMed
    1. Lotze M.T., Zeh H.J., Rubartelli A., Sparvero L.J., Amoscato A.A., Washburn N.R., et al. The grateful dead: damage-associated molecular pattern molecules and reduction/oxidation regulate immunity. Immunol Rev. 2007;220:60–81. - PubMed
    1. Yue S., Zhu J., Zhang M., Li C., Zhou X., Zhou M., et al. The myeloid heat shock transcription factor 1/beta-catenin axis regulates NLR family, pyrin domain-containing 3 inflammasome activation in mouse liver ischemia/reperfusion injury. Hepatology. 2016;64:1683–1698. - PMC - PubMed