. 2022 Jul 18;19(9):1364-1376.
doi: 10.7150/ijms.75092. eCollection 2022.

Apparent Diffusion Coefficient Values and Dynamic Contrast-Enhanced Magnetic Resonance Perfusion are Potential Predictors for Grading Meningiomas

Affiliations

Apparent Diffusion Coefficient Values and Dynamic Contrast-Enhanced Magnetic Resonance Perfusion are Potential Predictors for Grading Meningiomas

Sri Andreani Utomo et al. Int J Med Sci. .

Abstract

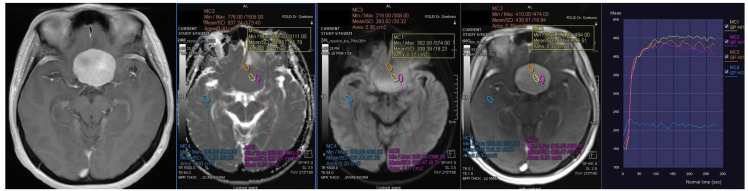
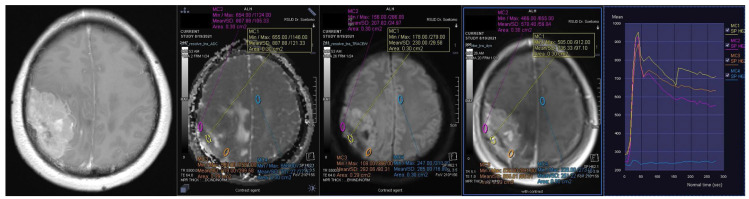
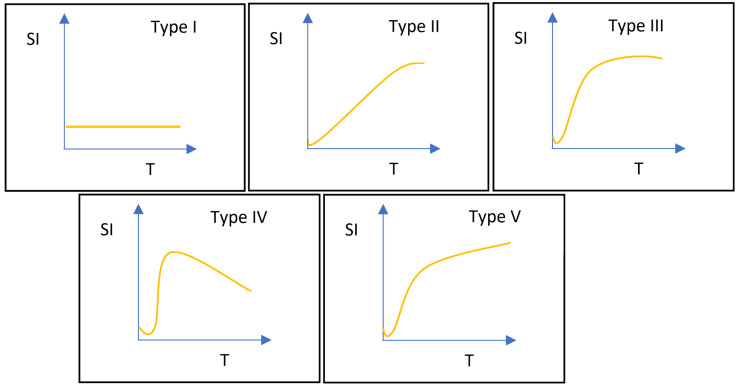
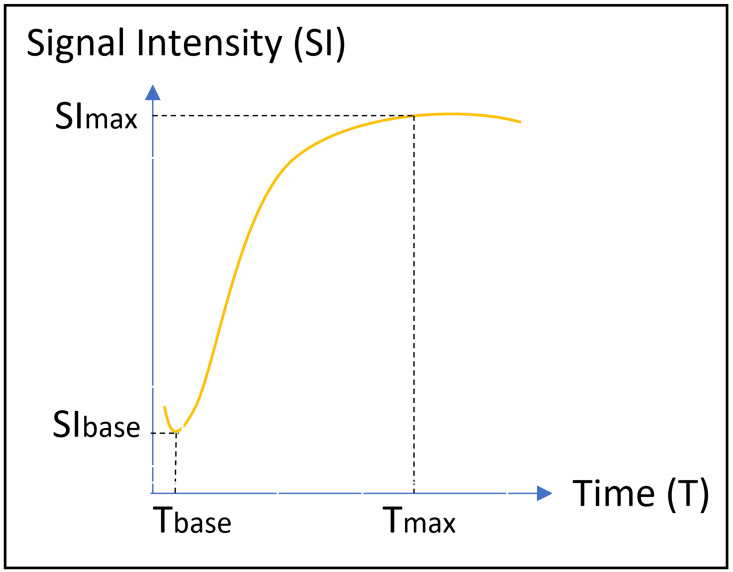
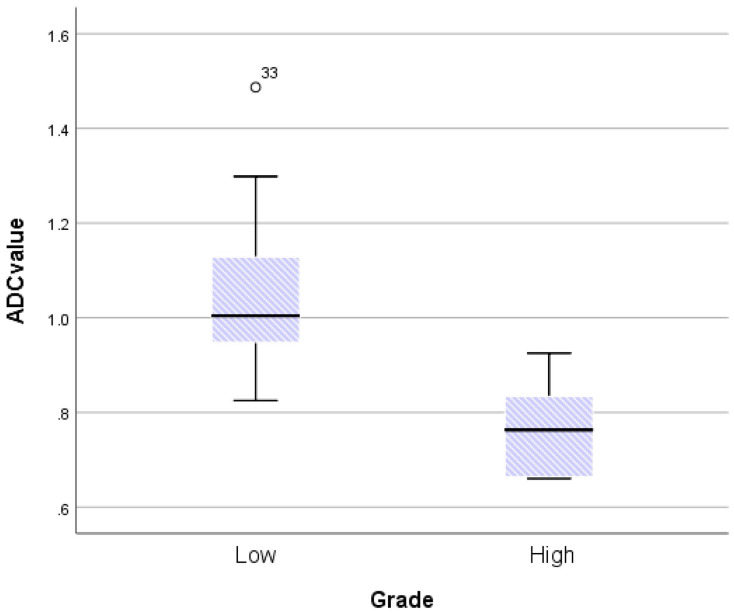
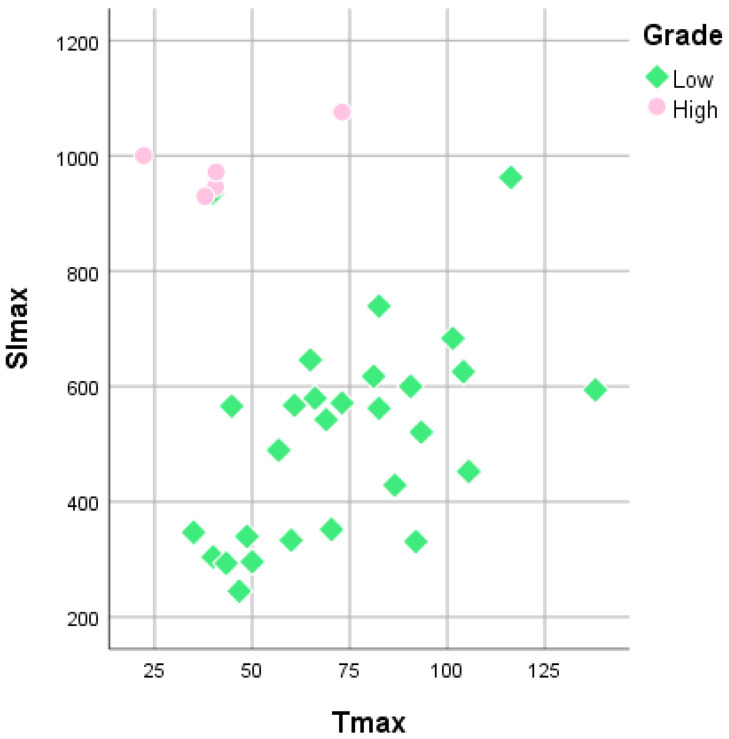
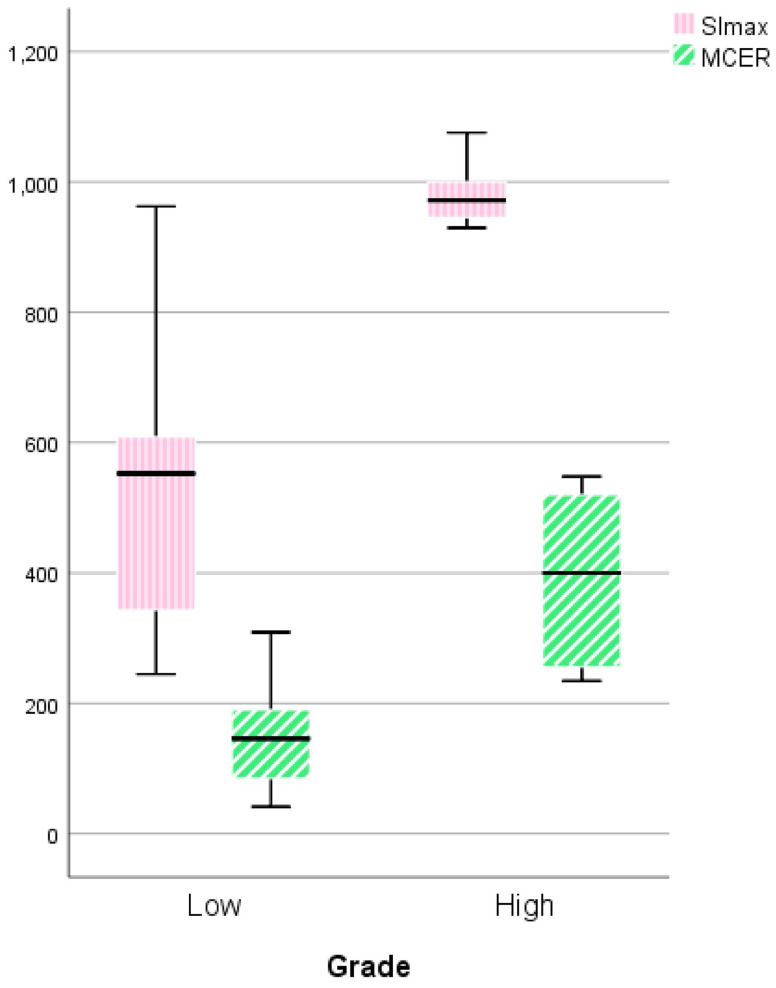
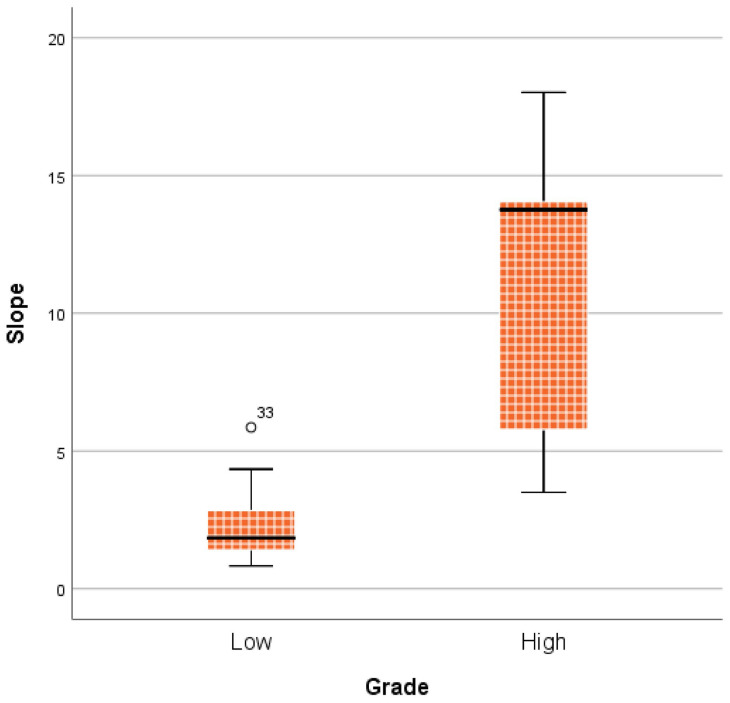
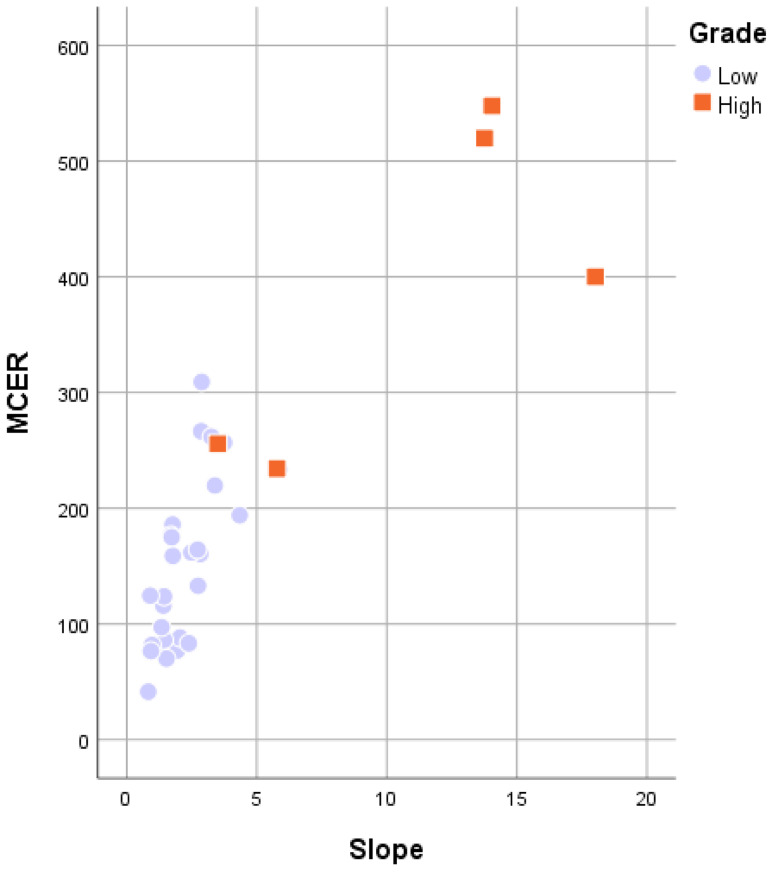
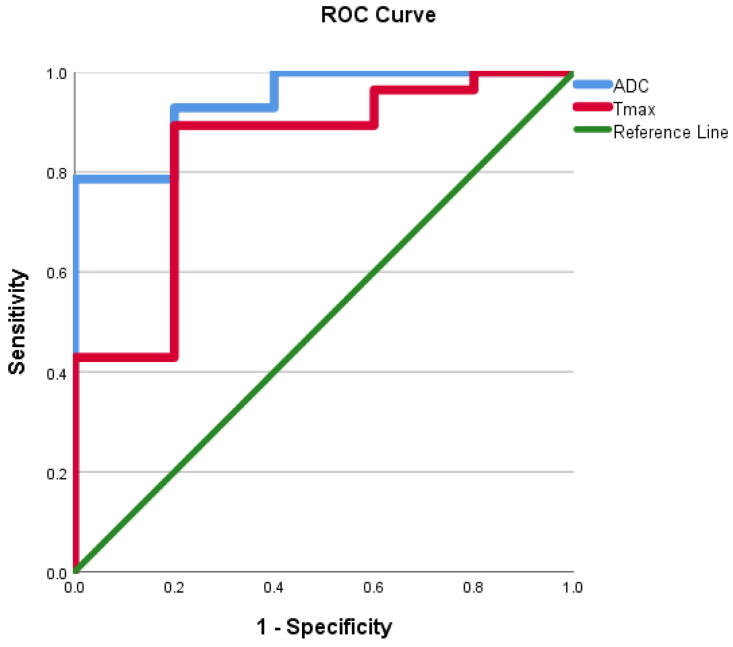
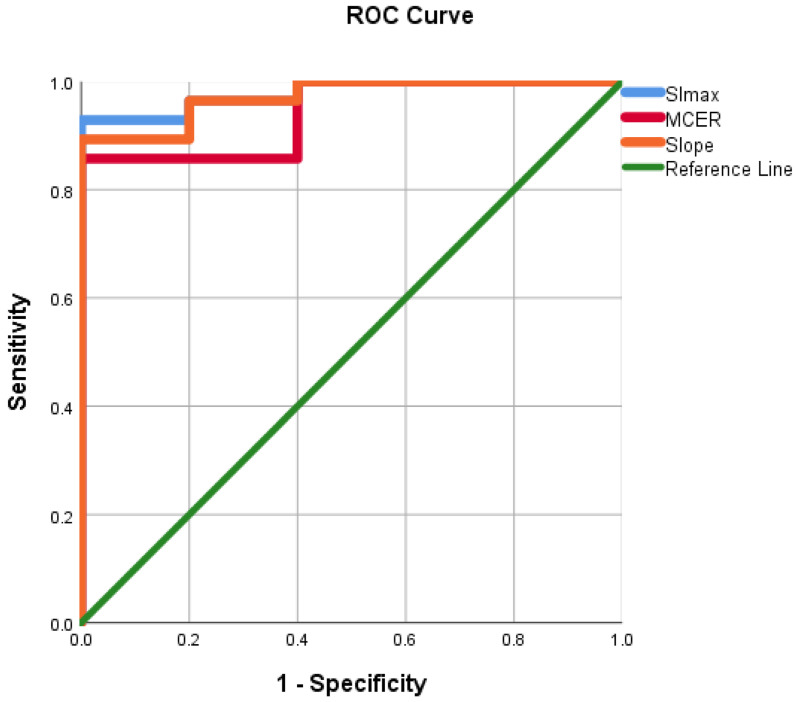
Purpose: Distinguishing between high-grade and low-grade meningiomas might be difficult but has high clinical value in deciding precise treatment and prognostic factors. Magnetic resonance imaging (MRI) using apparent diffusion coefficient (ADC) values and dynamic contrast enhancement (DCE) may have a significant role in capturing such complexities. Methods: Data from our hospital database on meningioma patients from January 2020 to December 2021 were obtained. The MRI results of all patients were evaluated for mean ADC value and DCE parameters, including time-signal intensity curves (TIC), maximum signal intensity (SImax), time to maximum signal intensity (Tmax), maximum contrast enhancement ratio (MCER), and slope. Results: In this retrospective analysis, 33 individuals were included. Twenty-eight (84.8%) patients were pathologically diagnosed with low-grade meningioma and five (15.2%) patients with high-grade meningioma. There is a crossover between high- and low-grade meningiomas in conventional MRI. Tumor size, location, shape, necrotic/cystic changes, peritumoral edema, and enhancement patterns did not differ substantially between groups (p = 0.39, 0.23, 0.28, 0.57, 0.56, and 0.33, respectively). The mean ADC and Tmax values of high-grade meningiomas were substantially lower than those of low-grade meningiomas (p = 0.002 and 0.02, respectively). An optimal cut-off of 0.87 × 10⁻³ mm2s-1 for the mean ADC value (area under the curve [AUC] = 0.94, sensitivity = 80%, specificity = 92.8%) and 42 s for Tmax (AUC = 0.84, sensitivity = 80%, specificity = 89.3%) was suggested. High-grade meningiomas had significantly higher TIC, SImax, MCER, and slope than low-grade meningiomas (p = 0.004, < 0.001, 0.01, and 0.001, respectively). Type IV TIC had a sensitivity of 80% and specificity of 89.3% in distinguishing high-grade meningiomas from low-grade meningiomas. Optimal cut-offs of 940.2 for SImax (AUC = 0.98, sensitivity = 80%, specificity = 96.4%), 245% for MCER (AUC = 0.94, sensitivity = 80%, specificity = 85.7%), and 5% per second for slope (AUC = 0.97, sensitivity = 80%, specificity = 96.4%) were estimated. Conclusion: The ADC value and DCE-MRI parameters (TIC, SImax, Tmax, MCER, and slope) are potential predictors for separating high-grade from low-grade meningiomas.

Keywords: ADC value; DCE-MRI; Grading meningioma.


Conflict of interest statement

Competing Interests: The authors have declared that no competing interest exists.

Figures

Figure 1
Figure 1
Contrast-enhanced T1-weighted imaging, diffusion weighted imaging, and dynamic contrast enhancement magnetic resonance imaging in a 45-year-old woman with histopathologically confirmed World Health Organization grade I transitional meningioma. The mean apparent diffusion coefficient value was 0.925 x10⁻³mm2s-1. The time-signal intensity curve showed rapid initial enhancement followed by a plateau phase (Type III).
Figure 2
Figure 2
Contrast-enhanced T1-weighted imaging, diffusion weighted imaging, and dynamic contrast enhancement magnetic resonance imaging in a 49-year-old man with histopathologically confirmed World Health Organization grade II atypical meningioma. The mean apparent diffusion coefficient value was 0.871 x10⁻³mm2s-1. The time-signal intensity curve showed rapid initial enhancement followed by the washout phase (Type IV).
Figure 3
Figure 3
Classifications of time-signal intensity curves. Type I shows no enhancement. Type II shows gradual enhancement. Type III shows a rapid early phase enhancement followed by plateau enhancement. Type IV has a rapid early phase followed by washout enhancement. Type V rapidly rises to a slow enhancement. SI, signal intensity; T, time.
Figure 4
Figure 4
Temporal change in the signal intensity against time in the time-signal intensity curve. SI, signal intensity; T, time.
Figure 5
Figure 5
Boxplot comparing apparent diffusion coefficient (ADC) values between World Health Organization (WHO) grade I and grade II/III meningiomas. The upper and lower hinges of the boxes delineate the 75th and 25th percentiles, respectively. The median of apiece distribution is denoted by the line. Whiskers represent the data range. The ADC value was significantly lower in WHO grade II/III meningiomas. P = 0.002, calculated by independent-sample t-test.
Figure 6
Figure 6
Scatterplot of time to maximum signal intensity (Tmax) versus maximum signal intensity (SImax) between World Health Organization grade I and grade II/III meningiomas. Grade I (green diamonds) and grade II/III (pink rounds) meningiomas are better separated in the SImax than in Tmax.
Figure 7
Figure 7
Boxplot comparing the maximum signal intensity (SImax) and maximum contrast enhancement ratio (MCER) between World Health Organization (WHO) grade I and grade II/III meningiomas. The SImax and MCER were higher in WHO grade II/III meningiomas. P = 0.000 and P = 0.019, respectively, calculated by the independent-sample t-test.
Figure 8
Figure 8
Boxplot comparing slope between World Health Organization (WHO) grade I and grade II/III meningiomas. The median slope was higher in WHO grade II/III meningiomas. P = 0.001, calculated by the Mann-Whitney u test.
Figure 9
Figure 9
Scatterplot of the maximum contrast enhancement ratio (MCER) versus slope between World Health Organization grade I and grade II/III meningiomas. Grade I (purple rounds) and grade II/III (orange rectangles) meningiomas are both well separated in the MCER and slope.
Figure 10
Figure 10
Receiver operating characteristic curve for use of the apparent diffusion coefficient value and time to maximum signal intensity in differentiating World Health Organization (WHO) grade II/III meningiomas from WHO grade I meningiomas. ADC, apparent diffusion coefficient; Tmax, time to maximum signal intensity.
Figure 11
Figure 11
Receiver operating characteristic curve for use of maximum signal intensity, maximum contrast enhancement ratio, and slope in differentiating World Health Organization (WHO) grade II/III meningiomas from WHO grade I meningiomas. SImax, maximum signal intensity; MCER, maximum contrast enhancement ratio.

Similar articles

Cited by

References

    1. Saraf S, McCarthy BJ, Villano JL. Update on meningiomas. Oncologist. 2011;16:1604–13. doi: 10.1634/theoncologist.2011-0193. - PMC - PubMed
    1. Chidambaram S, Pannullo SC, Roytman M. et al. Dynamic contrast-enhanced magnetic resonance imaging perfusion characteristics in meningiomas treated with resection and adjuvant radiosurgery. Neurosurg Focus. 2019;46(6):E10. doi: 10.3171/2019.3.FOCUS1954. - PubMed
    1. Bulakbasi N, Guvenc I, Onguru O, Erdogan E, Tayfun C, Ucoz T. The added value of the apparent diffusion coefficient calculation to magnetic resonance imaging in the differentiation and grading of malignant brain tumors. J Comput Assist Tomogr. 2004;28(6):735–46. doi: 10.1097/00004728-200411000-00003. - PubMed
    1. Surov A, Gottschling S, Mawrin C. et al. Diffusion-Weighted Imaging in Meningioma: Prediction of Tumor Grade and Association with Histopathological Parameters. Transl Oncol. 2015;8(6):517–23. doi: 10.1016/j.tranon.2015.11.012. - PMC - PubMed
    1. Zakhari N, Torres C, Castillo M, Nguyen TB. Uncommon Cranial Meningioma: Key Imaging Features on Conventional and Advanced Imaging. Clin Neuroradiol. 2017;27(2):135–144. doi: 10.1007/s00062-017-0583-y. - PubMed