. 2022 Aug 22;10(33):10760-10767.
doi: 10.1021/acssuschemeng.2c03657. Epub 2022 Aug 11.

Light-Driven [FeFe] Hydrogenase Based H2 Production in E. coli: A Model Reaction for Exploring E. coli Based Semiartificial Photosynthetic Systems

Affiliations

Light-Driven [FeFe] Hydrogenase Based H2 Production in E. coli: A Model Reaction for Exploring E. coli Based Semiartificial Photosynthetic Systems

Marco Lorenzi et al. ACS Sustain Chem Eng. .

Abstract

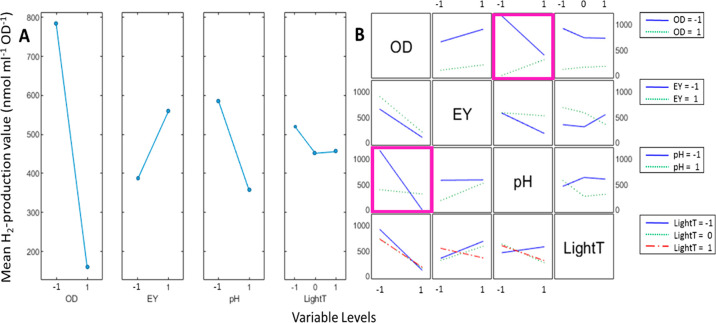
Biohybrid technologies like semiartificial photosynthesis are attracting increased attention, as they enable the combination of highly efficient synthetic light-harvesters with the self-healing and outstanding performance of biocatalysis. However, such systems are intrinsically complex, with multiple interacting components. Herein, we explore a whole-cell photocatalytic system for hydrogen (H2) gas production as a model system for semiartificial photosynthesis. The employed whole-cell photocatalytic system is based on Escherichia coli cells heterologously expressing a highly efficient, but oxygen-sensitive, [FeFe] hydrogenase. The system is driven by the organic photosensitizer eosin Y under broad-spectrum white light illumination. The direct involvement of the [FeFe] hydrogenase in the catalytic reaction is verified spectroscopically. We also observe that E. coli provides protection against O2 damage, underscoring the suitability of this host organism for oxygen-sensitive enzymes in the development of (photo) catalytic biohybrid systems. Moreover, the study shows how factorial experimental design combined with analysis of variance (ANOVA) can be employed to identify relevant variables, as well as their interconnectivity, on both overall catalytic performance and O2 tolerance.


Conflict of interest statement

The authors declare no competing financial interest.

Figures

Figure 1
Figure 1
Graphical representation of the whole-cell photocatalytic system. Upon photoexcitation, eosin Y facilitates the electron transfer between TEOA and HydA1, which ultimately produces H2 gas. (inset) Fluorescence microscopy picture of an eosin Y stained E. coli culture. The picture shows a single focus plane. Additional fluorescence microscopy pictures are available in the Supporting Information (Figure S1).
Figure 2
Figure 2
Assembly of the H-cluster and its photoreduction verified by EPR and ATR-FTIR spectroscopy. (A) EPR spectra recorded on CrHydA1-containing cell suspensions following light or dark incubation in the presence of eosin Y (100 μM) and TEOA (100 mM). Samples were collected after either 3 or 24 h of illumination (red traces) or dark incubation (black traces). In all samples, the only distinct H-cluster derived EPR signal is attributable to an Hox state (gxyz = 2.101 2.040 1.998, indicated with horizontal bar), with no signs of degradation or inhibition after 24 h. Upon illumination, samples show a less intense signal, compatible with the formation of the EPR-silent state HredH+. Prominent contributions from the whole-cell background are indicated with asterisks. EPR experimental conditions: T = 10 K, P = 1 mW, ν = 9.28 GHz. (B, top) Difference ATR-FTIR spectra of a rehydrated film of E. coli cells containing CrHydA1, eosin Y, and TEOA recorded before and after in situ illumination. The difference spectrum (data gray, fit black) shows the disappearance of the oxidized state (Hox, marker bands at 1964 and 1940 cm–1) and the simultaneous appearance of bands attributable to reduced H-cluster states of CrHydA1 (HredH+ and HsredH+, marker bands at 1890 and 1881 cm–1, respectively), verifying photoreduction inside the E. coli cells. Spectra prior to baseline correction are shown in Figure S4. (B, bottom) Redox state population monitored over time, via the area of the marker bands. During the illumination periods (yellow boxes), reduced states accumulate.
Figure 3
Figure 3
Photocatalytic H2 production from samples representing the different combinations of variables in the oxygen-free set. Cumulative H2 production is expressed as nmol ml–1 OD600–1. For each sample, data is shown for H2 produced after 2 h (yellow bars), 5 h (orange bars), 9 h (red bars), and 24 h (blue bars) of illumination. The Sample Number (1–32) refers to a specific combination of variables as defined in the bottom table: +1 (green); 0 (white); −1 (pink). See Tables 1 and S1 for additional details.
Figure 4
Figure 4
Main effects and interactions plot for the 5 h time point on the oxygen-free set. (A) The main effects plot visualizes the magnitude and the direction of the effect of varying the level of the single variables on the mean H2 production. (B) The interaction plot shows the effect of a single variable (columns, levels indicated on the x-axes) in relation to the level of another distinct variable (rows, levels represented with colored lines as indicated in the legends). See Table 1 for the definition of the variables. Selected boxes in panel B are color coded (for details, see the main text), and trend lines are added between data points as a visual guide.
Figure 5
Figure 5
Main effects and interactions plot for the 24 h time point on the oxygen-free set. (A) The main effects plot visualizes the magnitude and the direction of the effect of varying the level of the single variables on the mean H2 production. (B) The interaction plot shows the effect of a single variable (columns, levels indicated on the x-axes) in relation to the level of another distinct variable (rows, levels represented with colored lines as indicated in the legends). See Table 1 for the definition of the variables. Selected boxes in panel B are color coded (for details, see the main text), and trend lines are added between data points as a visual guide.

Similar articles

Cited by

References

    1. Lubitz W.; Ogata H.; Rudiger O.; Reijerse E. Hydrogenases. Chem. Rev. 2014, 114 (8), 4081–148. 10.1021/cr4005814. - DOI - PubMed
    1. Lorenzi M.; Berggren G.. 8.28 - [FeFe] Hydrogenases and Their Functional Models. In Comprehensive Coordination Chemistry III, Constable E. C., Parkin G., Que L. Jr., Eds.; Elsevier: Oxford, 2021; pp 731–756.
    1. Peters J. W.; Lanzilotta W. N.; Lemon B. J.; Seefeldt L. C. X-ray Crystal Structure of the Fe-Only Hydrogenase (CpI) from Clostridium pasteurianum to 1.8 Angstrom Resolution. Science 1998, 282 (5395), 1853–1858. 10.1126/science.282.5395.1853. - DOI - PubMed
    1. Silakov A.; Wenk B.; Reijerse E.; Lubitz W. 14N HYSCORE investigation of the H-cluster of [FeFe] hydrogenase: evidence for a nitrogen in the dithiol bridge. Phys. Chem. Chem. Phys. 2009, 11 (31), 6592–6599. 10.1039/b905841a. - DOI - PubMed
    1. Berggren G.; Adamska A.; Lambertz C.; Simmons T. R.; Esselborn J.; Atta M.; Gambarelli S.; Mouesca J. M.; Reijerse E.; Lubitz W.; Happe T.; Artero V.; Fontecave M. Biomimetic assembly and activation of [FeFe]-hydrogenases. Nature 2013, 499 (7456), 66–69. 10.1038/nature12239. - DOI - PMC - PubMed