. 2022 Aug 10:16:930326.
doi: 10.3389/fnint.2022.930326. eCollection 2022.

Reproducing a decision-making network in a virtual visual discrimination task

Affiliations

Reproducing a decision-making network in a virtual visual discrimination task

Alessandra Trapani et al. Front Integr Neurosci. .

Abstract

We reproduced a decision-making network model using the neural simulator software neural simulation tool (NEST), and we embedded the spiking neural network in a virtual robotic agent performing a simulated behavioral task. The present work builds upon the concept of replicability in neuroscience, preserving most of the computational properties in the initial model although employing a different software tool. The proposed implementation successfully obtains equivalent results from the original study, reproducing the salient features of the neural processes underlying a binary decision. Furthermore, the resulting network is able to control a robot performing an in silico visual discrimination task, the implementation of which is openly available on the EBRAINS infrastructure through the neuro robotics platform (NRP).

Keywords: NEST; decision-making; network model; neurorobot; reproducibility; working memory.


Conflict of interest statement

The authors declare that the research was conducted in the absence of any commercial or financial relationships that could be construed as a potential conflict of interest.

Figures
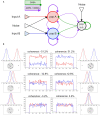
Figure 1
Figure 1
Network architecture and stimulus model: (A) Schematic representation of the model proposed by Brunel et al. (2001). The two neural populations that contain excitatory pyramidal cells are represented in red, pop A responsive to stimulus A, and blue, pop B responsive to stimulus B. The gray circle represents the interneurons, i.e., the inhibitory population. All inputs, stimuli and noise, are Poisson generator represented by the triangles in the picture. A bigger circle represents numerous populations, while thicker connectors represent higher connection weights. (B) Stimulus model: here six levels of coherence are reported. How the inputs vary in time (central plots), the Gaussian distributions from which the values are sampled every 25 ms (upper lateral plots), and the correspondent representation of the physical visual stimulus (bottom lateral images).
Figure 2
Figure 2
Neurorobotics platforms (NRP) experimental setting: In the proposed NRP implementation of a visual discrimination task, an iCub humanoid robot (left) is placed in front of a screen displaying fifty random moving green dots (center), occupying most of the robot's field of view (right). During each trial, the robotic subject is required to fixate the screen and report the perceived coherent motion of the point cloud with a saccadic eye movement, as in the corresponding primate experiments reported in the literature (Britten et al., ; Shadlen and Newsome, ; Roitman and Shadlen, 2002).
Figure 3
Figure 3
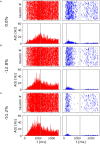
Network activity at different coherence levels: Population A response is reported on the left panels, population B response on the right. In (A–C), top panels report the raster plot for the spiking activity for all neurons, while the bottom plots report frequency rates of the two populations. Gray vertical lines indicate the start and end of the stimulus delivery. (A) Simulation output for a trial where 0.0% coherence level was provided and population A wins. (B) Trial with 12.8% of stimulus coherence. (C) Trial with 51.2% of stimulus coherence.
Figure 4
Figure 4
Decision space: Decision space representation of the three trials report in Figure 3. Darker lines represent a higher level of coherence: light red, 0.0%; red, 12.8%; and dark red, 51.2%.
Figure 5
Figure 5
Effects of strong recurrent connection and NMDA slow reverberation: (A) Simulation output for decreased recurrent weights. (B) Simulation output without NMDA slow dynamics. We reported in blue population B activity in the altered simulations, light blue the standard simulation output. For population A we reported in red the activity in altered simulation and light red the standard response.
Figure 6
Figure 6
“Coin toss” decision: Here represented two trials where 0.0% coherence level is given to the network. In the left panels, population A wins over B, on the right, population B wins over A. (A) Raster plots for all excitatory neurons in the network color coded with respect to the population they belong to: in red Population A, in blue population B. (B) Firing rates across time for the two neuronal groups. (C) Input stimuli time course. In blue the stimulus is given to population B, in red the stimulus is given to population A. (D) The time integral of the two inputs.
Figure 7
Figure 7
Network performance and reaction time: (A) Neurometric function reported as the percentage of the correct choice. In blue for population B, in red for population A and in black the weibull fit as reported by Wang (2002). (B) Response of population B (median filter applied to the original trace) in trials with 0.0% (left) and 51.2% (right) stimulus coherence. Green line represents the mean along trials. (C) Dark purple plot is the decision time histogram for trials where the network was stimulated with 51.2% coherence. Light purple histogram, for trials with 0.0% coherence level. (D) Evolution of population B response for four different coherence levels. Black curves (correct trials): population B wins over A and the stimulus is in the preferred direction for population B. Gray curves (error trials): population B wins but the stimulus is the non-preferred direction for population B. Orange curves (correct trials) population B loses over A, and a non-preferred stimulus for B is delivered. Light orange (error trials) population B loses over A, even if the stimulus was in the preferred direction for B.
Figure 8
Figure 8
Dependency on stimulus duration: Top panel: neurometric function for different stimulus duration compared to the weibull fit as reported by Wang (2002) (black curve). Bottom panels: population A and population B firing rate activity in three different trials, but same coherence level (-12.8%). From the left: stimulus delivered for 500 ms, stimulus delivered for 700 ms, stimulus delivered for 900 ms.
Figure 9
Figure 9
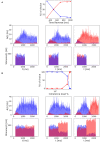
Decision reversal: (A) Time for stimulus reversal. Top panel: Percentage of choice for population A and population B with a –6.4% coherence stimulus in input, that is reverted at a different time (300, 500, 700, 900, and 1,000 ms). The reverted stimulus coherence is 6.4%. Central panels: population A and population B firing rate activity in three different trials where the stimulus is reverted, after 300 ms (left), 700 ms (central), and 900 ms (right). Bottom panels: Corresponding input rates over time. (B) Intensity of stimulus reversal. Top panel: Percentage of choice for population A and population B with a 12.8% coherence stimulus in input that is reverted after 1,000 ms with reverse stimuli at different intensity (–3.2, –6.4, –12.8, –25.6, –51.2, –70, and –80%). Central panels: population A and population B firing rate activity in three different trials where the reverted stimulus intensity is –12.8% (left), –51.2% (central), and –80% (right). Bottom panels: Corresponding input rates over time.
Figure 10
Figure 10
Virtual task execution: Here, reported two screenshots of the NRP interface during the first 20 s of a virtual experiment execution. The iCub robot successfully performs a saccadic movement from its fixiation point (top) to the right (bottom), when shown random moving dots with a coherence value of 51,2%. The 3D renderings show both a frontal view of the iCub with its left camera frustum and the subject's field of view in which a red dot indicates the gaze target; the raster plot on the right is updated in real-time and shows the activity of the brain model embedded in the robot, marked with the corresponding timestamps. Note that, when using the NRP, the raster plot slides from right to left, thus the instantaneous value is only depicted on the rightmost edge and only past activity values are shown on screen. For the sake of clarity, the raster plots depicted in the figure only show a subset of excitatory neurons, and colored boxes have been overlaid to mark rows belonging to different populations (in red those of population A and in blue those of population B); it can be seen that starting from a balanced state (top), the network engages in a winner-take-all competition upon stimulus onset (bottom), after the 14 s mark.
Figure 11
Figure 11
Robotic subject's reaction times: Whisker plot showing the reaction time (i.e., the time needed by the iCub to rotate its cameras by an angle greater than 0,08 rad after the stimulus onset) during 10 different trials and with different stimulus coherence values. The red dots on the upper right corner represent failed trials, in which either the reaction time exceeded 2 s or the saccadic movement didn't surpass the threshold (hence, no decision was taken).

References

    1. Bradski G. (2000). The OpenCV Library. San Francisco, CA: Dr. Dobb's Journal of Software Tools.
    1. Brette R., Gerstner W. (2005). Adaptive exponential integrate-and-fire model as an effective description of neuronal activity. J. Neurophysiol. 94, 3637–3642. 10.1152/jn.00686.2005 - DOI - PubMed
    1. Brette R., Rudolph M., Carnevale T., Hines M., Beeman D., Bower J. M., et al. . (2007). Simulation of networks of spiking neurons: a review of tools and strategies. J. Comput. Neurosci. 23, 349–398. 10.1007/s10827-007-0038-6 - DOI - PMC - PubMed
    1. Britten K. H., Newsome W. T., Shadlen M. N., Celebrini S., Movshon J. A. (1996). A relationship between behavioral choice and the visual responses of neurons in macaque mt. Vis. Neurosci. 13, 87–100. 10.1017/S095252380000715X - DOI - PubMed
    1. Britten K. H., Shadlen M. N., Newsome W. T., Movshon J. A. (1992). The analysis of visual motion: a comparison of neuronal and psychophysical performance. J. Neuroscie. 12, 4745–4765. 10.1523/JNEUROSCI.12-12-04745.1992 - DOI - PMC - PubMed