. 2022 Aug 23;7(1):ysac012.
doi: 10.1093/synbio/ysac012. eCollection 2022.

A toolkit for enhanced reproducibility of RNASeq analysis for synthetic biologists

Affiliations

A toolkit for enhanced reproducibility of RNASeq analysis for synthetic biologists

Benjamin J Garcia et al. Synth Biol (Oxf). .

Abstract

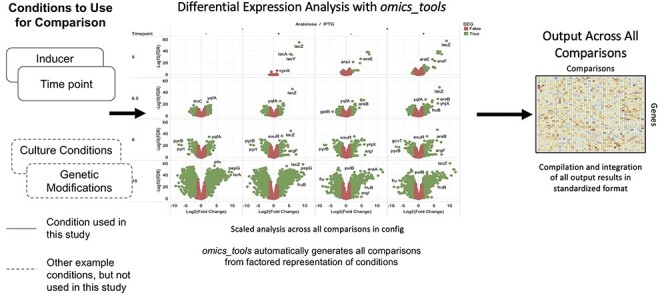
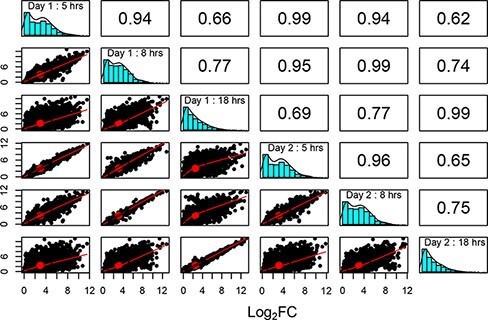
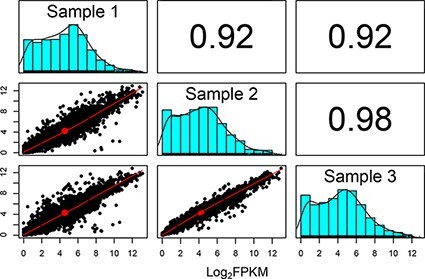
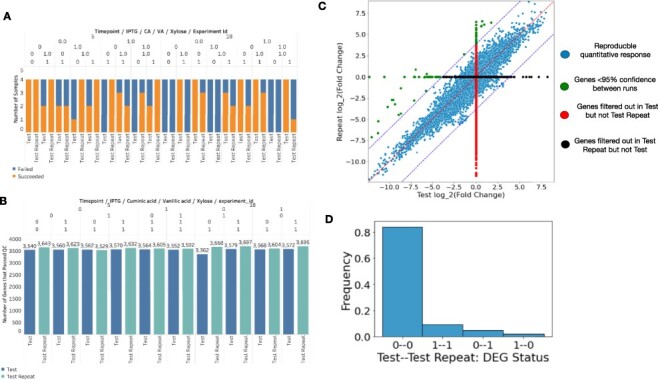
Sequencing technologies, in particular RNASeq, have become critical tools in the design, build, test and learn cycle of synthetic biology. They provide a better understanding of synthetic designs, and they help identify ways to improve and select designs. While these data are beneficial to design, their collection and analysis is a complex, multistep process that has implications on both discovery and reproducibility of experiments. Additionally, tool parameters, experimental metadata, normalization of data and standardization of file formats present challenges that are computationally intensive. This calls for high-throughput pipelines expressly designed to handle the combinatorial and longitudinal nature of synthetic biology. In this paper, we present a pipeline to maximize the analytical reproducibility of RNASeq for synthetic biologists. We also explore the impact of reproducibility on the validation of machine learning models. We present the design of a pipeline that combines traditional RNASeq data processing tools with structured metadata tracking to allow for the exploration of the combinatorial design in a high-throughput and reproducible manner. We then demonstrate utility via two different experiments: a control comparison experiment and a machine learning model experiment. The first experiment compares datasets collected from identical biological controls across multiple days for two different organisms. It shows that a reproducible experimental protocol for one organism does not guarantee reproducibility in another. The second experiment quantifies the differences in experimental runs from multiple perspectives. It shows that the lack of reproducibility from these different perspectives can place an upper bound on the validation of machine learning models trained on RNASeq data. Graphical Abstract.

Keywords: automation; machine learning; standardization; transcriptomics.


Figures

Figure 1.
Figure 1.
Diagram of the RNASeq processing pipeline. (A) The ingester monitors a metadata file uploaded to the data catalog to see if the experiment includes RNASeq data to trigger the processing pipeline. (B) The preprocessing actor triggers and stores the job ID and version of the preprocessing app to the data catalog. (C) The auditing actor receives notifications from applications to validate the outputs and triggers the next actor. The auditing actor will resubmit applications up to three times to handle stochastic failures. (D) The alignment actor queries the data catalog to determine the reference genome that is used for each preprocessed sample and triggers the alignment application. (E) The post-processing application annotates the alignments and aggregates samples into counts (raw, FPKM and TPM) dataframes. (F) The QC and metadata actor use metadata stored in the data catalog and information from the logs/outputs of each job to add experimentally relevant metadata and QC flags to the counts dataframes.
Figure 2.
Figure 2.
Omics_tools facilitates the analysis of combinatorial design RNASeq by integrating metadata (inducers, growth conditions, genetic manipulations, etc.) to automatically calculate differential expression with edgeR across all conditions of interest. The tool kit allows for parallel processing of thousands of samples and comparisons in a high-throughput manner and utilizes a standardized schema to help facilitate reproducibility in analytical analysis.
Figure 3.
Figure 3.
Pearson’s correlations (upper right numbers) between log2 FPKM of E. coli samples at each of the measured timepoints on both days. Samples taken on different days, at the same hour, are much more similar (average 0.99) than at different hours. The 5 and 18 h have high correlations (average 0.95), suggesting that they are in similar growth states, whereas the 5 and 18 h have the least similar expression profiles (average 0.64) due to their differences in growth states. Scatterplots are gene–gene log2 FPKM comparisons, with a red linear regression line. Histogram plots are for frequencies of gene FPKMs.
Figure 4.
Figure 4.
Pearson’s correlations (upper right numbers) between log2 FPKM of 5 h timepoints for B. subtilis on each of the three different days. Samples 2 and 3 have much more similar patterns compared to 1–2 and 1–3. Additionally, these two comparisons have a lower correlation than the 5–8 h E. coli comparisons, suggesting greater variability in the growth/biological conditions for B. subtilis. Scatterplots are gene–gene log2 FPKM comparisons, with a red linear regression line. Histogram plots are for frequencies of gene FPKMs.
Figure 5.
Figure 5.
Comparison of experimental conditions across test and test repeat experimental runs. The 0/1 indicates the absence/presence of inducers for Panels A/B and differentially expressed status (0 not DEG and 1 is DEG for D). Each comparison will have a different impact on the experiment’s ability to validate a machine learning model trained on single inducers (conditions not shown here). (A) Different sample dropouts for the two runs mean that if both experiments were not run, some predictions would not be validatable. (B) Different genes being filtered will impact the set of genes from a condition that can be validated. (C) Genes can have quantitatively different responses, which can further add complications to validation and the gene dropouts (horizontal black and vertical red lines) across the two experimental runs means different genes will be validated. (D) While the set of DEGs that are different between days are in the minority, these discrepancies can have mechanistic consequences on the inferences made.

Similar articles

Cited by

References

    1. Abbas-Aghababazadeh F., Li Q. and Fridley B.L. (2018) Comparison of normalization approaches for gene expression studies completed with high-throughput sequencing. PLoS One, 13, e0206312.doi: 10.1371/journal.pone.0206312. - DOI - PMC - PubMed
    1. Babraham Bioinformatics – FastQC: A quality control tool for high throughput sequence data . https://www.bioinformatics.babraham.ac.uk/projects/fastqc/ (8 August 2004, date last accessed).
    1. Bolger A.M., Lohse M. and Usadel B. (2014) Trimmomatic: a flexible trimmer for Illumina sequence data. Bioinformatics, 30, 2114–2120.doi: 10.1093/bioinformatics/btu170. - DOI - PMC - PubMed
    1. Picard Toolkit . (2019) Broad Institute, GitHub Repository. https://broadinstitute.github.io/picard/.
    1. Brookes E. and Stubbs J. (2019) GenApp, containers and Abaco: technical paper. In: Proceedings of the Practice and Experience in Advanced Research Computing on Rise of the Machines (Learning). Association for Computing Machinery, New York, NY, USA, pp. 1–8.

LinkOut - more resources