. 2022 Aug 8:9:948909.
doi: 10.3389/fcvm.2022.948909. eCollection 2022.

SGLT1/2 as the potential biomarkers of renal damage under Apoe-/- and chronic stress via the BP neural network model and support vector machine

Affiliations

SGLT1/2 as the potential biomarkers of renal damage under Apoe-/- and chronic stress via the BP neural network model and support vector machine

Gai-Feng Hu et al. Front Cardiovasc Med. .

Abstract

Background: Chronic stress (CS) could produce negative emotions. The molecular mechanism of SGLT1 and SGLT2 in kidney injury caused by chronic stress combined with atherosclerosis remains unclear.

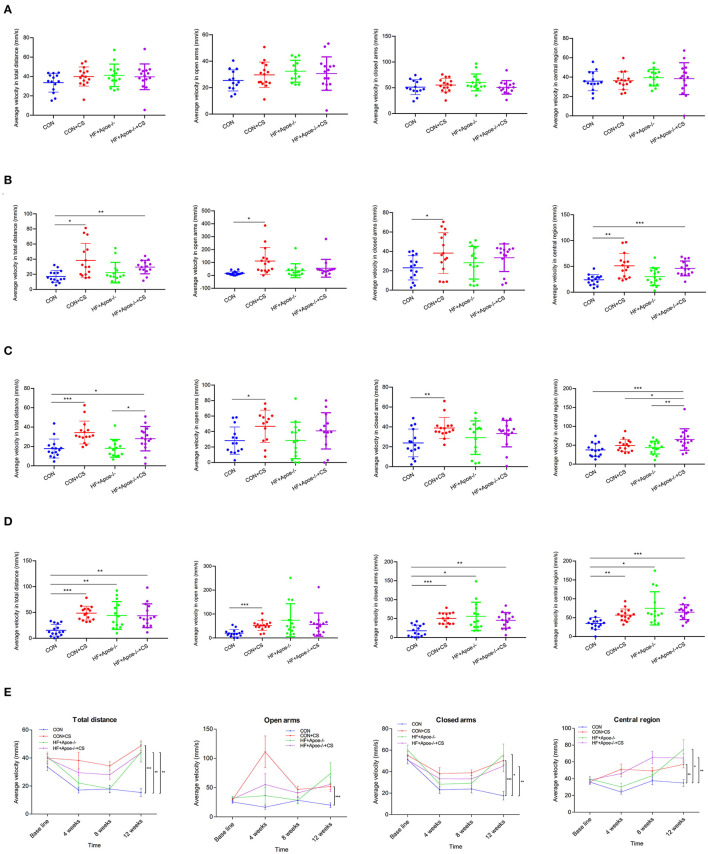
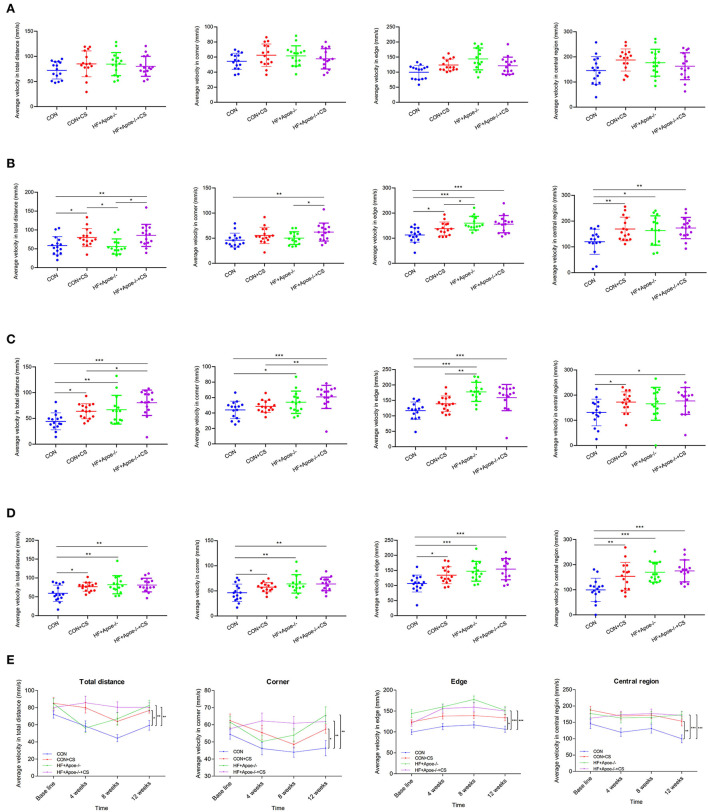
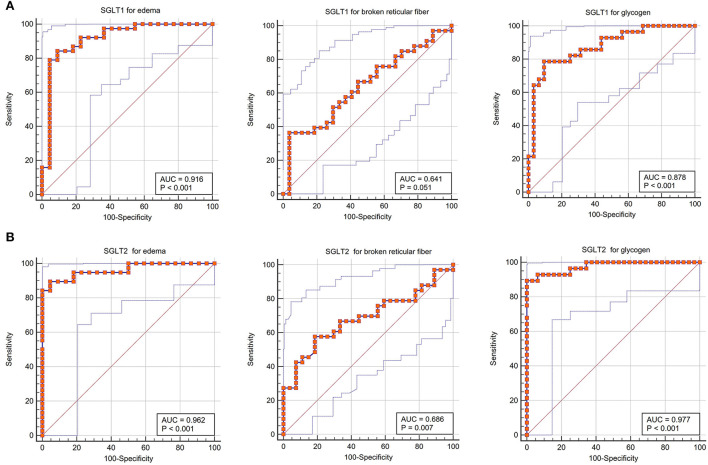
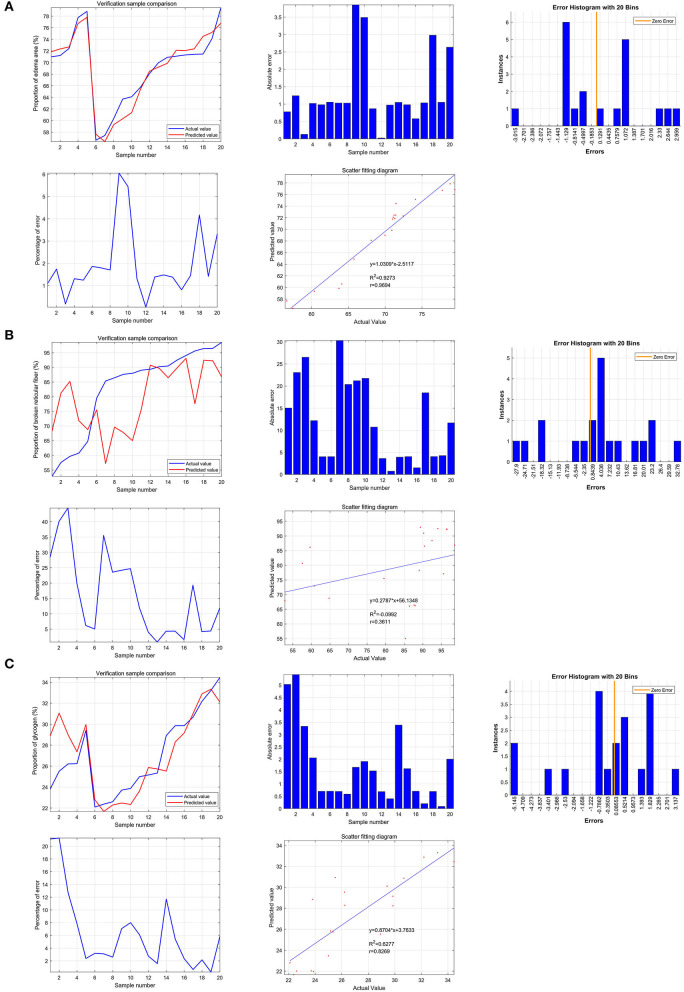
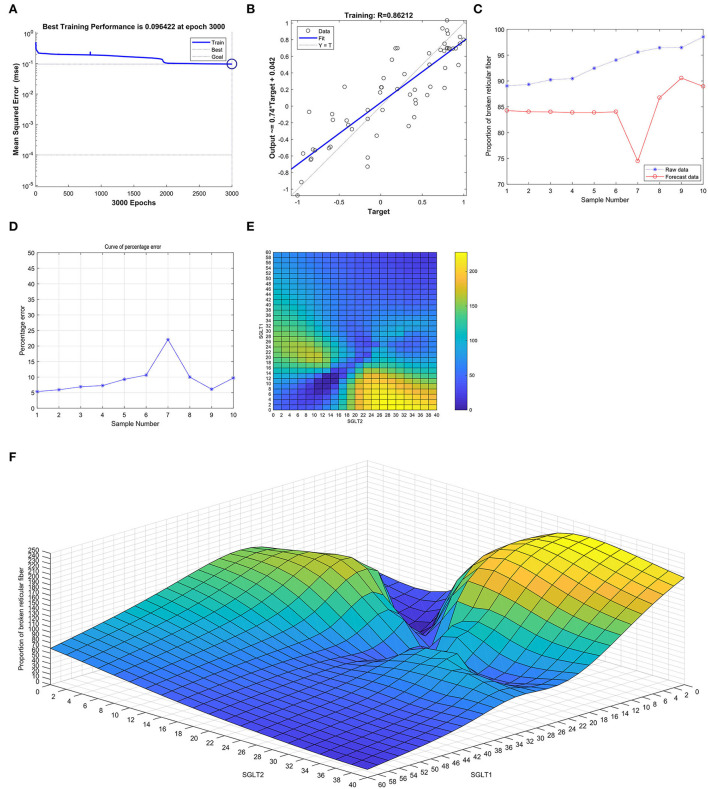
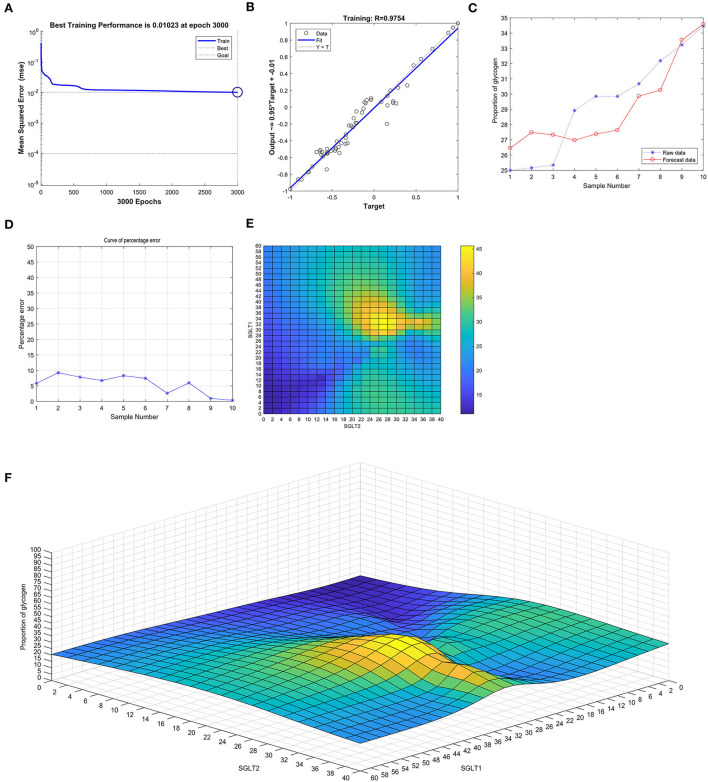
Methods: In total, 60 C57BL/6J mice were randomly divided into four groups, namely, control (CON, n = 15), control diet + chronic stress (CON+CS, n = 15), high-fat diet + Apoe-/- (HF + Apoe-/-, n = 15), and high-fat diet + Apoe-/- + chronic stress (HF+Apoe-/- + CS, n = 15) groups. The elevated plus maze and open field tests were performed to examine the effect of chronic stress. The expression of SGLT1 and SGLT2 in the kidney was detected. The support vector machine (SVM) and back propagation (BP) neural network model were constructed to explore the predictive value of the expression of SGLT1/2 on the renal pathological changes. The receiver operating characteristic (ROC) curve analysis was used.

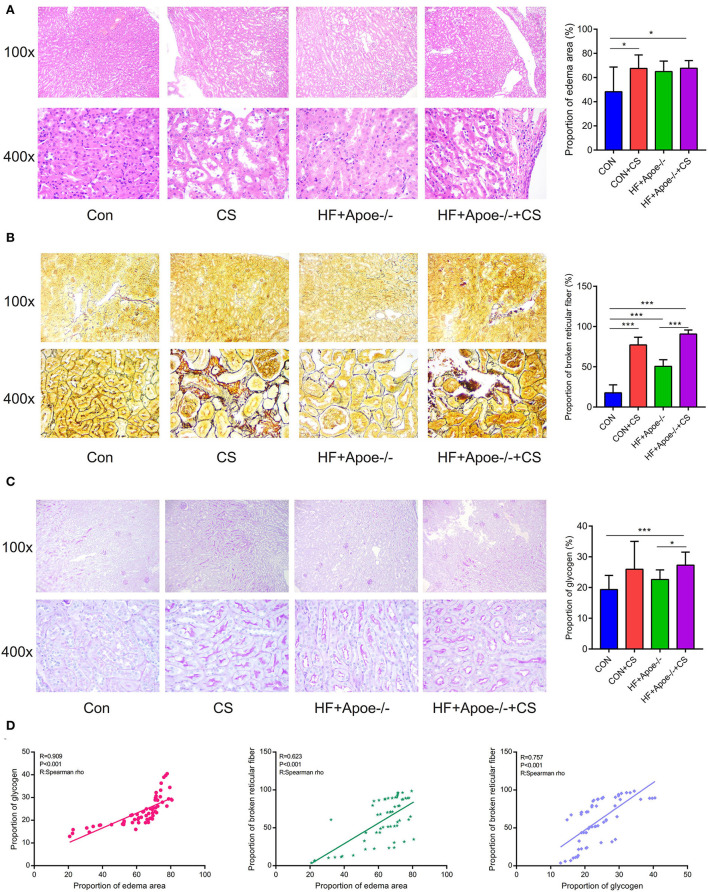
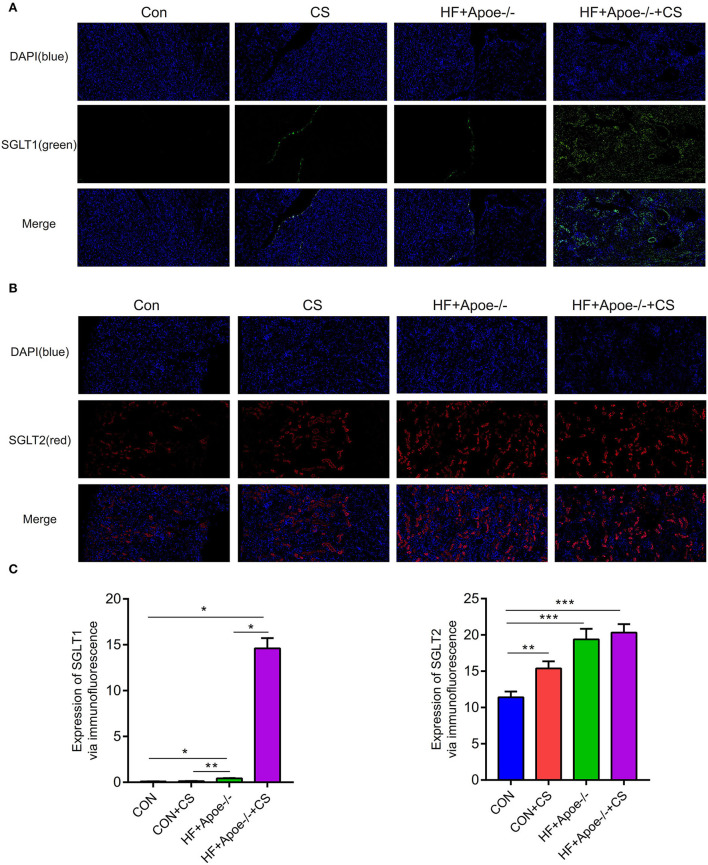
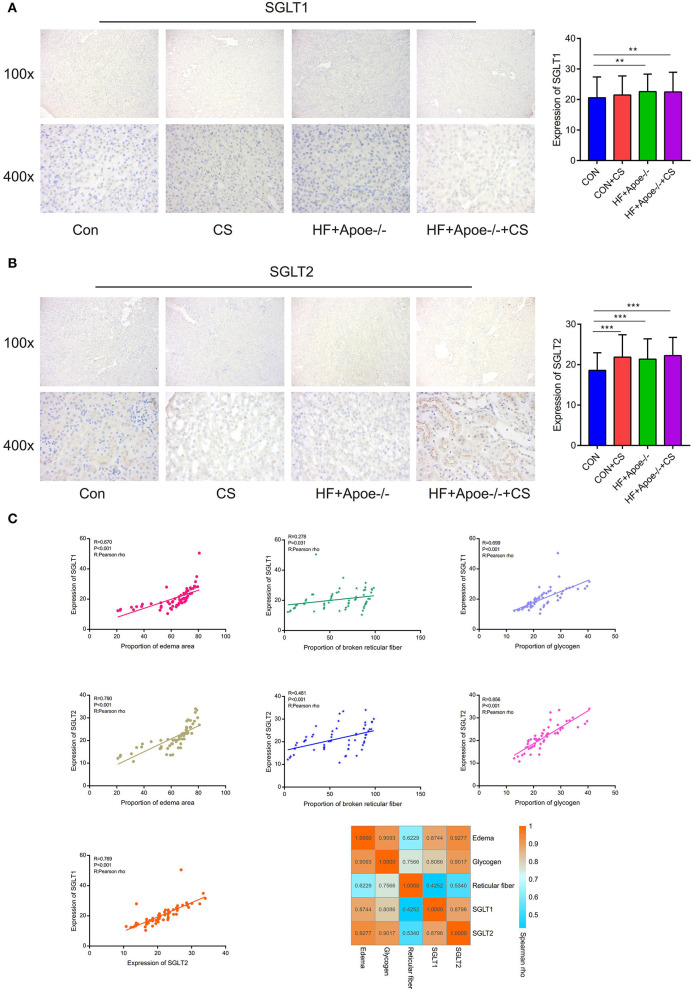
Results: A chronic stress model and atherosclerosis model were constructed successfully. Edema, broken reticular fiber, and increased glycogen in the kidney would be obvious in the HF + Apoe-/- + CS group. Compared with the CON group, the expression of SGLT1/2 in the kidney was upregulated in the HF + Apoe-/- + CS group (P < 0.05). There existed positive correlations among edema, glycogen, reticular fiber, expression of SGLT1/2 in the kidney. There were higher sensitivity and specificity of diagnosis of SGLT1/2 for edema, reticular fiber, and glycogen in the kidney. The result of the SVM and BP neural network model showed better predictive values of SGLT1 and SGLT2 for edema and glycogen in the kidney.

Conclusion: In conclusion, SGLT1/2 might be potential biomarkers of renal damage under Apoe-/- and chronic stress, which provided a potential research direction for future related explorations into this mechanism.

Keywords: SGLT1; SGLT2; atherosclerosis; chronic stress; kidney; support vector machine.


Conflict of interest statement

The authors declare that the research was conducted in the absence of any commercial or financial relationships that could be construed as a potential conflict of interest.

Figures

Figure 1
Figure 1
Extremely excited state in the chronic stress model based on the elevated plus maze. (A) Baseline. (B) Four weeks. (C) Eight weeks. (D) Twelve weeks. (E) Trend of excitation over time is shown in the line chart. *P < 0.05; **P < 0.01; ***P < 0.001.
Figure 2
Figure 2
Verification of the successful construction of a chronic stress model via the open field test. (A) Baseline. (B) Four weeks. (C) Eight weeks. (D) Twelve weeks. (E) Trend of excitation over time is shown in the line chart. *P < 0.05; **P < 0.01; ***P < 0.001.
Figure 3
Figure 3
Pathological observation of the normal artery and atherosclerosis based on HE staining.
Figure 4
Figure 4
Edema, broken reticular fibers, and increased glycogen in the kidney under in the HF + Apoe−/−+CS group. (A) HE staining manifested that there existed edema in the kidney at different degrees in the CS, HF + Apoe−/−, and HF + Apoe−/−+CS groups. (B) In the CS, HF + Apoe−/−, and HF + Apoe−/−+CS groups, the reticular fibers in the kidney were destructed and broken. (C) Compared with the CON group, the proportion of glycogen in the HF + Apoe−/−+CS group was significantly higher than that in the CON group. (D) Strongly positive relationships between the proportion of glycogen, broken reticular fiber, and edema area in the kidney. *P < 0.05; ***P < 0.001.
Figure 5
Figure 5
Upregulated expression of SGLT1 and SGLT2 in the kidney in the HF + Apoe−/−+CS group. (A) In the immunofluorescence assay, SGLT1 stained green. Compared with the CON group, the expression of SGLT1 in the kidney was upregulated in the HF + Apoe−/− and HF+Apoe−/−+CS groups (P < 0.05). In addition, the expression of SGLT1 in the HF + Apoe−/−+CS group was higher than that in the HF + Apoe−/− group. (B) In the immunofluorescence assay, SGLT2 stained red in the kidney. Compared with the CON group, the expression of SGLT2 in the kidney was upregulated in the HF + Apoe−/− and HF + Apoe−/−+CS groups, and the expression of SGLT2 in the kidney was higher in the CON + CS group than in the CON group. (C) Statistical graph of the expression of SGLT1 and SGLT2 in the kidney. *P < 0.05; **P < 0.01; ***P < 0.001.
Figure 6
Figure 6
Verification of the expression of SGLT1 and SGLT2 in the kidney via the immunohistochemical assay. (A) Through the immunohistochemical assay, the expression of SGLT1 in the kidney in the HF + Apoe−/− group and HF + Apoe−/−+CS group was upregulated compared with the CON group. (B) Compared with the CON group, the expression level of SGLT2 in the kidney was higher in the CON + CS, HF + Apoe−/−, and HF + Apoe−/−+CS groups. (C) Positive correlations edema, glycogen, reticular fiber, and expression of SGLT1 and SGLT2 in the kidney. **P < 0.01; ***P < 0.001.
Figure 7
Figure 7
Sensitivity and specificity of diagnosis of SGLT1 and SGLT2 for edema, reticular fibers, and glycogen in the kidney. (A) Receiver operating characteristic curve indicated that the expression level of SGLT1 in our experiment also could predict renal edema [area under the curve (AUC) = 0.916; P < 0.001], broken reticular fibers (AUC = 0.641, P = 0.051), and the glycogen content (AUC = 0.878, P < 0.001) sensitively and specifically. (B) Expression level of SGLT2 in our experiment also could predict renal edema (AUC = 0.962; P < 0.001), broken reticular fibers (AUC = 0.686, P = 0.007), and the glycogen content (AUC = 0.977, P < 0.001) sensitively and specifically.
Figure 8
Figure 8
Predictive value of SGLT1 and SGLT2 for edema, reticular fibers, and glycogen content in the kidney via the support vector machine (SVM). (A) Predictive value of SGLT1 and SGLT2 for the renal edema was 0.9694 (y = 1.0309*x−2.5117), and the mean of error was 1.28%. (B) Predictive value of SGLT1 and SGLT2 for broken reticular fibers was 0.3611 (y = 0.2787*x+56.1348), and the mean of error was 11.62%. (C) Predictive value of SGLT1 and SGLT2 for the glycogen content was 0.8269 (y = 0.8704*x+3.7633), and the mean of error was 1.56%.
Figure 9
Figure 9
Neural network prediction model and high-risk warning range of renal edema based on the expression of SGLT1 and SGLT2. (A) After training the BP neural network of SGLT1 and SGLT2 for renal edema, the best training performance was 0.024349 at epoch 3000. (B) Relativity was 0.94878. (C,D) By verifying the forecast data against the raw value, we found that there were only small differences. (E,F) High-risk warning indicator of renal edema: 16 < SGLT1 < 26 and 8 < SGLT2 < 16.
Figure 10
Figure 10
Neural network prediction model and high-risk warning range of broken reticular fibers in the kidney based on the expression of SGLT1 and SGLT2. (A) After training the BP neural network of SGLT1 and SGLT2 for broken reticular fibers in the kidney, best training performance was 0.096422 at epoch 3,000. (B) Relativity was 0.86212. (C,D) By verifying the forecast data against the raw value, we found that there were large differences. (E,F) High-risk warning indicator of broken reticular fibers in the kidney: 0 < SGLT1 < 16 and 18 < SGLT2 < 40.
Figure 11
Figure 11
Neural network prediction model and high-risk warning range of the glycogen content in the kidney based on the expression of SGLT1 and SGLT2. (A) Best training performance was 0.01023 at epoch 3,000. (B) Relativity was 0.9754. (C,D) Through verifying the forecast data against the raw value, we found that there were only small differences. (E,F) High-risk warning indicator of glycogen content in the kidney: 28 < SGLT1 < 42 and 20 < SGLT2 < 42.

Similar articles

Cited by

References

    1. Pedro-Botet J, Climent E, Benaiges D. Atherosclerosis and inflammation. New Therap. Approach. Med. Clin. (Barc). 2020) 155:256–62. 10.1016/j.medcli.2020.04.024 - DOI - PubMed
    1. Meng LB, Yu ZM, Guo P, Wang QQ, Qi RM, Shan MJ, et al. . Neutrophils and neutrophil-lymphocyte ratio: inflammatory markers associated with intimal-media thickness of atherosclerosis. Thromb Res. (2018) 170:45–52. 10.1016/j.thromres.2018.08.002 - DOI - PubMed
    1. Tuna MA, Rothwell PM. Diagnosis of non-consensus transient ischaemic attacks with focal, negative, and non-progressive symptoms: population-based validation by investigation and prognosis. Lancet. (2021) 397:902–12. 10.1016/S0140-6736(20)31961-9 - DOI - PMC - PubMed
    1. Siegrist J. [Psychosocial stress at work and disease risks: scientific evidence and implications for practice]. Internist. (2021). - PubMed
    1. Bucsek MJ, Qiao G, MacDonald CR, Giridharan T, Evans L, Niedzwecki B, et al. . β-Adrenergic signaling in mice housed at standard temperatures suppresses an effector phenotype in CD8(+) T cells and undermines checkpoint inhibitor therapy. Cancer Res. (2017) 77:5639–51. 10.1158/0008-5472.CAN-17-0546 - DOI - PMC - PubMed