Methylation pattern of caveolin-1 in prostate cancer as potential cfDNA biomarker
- PMID: 36036057
- PMCID: PMC9901895
- DOI: 10.17305/bjbms.2022.7497
Methylation pattern of caveolin-1 in prostate cancer as potential cfDNA biomarker
Abstract
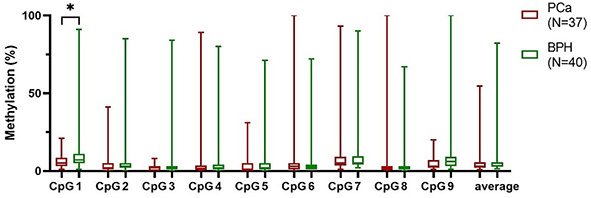
High prevalence and mortality of prostate cancer (PCa) are well known global health issues. Novel biomarkers for better identifying patients with PCa are the subject of extensive research. Prostate specific antigen (PSA) shows low specificity in screening and diagnostics, leading to unnecessary biopsies and health costs. Eighty patients with PCa and benign prostate hyperplasia (BPH) were included in the study. We analyzed CAV1 gene expression and methylation in tissue. CAV1 cfDNA methylation from blood and seminal plasma was accessed as a potential PCa biomarker. Although methylation in blood plasma did not differ between PCa and BPH patients, methylation in seminal plasma showed better PCa biomarker performances than tPSA (AUC 0.63 vs. AUC 0.52). Discrimination of BPH and Gleason grade group 1 PCa patients from patients with higher Gleason grade groups revealed very good performance as well (AUC 0.72). CAV1 methylation is useful biomarker with potential for further seminal plasma cfDNA research, but its diagnostic accuracy should be improved, as well as general knowledge about cfDNA in seminal plasma.
Figures


References
-
- Hiros M, Spahović H, Selimović M, Sadović S. Incidental prostate cancer in patients undergoing radical cystoprostatectomy for bladder cancer. Bosn J Basic Med Sci. 2008;8:147–51. https://doi.org/10.17305/bjbms.2008.2970. - PMC - PubMed
-
- Krušlin B, Škara L, Vodopić T, Vrhovec B, Murgić J, Štimac G, et al. Genetics of prostate carcinoma. Acta Med Acad. 2021;50:71–87. https://doi.org/10.5644/ama2006-124.327. - PubMed
-
- Eggener SE, Berlin A, Vickers AJ, Paner GP, Wolinsky H, Cooperberg MR. Low-grade prostate cancer: time to stop calling it cancer. J Clin Oncol. 2022:1–6. https://doi.org/10.1200/JCO.22.00123. - PubMed
-
- Acar V, Couto Fernandez FL, Buscariolo FF, Novai AA, Pereira RAM, Zuccari DAPD. Immunohistochemical evaluation of PARP and caspase-3 as prognostic markers in prostate carcinomas. Clin Med Res. 2021;19:183–91. https://doi.org/10.3121/cmr.2021.1607. - PMC - PubMed
-
- Chen E, Cario CL, Leong L, Lopez K, Márquez CP, Chu C. Cell-free DNA concentration and fragment size as a biomarker for prostate cancer. Sci Rep. 2021;11:5040. https://doi.org/10.1038/s41598-021-84507-z. - PMC - PubMed
MeSH terms
Substances
LinkOut - more resources
Full Text Sources
Medical
Research Materials
Miscellaneous