. 2022 Aug 29;18(8):e1010411.
doi: 10.1371/journal.pcbi.1010411. eCollection 2022 Aug.

A multi-objective based clustering for inferring BCR clonal lineages from high-throughput B cell repertoire data

Affiliations

A multi-objective based clustering for inferring BCR clonal lineages from high-throughput B cell repertoire data

Nika Abdollahi et al. PLoS Comput Biol. .

Abstract

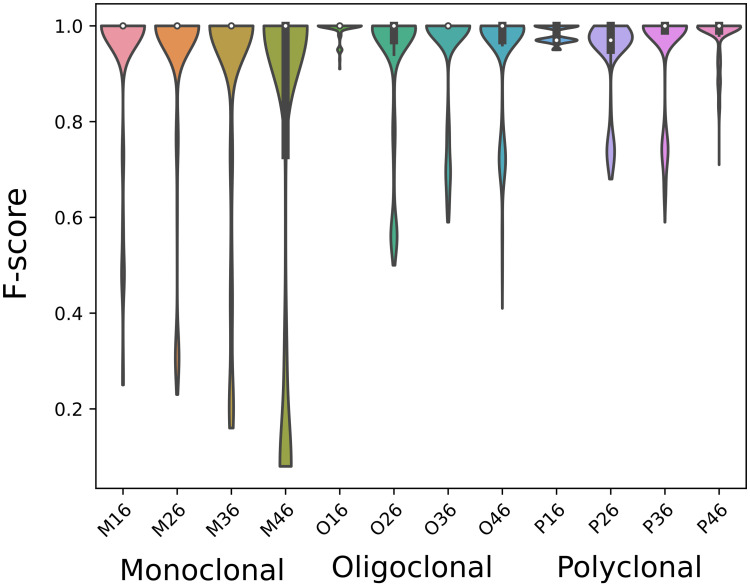
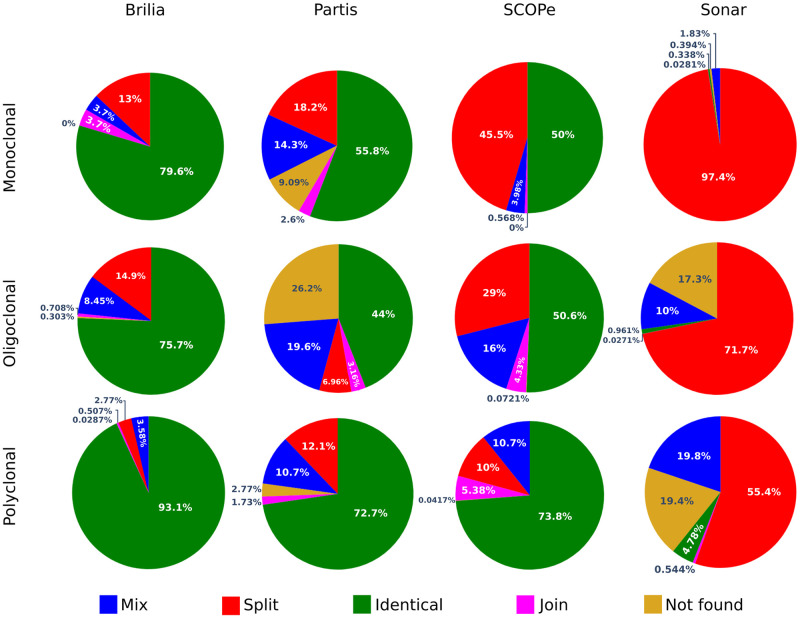
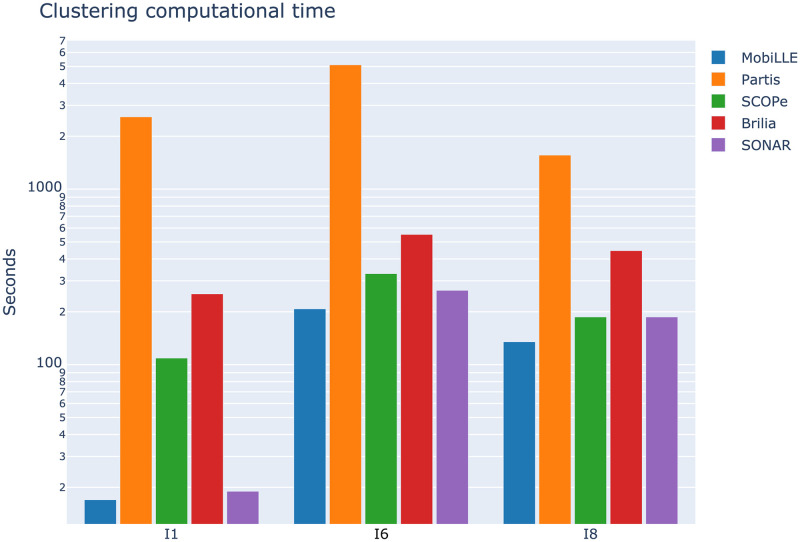
The adaptive B cell response is driven by the expansion, somatic hypermutation, and selection of B cell clonal lineages. A high number of clonal lineages in a B cell population indicates a highly diverse repertoire, while clonal size distribution and sequence diversity reflect antigen selective pressure. Identifying clonal lineages is fundamental to many repertoire studies, including repertoire comparisons, clonal tracking, and statistical analysis. Several methods have been developed to group sequences from high-throughput B cell repertoire data. Current methods use clustering algorithms to group clonally-related sequences based on their similarities or distances. Such approaches create groups by optimizing a single objective that typically minimizes intra-clonal distances. However, optimizing several objective functions can be advantageous and boost the algorithm convergence rate. Here we propose MobiLLe, a new method based on multi-objective clustering. Our approach requires V(D)J annotations to obtain the initial groups and iteratively applies two objective functions that optimize cohesion and separation within clonal lineages simultaneously. We show that our method greatly improves clonal lineage grouping on simulated benchmarks with varied mutation rates compared to other tools. When applied to experimental repertoires generated from high-throughput sequencing, its clustering results are comparable to the most performing tools and can reproduce the results of previous publications. The method based on multi-objective clustering can accurately identify clonally-related antibody sequences and presents the lowest running time among state-of-art tools. All these features constitute an attractive option for repertoire analysis, particularly in the clinical context. MobiLLe can potentially help unravel the mechanisms involved in developing and evolving B cell malignancies.


Conflict of interest statement

The authors have declared that no competing interests exist.

Figures

Fig 1
Fig 1. Flowchart of MobiLLe.
MobiLLe requires IGH annotated sequences (IGHV, IGHJ, and CDR3 region were previously identified) to form initial clusters (pre-clustering panel), we first group sequences with the same IGHV, IGHJ, and same CDR3 (AA) length; then, we separate sequences with less than s% CDR3 identity (default 70%). Refinement has two steps: ‘resolve inconsistencies’ and ‘merge singletons.’ The first one detects and resolves inconsistencies until no improvement is observed in cluster cohesion or separation. The second one tries to merge singletons into higher-density clusters to improve their uniformity. Final groups (output) represent clonal lineages with low intra-clonal diversity, high inter-clonal diversity, and a minimum number of singletons.
Fig 2
Fig 2. Clonal distribution comparisons.
Five “events” describe the differences between two clonal distributions (d1 and d2). The identical event counts the number of identical clonal lineages found in both distributions (a). The “join” event reports the number of clonal lineages in d1 found merged in d2 (b), while the split counts the number of clonal lineages in d1 found separated in d2 (c). The “mix” event is a mixture of these two later events (d), while “not found” reports the number of clonal lineages in d2 not found in d1 (e).
Fig 3
Fig 3. Performance of different parameter configurations.
We computed the closeness F-score distribution for all simulated repertoire. Each distribution contains 4480 values, one for each parameter configuration. Samples are sorted by repertoire types and SHM rates.
Fig 4
Fig 4. Effect of pre-clustering threshold on MobiLLe’s performance.
The pre-clustering threshold varied from 50% to 90%. We computed the closeness F-score (A), precision (B), and recall (C) distribution by considering all simulated repertoires (53760 parameter configurations).
Fig 5
Fig 5. Importance of using refinement and ‘merge singletons’ parameters.
A) Scatter plot of MobiLLe F-scores with refinement (ordinate) and without refinement (abscissa) parameter. B) Scatter plot of MobiLLe F-scores with ‘merge singletons’ (ordinate) and without ‘merge singletons’ (abscissa) parameter.
Fig 6
Fig 6. Impact of refinement parameters in the best and worst performance.
We averaged F-scores of 12 simulated repertoires and ranked them to form two sets of parameter configurations: those with the best performance (F-score = 1) and those with the worst performance (lowest F-score < 0.7). The ordinate shows parameter frequency and abscissa parameter type. (A, B, and C) show IGHV, IGHJ, and CDR3 distances, while (D) shows coefficient variations. Note that d––– indicates the coefficient values for α, β, and λ respectively, while ‘mean’ represents the arithmetic mean.
Fig 7
Fig 7. Comparison of clustering accuracy on simulated repertoires.
Performance evaluation of five different BCR lineage grouping methods on 12 simulated repertoires.
Fig 8
Fig 8. Performance comparison on artificial monoclonal repertoires.
We generated three artificial monoclonal repertoires (AMR1, AMR2, and AMR3) by sampling sequences from a pure B cell lineage (10%) and a polyclonal background (90%). Each benchmark contained 10000 sequences. Accurate tools might group sequences from the pure B cell lineage and separate those from the polyclonal background. We measured the performance of BCR lineage grouping methods by computing the number of splits (SC) and false positives (FP) of the most abundant group. To better visualize and compare clustering results, we show alluvial diagrams for AMR1 (a), AMR2 (b), and AMR3 (c), where blue blocks represent the pure B cell lineage and pink or orange inferred groups. Pink blocks contain only sequences belonging to the pure B cell lineage (true positives), while the orange blocks contain sequences from the polyclonal background (false positives). SONAR and BRILIA did not produce results for the AMR3 benchmarks since they do not deal with non-productive sequences.
Fig 9
Fig 9. Clonal distribution comparisons on three experimental repertoires.
We compared the inferred clonal lineages of each BCR lineage grouping tool with MobiLLe’s clustering results. For that, we defined five events: identical, join, split, mix, and not found, representing the (dis)similarities between two clonal distributions: d1 (MobiLLe) and d2 (another tool). The “identical” event accounts for the percentage of identical clonal lineages found in both distributions; the “join” event reports the percentage of d1 clonal lineages found merged in d2 while “split” the percentage of d1 clonal lineages found separated in d2. The “mix” event accounts for a mixture of “join” and “split” events while “not found” reports the percentage of clonal lineages in d2 not found in d1; see an illustration in Fig 2.
Fig 10
Fig 10. Comparing running times of clonal grouping tools.
The running times for MobiLLe and other tools were measured for three experimental repertoires with different clonal compositions. To a better visualisation, we used log scale, S16 Table shows the time in second for each considered tool.
Fig 11
Fig 11. Clonal distribution/density of nine experimental repertoires.
We plotted the 20 most abundant clonal lineages for each repertoire; Circles represent clonal groups, while their areas are proportional to the clonal group abundance.
Fig 12
Fig 12. Clonal distributions of a healthy donor and individuals with different lymphoproliferative diseases.
We plotted the 20 most abundant clonal lineages for each repertoire; Circles represent clonal groups, while their areas are proportional to the clonal group abundance. Report to Table 3 for repertoire properties and individuals’ labels.
Fig 13
Fig 13. Clonal distribution of healthy donors and patients with moderate/severe COVID-19.
A) Abundance of top 20 ranked clonal groups stratified by clinical status. We plotted each individual’s most abundant clonal groups until achieving 20 samples. B) Abundance of top 20 ranked clonal groups stratified by individuals. C) CDR3 nucleotide lengths of the top 20 clonal groups, stratified by clinical status. In panels A and B, circles represent clonal lineages, while their areas are proportional to the clonal group abundance. Each color represents an individual. Report to Table 4 for repertoire properties and individuals’ labels. Abbreviations: S-severe and M-moderate COVID-19; H-healthy donors.

Similar articles

Cited by

References

    1. Alt FW, Oltz EM, Young F, Gorman J, Taccioli G, Chen J. VDJ recombination. Immunology today. 1992;13(8):306–314. doi: 10.1016/0167-5699(92)90043-7 - DOI - PubMed
    1. Tonegawa S. Somatic generation of antibody diversity. Nature. 1983;302(5909):575–581. doi: 10.1038/302575a0 - DOI - PubMed
    1. Odegard VH, Schatz DG. Targeting of somatic hypermutation. Nature Reviews Immunology. 2006;6(8):573–583. doi: 10.1038/nri1896 - DOI - PubMed
    1. Giudicelli V, Chaume D, Lefranc MP. IMGT/GENE-DB: a comprehensive database for human and mouse immunoglobulin and T cell receptor genes. Nucleic Acids Research. 2004;33(Database issue):D256–D261. doi: 10.1093/nar/gki010 - DOI - PMC - PubMed
    1. Hershberg U, Luning Prak ET. The analysis of clonal expansions in normal and autoimmune B cell repertoires. Philosophical Transactions of the Royal Society B: Biological Sciences. 2015;370(1676):20140239. doi: 10.1098/rstb.2014.0239 - DOI - PMC - PubMed

Publication types