. 2022 Sep 6;119(36):e2117396119.
doi: 10.1073/pnas.2117396119. Epub 2022 Aug 29.

Mitochondrial outer membrane protein FUNDC2 promotes ferroptosis and contributes to doxorubicin-induced cardiomyopathy

Affiliations

Mitochondrial outer membrane protein FUNDC2 promotes ferroptosis and contributes to doxorubicin-induced cardiomyopathy

Na Ta et al. Proc Natl Acad Sci U S A. .

Abstract

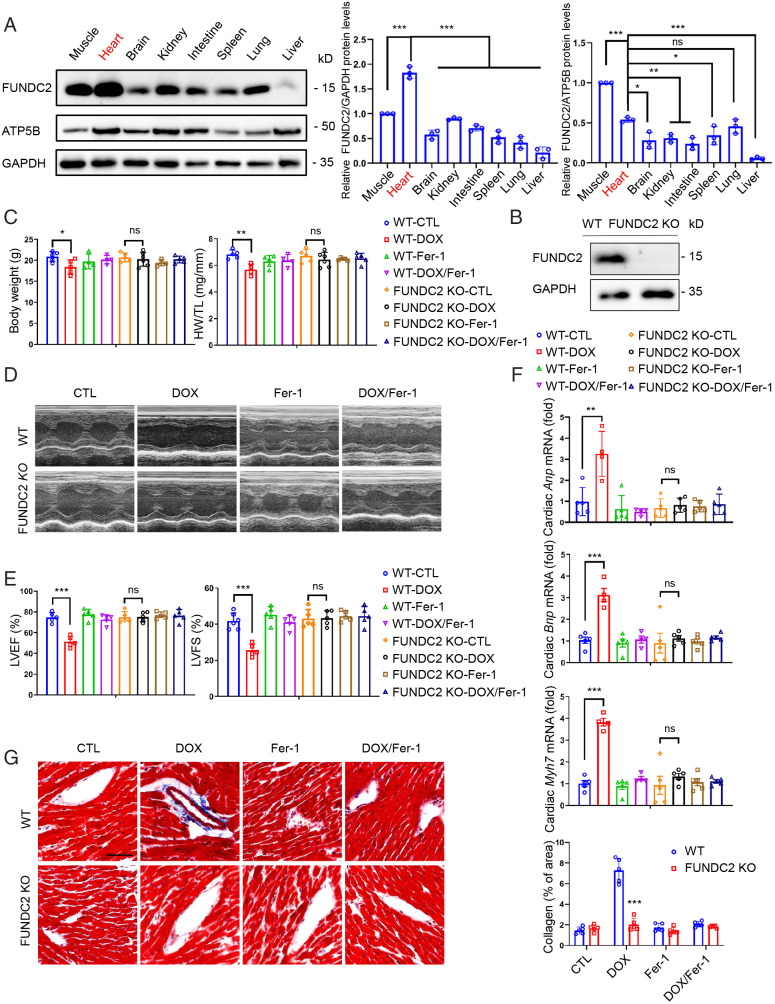
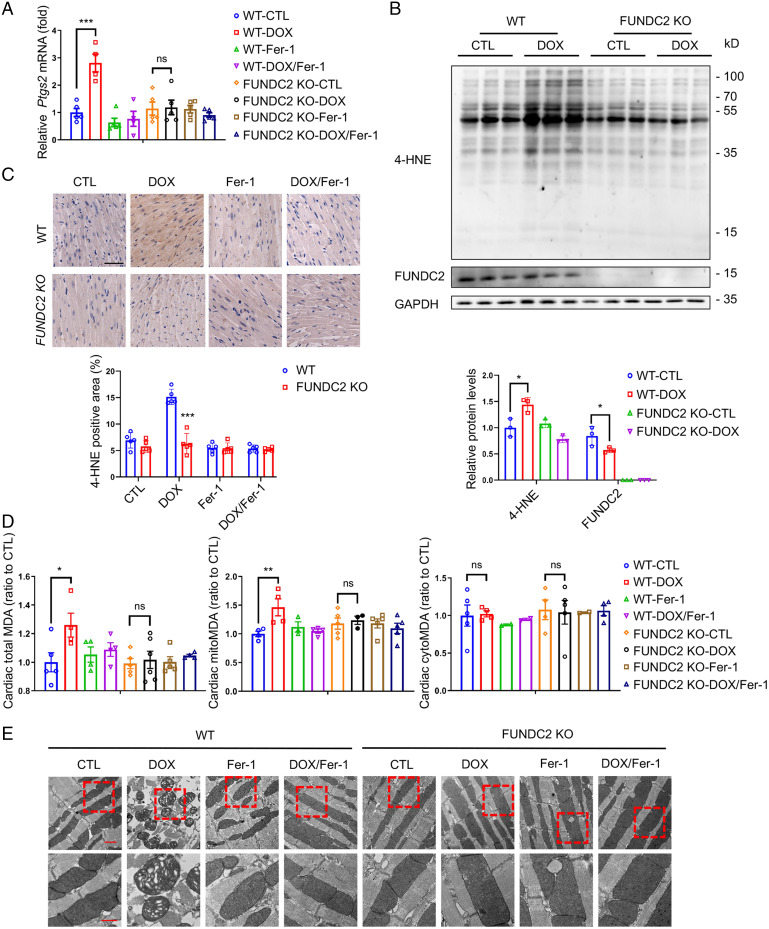
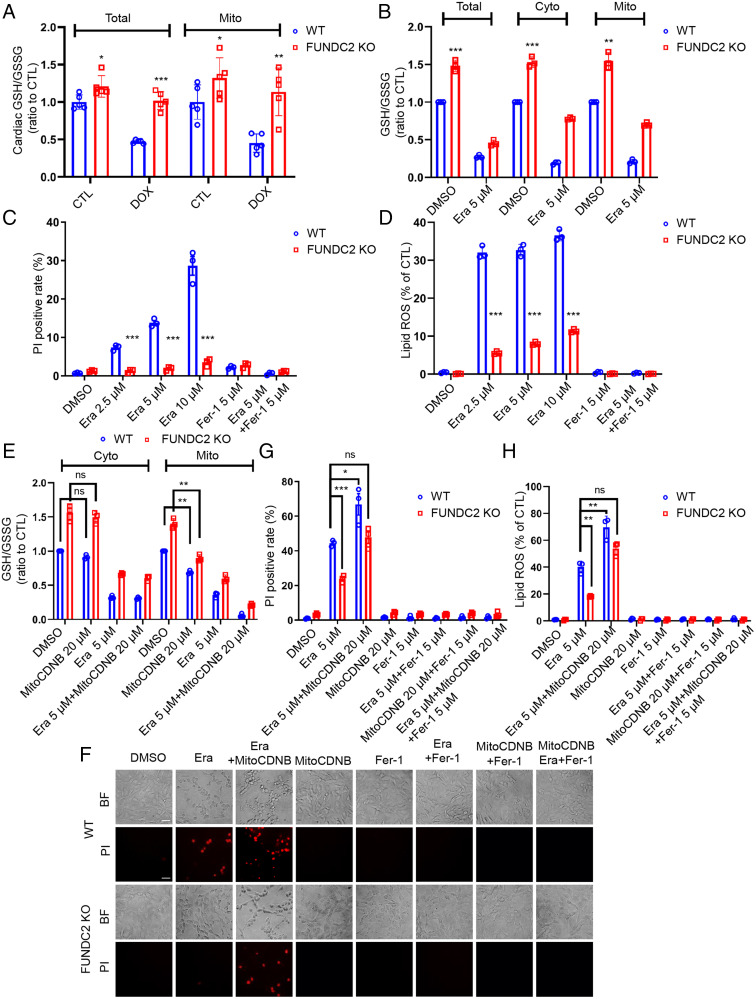
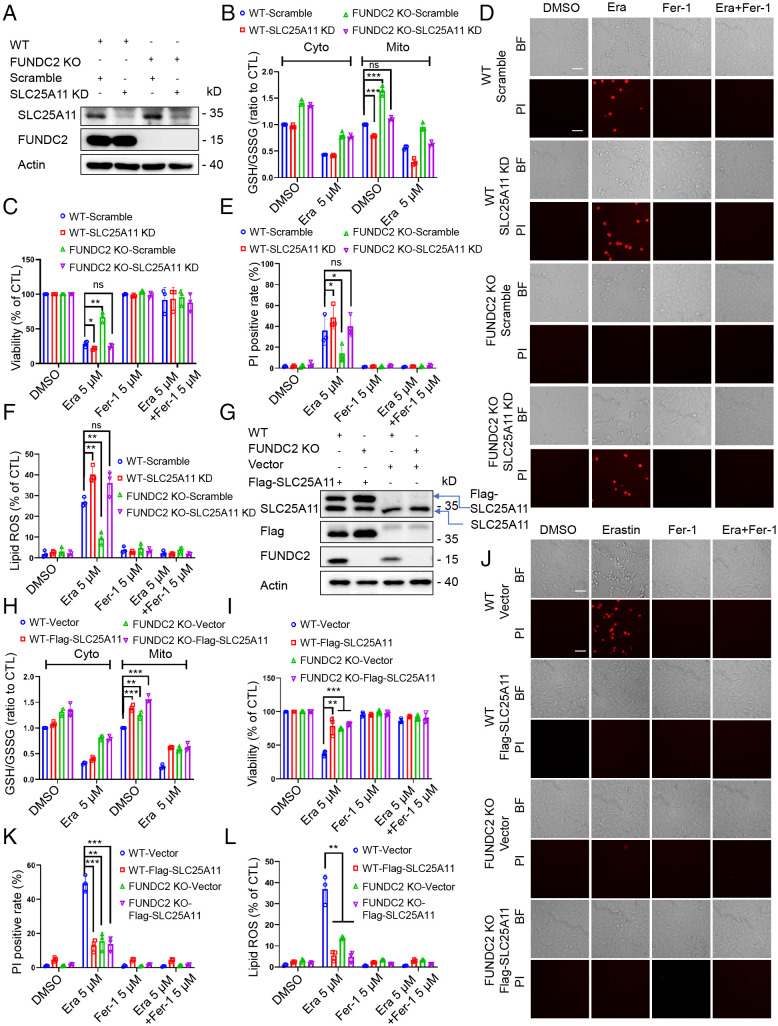
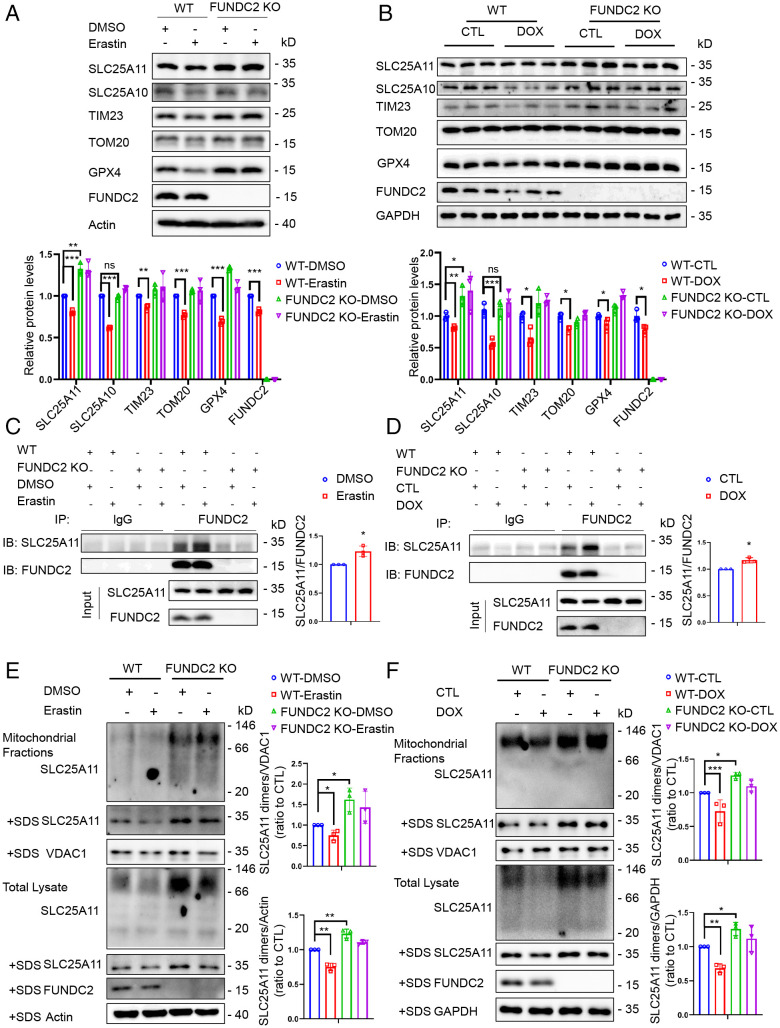
Ferroptosis is an iron-dependent programmed necrosis characterized by glutathione (GSH) depletion and lipid peroxidation (LPO). Armed with both the pro- and antiferroptosis machineries, mitochondria play a central role in ferroptosis. However, how mitochondria sense the stress to activate ferroptosis under (patho-)physiological settings remains incompletely understood. Here, we show that FUN14 domain-containing 2, also known as HCBP6 (FUNDC2), a highly conserved and ubiquitously expressed mitochondrial outer membrane protein, regulates ferroptosis and contributes to doxorubicin (DOX)-induced cardiomyopathy. We showed that knockout of FUNDC2 protected mice from DOX-induced cardiac injury by preventing ferroptosis. Mechanistic studies reveal that FUNDC2 interacts with SLC25A11, the mitochondrial glutathione transporter, to regulate mitoGSH levels. Specifically, knockdown of SLC25A11 in FUNDC2-knockout (KO) cells reduced mitoGSH and augmented erasin-induced ferroptosis. FUNDC2 also affected the stability of both SLC25A11 and glutathione peroxidase 4 (GPX4), key regulators for ferroptosis. Our results demonstrate that FUNDC2 modulates ferroptotic stress via regulating mitoGSH and further support a therapeutic strategy of cardioprotection by preventing mitoGSH depletion and ferroptosis.

Keywords: FUNDC2; SLC25A11; ferroptosis; mitoGSH; mitochondria.


Conflict of interest statement

The authors declare no competing interest.

Figures

Fig. 1.
Fig. 1.
Knockout of FUNDC2 ameliorates doxorubicin-induced cardiomyopathy. (A) Relative expression levels of FUNDC2 in different tissues of the male mouse were analyzed by Western blotting (Left) and quantified with GAPDH (Middle) or mitochondrial protein ATP5B (Right) as the internal control (n = 3 mice). (B) Immunoblot of FUNDC2 and GAPDH in heart tissue lysates from WT and FUNDC2-KO male mice. (C–G) Body weight (Left) and heart weight (HW)/tibial length (TL) ratio were measured in WT and FUNDC2-KO mice subjected to DOX or saline (control) in the presence or absence of ferrostatin-1 (Fer-1) at day 4 (n = 4 to 5 mice) (C). For each group subject, the echocardiogram was performed (D); LVEF (Left) and LVFS (Right) were measured (n = 4 to 5 mice) (E); the relative mRNA levels of Anp, Bnp, and Myh7, cardiac hypertrophy biomarkers, were analyzed by qPCR (n = 4 to 5 mice) (F); and the collagen fibrosis in myocardium were visualized by Masson’s Trichrome staining (Left) and quantified by collagen volume fraction (%, collagen fibrosis per total myocardium) (Right). (Scale bar, 50 μm.) (n = 4 to 5 mice) (G). Statistical significance was calculated by Student t test (G) and one-way ANOVA (A, C, E, and F);*P < 0.05, **P < 0.01, ***P < 0.001 and ns indicates no significance.
Fig. 2.
Fig. 2.
Knockout of FUNDC2 mitigates doxorubicin-induced ferroptosis. (A–E) For the mice both WT and FUNDC2-KO subjected to DOX or saline (control) treatment in the presence or absence of Fer-1 at day 4, the relative levels of Ptgs2 mRNA in myocardium were measured by qPCR (n = 4 to 5 mice) (A), and their expression levels of 4-HNE in hearts were analyzed and quantified relative to GAPDH by immunoblot analysis (n = 3 mice) (B). The cardiac tissues of mice from each group were stained with anti–4-HNE (Top) and quantitative analysis was performed (Bottom). (Scale bars, 50 μm [Top].) (n = 4 to 5 mice) (C). MDA levels in the whole (Left), the cytosolic fraction (Middle), and the mitochondrial fraction (Right) (n = 4 to 5 mice) (D) of the myocardium tested were measured. Representative EM images of cardiac tissues (E) were obtained. (Scale bars, 1 μm [Top] and 500 nm [Bottom].) Statistical significance was calculated by Student’s t test (C) and one-way ANOVA (A, B, and D); *P < 0.05, **P < 0.01, ***P < 0.001 and ns indicates no significance.
Fig. 3.
Fig. 3.
FUNDC2-KO inhibits but mitoGSH depletion increases erastin-induced cell death. (A) The cardiac glutathione (GSH)/GSSG ratio and the cardiac mitochondrial (mito) GSH/GSSG ratio of each mouse were measured in WT and FUNDC2-KO mice subjected to DOX or saline (control [CTL]). (B–D) Cellular, cytosolic (Cyto), and mitochondrial (Mito) GSH/GSSG ratio were determined in WT and FUNDC2-KO MEF cells after being treated with 5 μM erastin or dimethyl sulfoxide (DMSO) for 3 h (B). These two types of cells were treated with 2.5 μM, 5 μM, and 10 μM erastin or DMSO for 6 h or 4 h in the presence or absence of 5 μM Fer-1; after that, the cell death of each group was determined by PI staining coupled with flow cytometry (6 h) (C); and the lipid ROS level of each group was analyzed by C11-BODIPY staining coupled with flow cytometry (4 h) (D). (E–H) Cyto and Mito GSH/GSSG ratio were determined in WT and FUNDC2-KO MEF cells after being incubated with 5 μM erastin or DMSO for 3 h with or without the pretreatment of 20 μM MitoCDNB (E). In addition, both cell types pretreated with 20 μM MitoCDNB or not were incubated with 5 μM erastin or DMSO for 6 h or 4 h with the presence or absence of 5 μM Fer-1. Then cell death was visualized by PI staining coupled with microscopy in both the brightfield (BF) (Top) and fluorescent (Bottom) modes (Scale bar, 20 μm.) (F) at the same position and further analyzed by PI staining coupled with flow cytometry (6 h) (G); and the lipid ROS level was determined by C11-BODIPY staining coupled with flow cytometry (4 h) (H). Data from three independent experiments and statistical significance was calculated by Student’s t test; *P < 0.05, **P < 0.01, ***P < 0.001 and ns indicates no significance.
Fig. 4.
Fig. 4.
FUNDC2/SLC25A11 axis modulates ferroptosis. (A) Immunoblot analysis of FUNDC2, SLC25A11, and actin in WT, WT/SLC25A11-KD, FUNDC2-KO, and FUNDC2-KO/SLC25A11 KD MEF cells. (B–F) Cyto and Mito GSH/GSSG ratio were determined in WT/scramble, WT/SLC25A11-KD, FUNDC2-KO/scramble, and FUNDC2-KO/SLC25A11-KD MEF cells after being treated with 5 μM erastin or DMSO for 3 h (B). These four types of cells were treated with 5 μM erastin or DMSO for 6 h or 4 h in the presence or absence of 5 μM Fer-1; then the cell viability was measured by CCK-8 (C); the cell death was visualized by PI staining coupled with microscopy in both the brightfield (BF) (Top) and fluorescent modes (Bottom) (Scale bar, 20 μm.) (D) at the same position and further analyzed by PI staining coupled with flow cytometry (6 h) (E); and the lipid ROS level was determined by C11-BODIPY staining coupled with flow cytometry (4 h) (F). (G) Immunoblot analysis of FUNDC2, SLC25A11, and actin in WT/vector, WT/Flag-SLC25A11, FUNDC2-KO/vector, and FUNDC2-KO/Flag-SLC25A11 MEF cells. (H–L) Cyto and Mito GSH/GSSG ratio (H) were determined in WT/vector and WT/Flag-SLC25A11, as well as FUNDC2-KO/vector and FUNDC2-KO/Flag-SLC25A11 MEF cells after being treated with 5 μM erastin or DMSO for 3 h. These four types of cells were treated with 5 μM erastin or DMSO in the presence or absence of 5 μM Fer-1; then the cell viability was measured by CCK-8 (I); the cell death was visualized by PI staining coupled with microscopy in both the brightfield (BF) (Top) and fluorescent (Bottom) modes (Scale bar, 20 μm.) (J) at the same position and further analyzed by PI staining coupled with flow cytometry (6 h) (K); and the lipid ROS level was determined by C11-BODIPY staining coupled with flow cytometry (4 h) (L). Data from three independent experiments and statistical significance was calculated by one-way ANOVA; *P < 0.05, **P < 0.01, ***P < 0.001 and ns indicates no significance.
Fig. 5.
Fig. 5.
FUNDC2 regulates SLC25A11 protein. (A) Immunoblot analysis of FUNDC2, SLC25A11, SLC25A10, TIM23, TOM20, GPX4, and actin in WT and FUNDC2-KO MEF cells treated with 5 μM erastin or DMSO for 6 h. (B) Immunoblot analysis of FUNDC2, SLC25A11, SLC25A10, TIM23, TOM20, GPX4, and GAPDH in myocardium of WT and FUNDC2-KO mice treated with DOX or saline (control) for 4 d (n = 3 mice). (C) WT and FUNDC2-KO MEF cells treated with 5 μM erastin or DMSO for 3 h were collected for IP with lgG or anti-FUNDC2 antibodies and analyzed with anti-FUNDC2 or SLC25A11 antibodies, respectively. IB, immunoblot. IgG was used as the negative control. (D) Cardiac tissues of WT and FUNDC2-KO mice treated with DOX or saline (control) for 3 d were collected for IP with lgG or anti-FUNDC2 antibodies and analyzed with FUNDC2 or SLC25A11 antibodies, respectively. IgG was used as the negative control. (E) Dimeric and monomeric forms of SLC25A11 were analyzed in WT and FUNDC2-KO MEF cells and mitochondrial fractions treated with 5 μM erastin or DMSO for 6 h. Mitochondria fractions isolated from the cells and total cellular lysates with the presence or absence of SDS were separated by native PAGE, blotted to NC membranes, and incubated with antibodies against SLC25A11, FUNDC2, VDAC1, and actin. (F) Dimeric and monomeric forms of SLC25A11 were analyzed in the cardiac tissues and mitochondrial fractions from WT and FUNDC2-KO mice treated with DOX or saline (control) for 4 d. Mitochondria fractions isolated from cardiac tissues and tissue lysates with the presence or absence of SDS were separated by native-PAGE, blotted to NC membrane, and incubated with antibodies against SLC25A11, FUNDC2, VDAC1, and GAPDH. Data in A and C–F were obtained from three independent experiments. Statistical significance was calculated by Student’s t test (C and D) and one-way ANOVA (A, B, E, and F); *P < 0.05, **P < 0.01, ***P < 0.001 and ns indicates no significance.

References

    1. Dixon S. J., et al. , Ferroptosis: An iron-dependent form of nonapoptotic cell death. Cell 149, 1060–1072 (2012). - PMC - PubMed
    1. Yang W. S., et al. , Regulation of ferroptotic cancer cell death by GPX4. Cell 156, 317–331 (2014). - PMC - PubMed
    1. Mao C., et al. , DHODH-mediated ferroptosis defence is a targetable vulnerability in cancer. Nature 593, 586–590 (2021). - PMC - PubMed
    1. Ding C. C., et al. , MESH1 is a cytosolic NADPH phosphatase that regulates ferroptosis. Nat. Metab. 2, 270–277 (2020). - PMC - PubMed
    1. Chu B., et al. , ALOX12 is required for p53-mediated tumour suppression through a distinct ferroptosis pathway. Nat. Cell Biol. 21, 579–591 (2019). - PMC - PubMed

Publication types