. 2022 Sep 6;119(36):e2203452119.
doi: 10.1073/pnas.2203452119. Epub 2022 Aug 29.

3D chromatin remodeling potentiates transcriptional programs driving cell invasion

Affiliations

3D chromatin remodeling potentiates transcriptional programs driving cell invasion

Benjamin Lebeau et al. Proc Natl Acad Sci U S A. .

Abstract

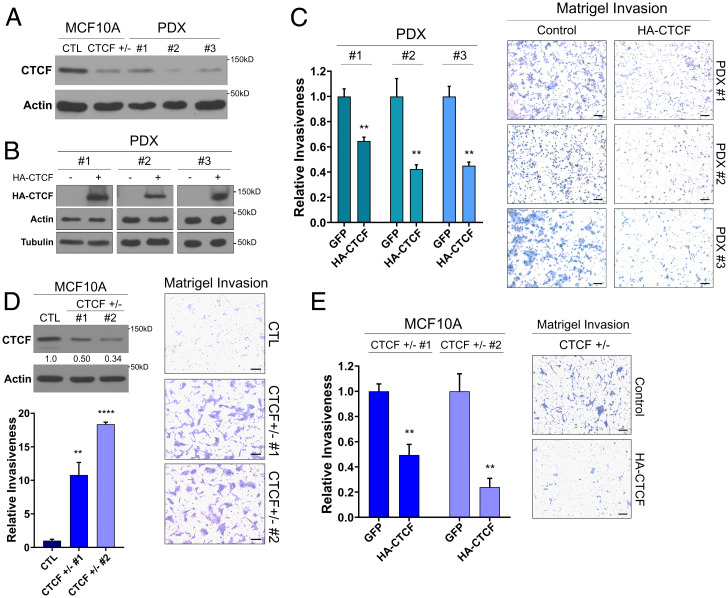
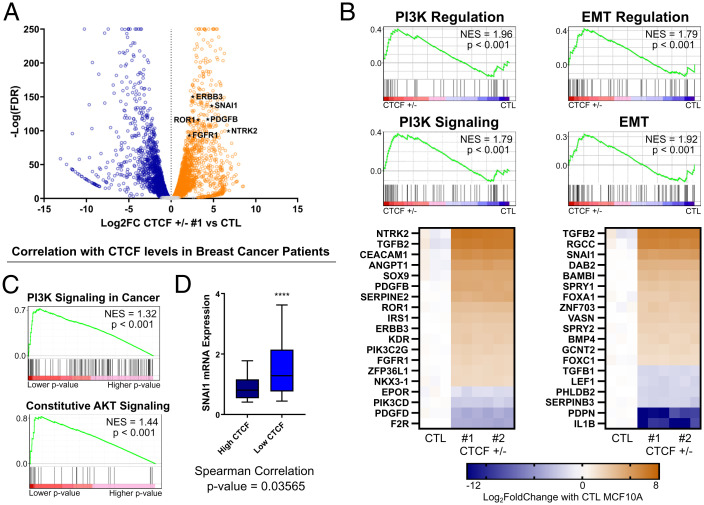
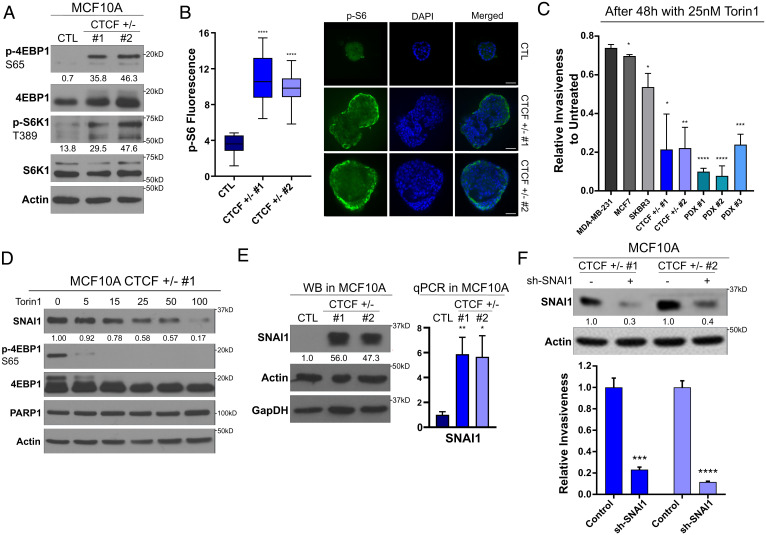
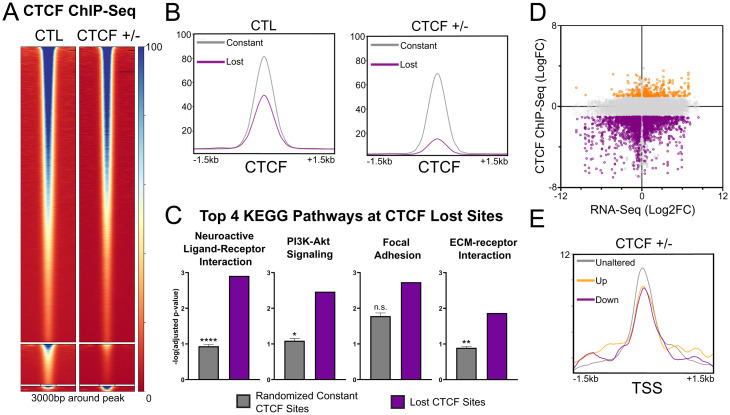
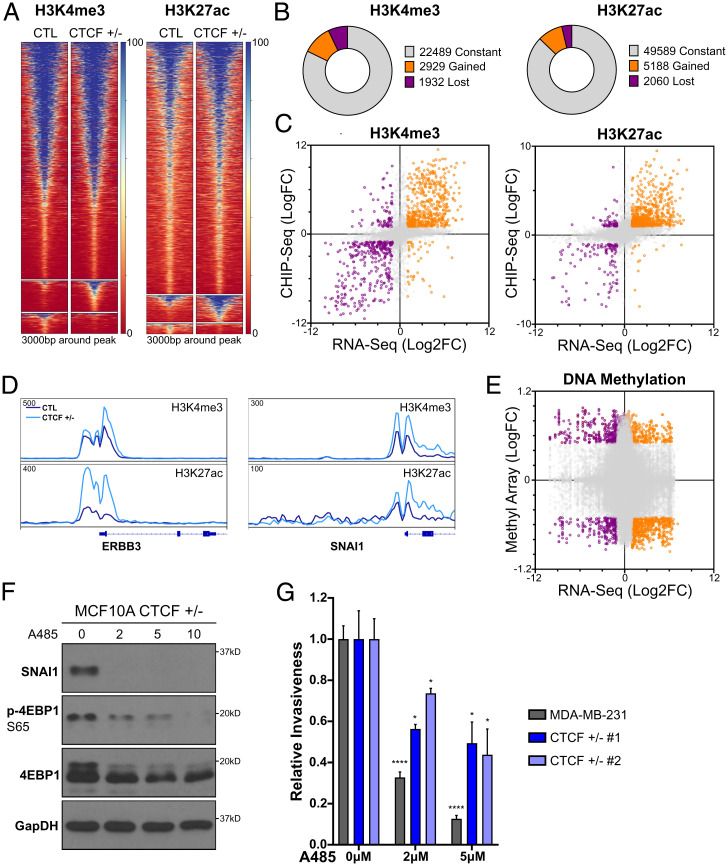
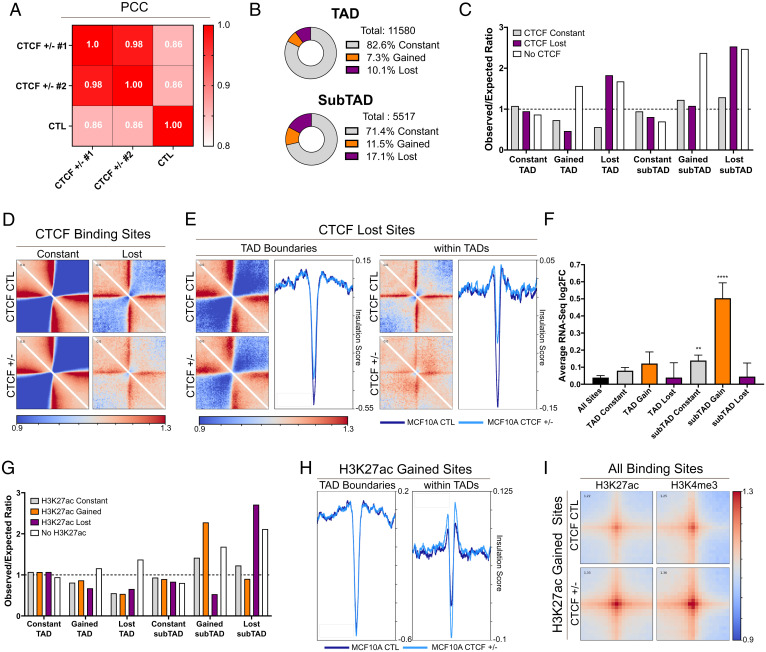
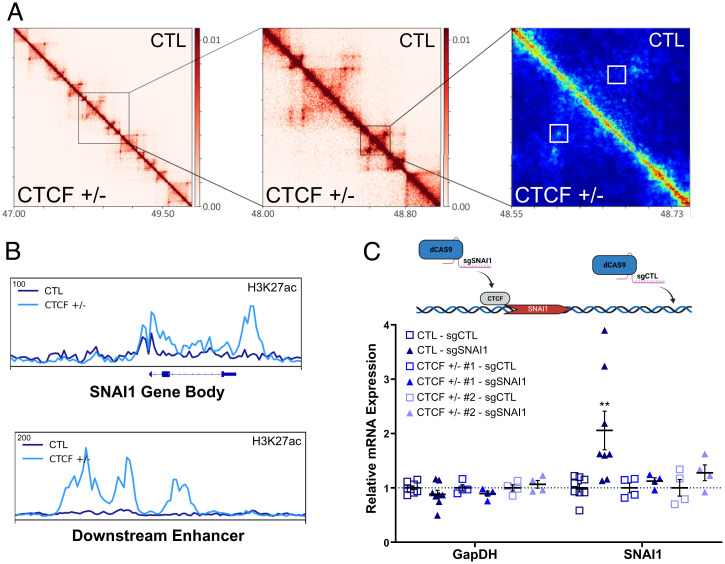
The contribution of deregulated chromatin architecture, including topologically associated domains (TADs), to cancer progression remains ambiguous. CCCTC-binding factor (CTCF) is a central regulator of higher-order chromatin structure that undergoes copy number loss in over half of all breast cancers, but the impact of this defect on epigenetic programming and chromatin architecture remains unclear. We find that under physiological conditions, CTCF organizes subTADs to limit the expression of oncogenic pathways, including phosphatidylinositol 3-kinase (PI3K) and cell adhesion networks. Loss of a single CTCF allele potentiates cell invasion through compromised chromatin insulation and a reorganization of chromatin architecture and histone programming that facilitates de novo promoter-enhancer contacts. However, this change in the higher-order chromatin landscape leads to a vulnerability to inhibitors of mTOR. These data support a model whereby subTAD reorganization drives both modification of histones at de novo enhancer-promoter contacts and transcriptional up-regulation of oncogenic transcriptional networks.

Keywords: CTCF; TAD; breast cancer; epigenetics; subTAD.


Conflict of interest statement

The authors declare no competing interest.

Figures

Fig. 1.
Fig. 1.
CTCF loss of heterozygosity promotes invasiveness and unorganized growth in distinct breast epithelial models. (A) Western blot showing low levels of CTCF, similar to the CTCF+/− MCF10A, in the PDX cells. Loading CTL: actin. (B) Western blot of ectopic HA-CTCF expression in PDX cell lines. Loading CTLs: actin and tubulin. (C) Decrease in relative invasiveness of HA-CTCF PDXs to their respective GFP CTLs (mean ± standard error of mean (SEM]). P = 0.0031, 0.0084, and 0.0015 for PDX 1, 2, and 3, respectively. (D) Western blot of low CTCF levels in CTCF+/− compared to CTL MCF10A. Quantification of relative CTCF band intensity in CTCF+/− to CTL. Loading CTL: actin. Bar chart of the increased relative invasiveness of CTCF+/− to CTL (mean ± SEM). P = 0.0066 and P < 0.0001 for CTCF+/− 1 and 2, respectively. (E) Decrease in relative invasiveness of CTCF+/− MCF10A with HA-CTCF addback to their respective GFP CTLs (mean ± SEM). P = 0.0013 for both CTCF+/− 1 and 2. P value indicators, *P = 0.05, **P = 0.01, ***P = 0.001, ****P = 0.0001. See also SI Appendix, Fig. S1.
Fig. 2.
Fig. 2.
RNA-seq reveals oncogenic expression underlying the invasive phenotypes. (A) Volcano plot of transcriptomic changes between CTCF+/− 1 and CTL MCF10A. Genes of the PI3K and EMT pathways, marked as black stars, are among the top up-regulated genes. (B) Top: GSEA of Gene Ontology PI3K pathways and EMT pathways up-regulated in CTCF+/− MCF10A compared to CTL. Bottom: Heatmaps of the top 20 most up- or down-regulated genes, ranked by abs(log2FC), in the PI3K and EMT regulation pathways. (C) Most enriched pathway by P value (PI3K signaling) and NES (Akt signaling) following GSEA prerank analysis of genes significantly correlating with CTCF expression in TCGA breast cancer patient RNA-seq data. Genes were ranked by −log(Spearman test P value). (D) Box plot (10th to 90th percentile) of higher SNAI1 expression levels in low-CTCF breast tumors (P < 0.0001, one-tailed Student’s t test) detected by RNA-seq in TCGA breast cancer patients for tumors in the top 20% of low CTCF expression compared to the top 20% of high CTCF expression. The P value for the Spearman correlation test is also noted. Scale bars represent distribution or mRNAs, from minimum (low bar) to maiximum (upper bar). See also SI Appendix, Fig. S2.
Fig. 3.
Fig. 3.
The PI3K pathway and SNAI1 are central for the oncogenic properties of CTCF+/− cells. * values for P values as indicated in Fig. 1. (A) Western blot showing maintained phosphorylation of mTORC1 targets under serum-free conditions in CTCF+/− cells. Quantification represents the band intensity normalized on background. Loading CTL: actin. (B) Mammosphere immunofluorescence and quantification of increased S6 fluorescence of the outer layer of the mammosphere in CTCF+/− compared to CTL MCF10A. Bars represent minimum and maximum values. P < 0.0001 for CTCF+/− 1 and 2 compared to CTL. (C) Invasiveness following 48 h of 25 nM Torin1 treatment normalized relative to the untreated invasiveness of each cell line (mean ± SEM). P values comparing each cell line to the relative invasiveness of MDA-MB-231: MCF7 = 0.031508, SKBR3 = 0.019340, CTCF+/− 1 = 0.018925, CTCF+/− 2 = 0.003089, PDX 1 = 0.000002, PDX 2 = 0.000076, and PDX 3 = 0.000262. (D) Western blot, using serum-free conditions, for SNAI1 levels and 4EBP1 phosphorylation following 24 h of Torin1 treatment. Quantification of SNAI1 band intensity relative to untreated levels is shown below each blot. Loading CTLs: PARP1 and actin. (E) Western blot (WB) of SNAI1 levels in CTCF+/− MCF10A cells. Quantification of relative SNAI1 band intensity to CTL is shown below the topmost blot. Loading CTLs: actin and GapDH. Bar chart (mean ± SEM) of qPCR validation of SNAI1 overexpression at the mRNA levels. (F) Western blot of SNAI1 levels following anti-SNAI1 short hairpin RNA treatment. Bottom: Quantification of relative SNAI1 band intensity to shCTL. Loading CTL: actin. Bar chart of decreased relative invasiveness of the shSNAI1-treated CTCF+/− MCF10A compared to shCTL treated (mean ± SEM). P = 0.00103 and P = 0.000141 for CTCF+/− 1 and CTCF+/− 2 respectively. All P values were calculated using Student’s t test.
Fig. 4.
Fig. 4.
CTCF depletion alters the CTCF DNA binding pattern. (A) CTCF ChIP-seq heatmap of constant, lost, and gained sites (Top to Bottom). (B) Reduced average CTCF ChIP-seq read density of lost sites compared to constant sites in the CTL and CTCF+/− MCF10A. (C) Differential enrichment of the top 4 KEGG pathways, dominated by PI3K- and ECM-related pathways (ranked by geneRatio), at lost sites of CTCF compared to 100 equinumerous subsets of constant sites (mean ± SEM). n.s. = not significant (D) Dot plot of gene expression (log2FC) and CTCF binding (logFC) changes between CTCF+/− and CTL MCF10A for binding sites colocalizing (±3 kb) with expressed genes. Lost sites (purple) are found in proximity to both up- and down-regulated genes. Gained sites (orange) are differentially found in proximity to up-regulated genes. (E) Decreased average CTCF ChIP-seq read density in CTCF+/− MCF10A at the TSSs of all up-regulated genes (adjusted P < 0.05, log2FC > 1) and down-regulated genes (in purple, adjusted P < 0.05, log2FC < −1) compared to unaltered genes [adjusted P > 0.05, abs(log2FC) < 0.5]. See also SI Appendix, Fig. S3.
Fig. 5.
Fig. 5.
Epigenetic reprogramming of activating histone marks drives changes in gene expression. (A) H3K4me3 and H3K27ac ChIP-seq heatmaps for constant, gained, and lost sites (Top to Bottom). (B) Partitioning of constant, gained, and lost clusters from A. (C) Dot plot of highly correlating gene expression (log2FC) and H3K4me3 or H3K27ac (logFC) changes between CTCF+/− and CTL MCF10A for binding sites colocalizing (±3 kb) with expressed genes. (D) ChIP-seq track of the normalized read density for H3K27ac or H3K4me3 surrounding ERBB3 and SNAI1. (E) Dot plot of gene expression (log2FC) and EPIC methyl array (logFC) changes between CTCF+/− and CTL MCF10A for binding sites colocalizing (±3 kb) with expressed genes. (F) Western blot, under starved conditions, for 4EBP1 phosphorylation and SNAI1 levels following 48 h of HATi A485 treatment (in micromolars). (G) Relative invasiveness of A485-treated CTCF+/− MCF10A and CTL MDA-MB-231 (mean ± SEM) . P values of treated compared to untreated cells; 2 μM A485: MDA-MB-231 < 0.0001, CTCF+/− 1 = 0.0444, and CTCF+/− 2 = 0.0232; 5 μM A485: MDA-MB-231 < 0.0001, CTCF+/− 1 = 0.0284, and CTCF+/− 2 = 0.0252. See also SI Appendix, Fig. S4.
Fig. 6.
Fig. 6.
Loss of subTAD insulation drives gene expression changes. (A) Pearson correlation coefficient (PCC) heatmaps showing diverging contact frequencies between CTCF+/− 1 and 2 and CTL. (B) Partitioning of constant, gained, and lost TAD and subTAD boundaries (±10 kb). (C) Enrichment of CTCF sites at boundaries (ratio of observed to expected (O/E)), showing an association between loss of CTCF and lost boundaries and absence of CTCF and altered boundaries. These are both more pronounced for subTAD boundaries. (D) Pileup plots showing local interaction, relative to randomize average genomewide interaction, around constant and lost sites of CTCF (range: 200 kb). CTCF lost sites show less insulation in CTL MCF10A, which is further reduced upon loss of CTCF. (E) Pileup plots of local interactions at CTCF sites localizing at TAD boundaries or within TADs. The profile plot of the average insulation score in each region quantifies the specific loss of insulation observed at lost sites of CTCF within TADs. (F) Average RNA-seq log2FC between CTCF+/− and CTL of genes colocalizing with TAD and subTAD boundaries (±10 kb) (mean ± SEM), showing that gained subTAD boundaries are strongly associated with up-regulation of gene expression. (G) Enrichment of altered H3K27ac sites at altered subTAD, but not TAD, boundaries (O/E ratio). Dashed lined represents an O/E ratio of 1. (H) Increased average insulation score at sites of gained H3K27ac within TAD but not at TAD boundaries (colocalization: ±10 kb, range: 200 kb). (I) Pileup plots of increased interaction between gained H3K27ac and all sites of H3K27ac and H3K4me3 (range: 50 kb). See also SI Appendix, Fig. S5.
Fig. 7.
Fig. 7.
Loss of CTCF at SNAI1 drives reorganization of subTAD interactions. (A) Increasing zoom of the 10- and 5-kb resolution HiC heatmap to HIFI high-resolution heatmap around SNAI1 loci (chromosome 20, coordinates in megabases). Gain of enhancer-promoter interaction on the SNAI1 body, specific to CTCF+/− cells, shown in the white boxes in the HIFI heatmap. (B) ChIP-seq track of normalized read density of increased H3K27ac on the SNAI1 gene body and the downstream enhancer, which displayed a gain of interaction in A. (C) Mean ± SEM (error bars) and individual replicates mRNA expression, relative to sgCTL, of infected CTL and CTCF+/− MCF10A. SNAI1 mRNA levels (P = 0.0057) in CTL-sgSNAI1 compared to CTL-sgCTL. All other comparisons are nonsignificant. Top: Schematic of the experimental conditions. Dashed line represents a ratio of mRNA levels equal to 1, relative to controls, indicating unchanged mRNA. See also SI Appendix, Fig. S6.

References

    1. Chen C., et al. , Spatial genome re-organization between fetal and adult hematopoietic stem cells. Cell Rep. 29, 4200–4211.e7 (2019). - PMC - PubMed
    1. Lieberman-Aiden E., et al. , Comprehensive mapping of long-range interactions reveals folding principles of the human genome. Science 326, 289–293 (2009). - PMC - PubMed
    1. Dixon J. R., et al. , Topological domains in mammalian genomes identified by analysis of chromatin interactions. Nature 485, 376–380 (2012). - PMC - PubMed
    1. Rao S. S. P., et al. , Cohesin loss eliminates all loop domains. Cell 171, 305–320.e24 (2017). - PMC - PubMed
    1. Guo Y., et al. , CRISPR inversion of CTCF sites alters genome topology and enhancer/promoter function. Cell 162, 900–910 (2015). - PMC - PubMed

Publication types

MeSH terms