. 2022 Sep 6;119(36):e2205629119.
doi: 10.1073/pnas.2205629119. Epub 2022 Aug 29.

LAPTM5 mediates immature B cell apoptosis and B cell tolerance by regulating the WWP2-PTEN-AKT pathway

Affiliations

LAPTM5 mediates immature B cell apoptosis and B cell tolerance by regulating the WWP2-PTEN-AKT pathway

Ying Wang et al. Proc Natl Acad Sci U S A. .

Abstract

Elimination of autoreactive developing B cells is an important mechanism to prevent autoantibody production. However, how B cell receptor (BCR) signaling triggers apoptosis of immature B cells remains poorly understood. We show that BCR stimulation up-regulates the expression of the lysosomal-associated transmembrane protein 5 (LAPTM5), which in turn triggers apoptosis of immature B cells through two pathways. LAPTM5 causes BCR internalization, resulting in decreased phosphorylation of SYK and ERK. In addition, LAPTM5 targets the E3 ubiquitin ligase WWP2 for lysosomal degradation, resulting in the accumulation of its substrate PTEN. Elevated PTEN levels suppress AKT phosphorylation, leading to increased FOXO1 expression and up-regulation of the cell cycle inhibitor p27Kip1 and the proapoptotic molecule BIM. In vivo, LAPTM5 is involved in the elimination of autoreactive B cells and its deficiency exacerbates autoantibody production. Our results reveal a previously unidentified mechanism that contributes to immature B cell apoptosis and B cell tolerance.

Keywords: B cell tolerance; E3 ubiquitin ligase; apoptosis; immature B cell; lysosomal-associated transmembrane protein 5.


Conflict of interest statement

The authors declare no competing interest.

Figures

Fig. 1.
Fig. 1.
Increased immature B cell population in the BM of Laptm5−/−56R mice compared with 56R mice. (A) Representative FACS profiles showing the pro-B (B220+CD43+) and recirculating B cells (B220hiCD43) (Upper), and pre-B (B220+CD43IgM) and immature B (B220+CD43IgM+) (Lower) populations in the BM. (B and C) Percentages of recirculating (B) and immature (C) B cells in WT, Laptm5−/−, 56R, and Laptm5−/−56R mice (n = 5 or 6). (D) Increased proportion of 7-AAD+ dead immature B cells in Laptm5−/−56R relative to 56R mice. Left, representative FACS profiles; Right, percentages of 7-AAD+ cells in gated immature B cells from 7-wk-old age-matched 56R and Laptm5−/−56R mice (n = 5). (E) UMAP projection of BM B220+ cells with major subsets color coded by assigned cell type showing 2,961 cells from three 56R mice (Left) and 3,990 cells from three Laptm5−/−56R mice (Right). (F) Frequency of all cell types in 56R and Laptm5−/−56R mice. *P < 0.05; **P < 0.01; ****P < 0.0001.
Fig. 2.
Fig. 2.
Increased autoreactive B cells and elevated autoantibody levels in Laptm5−/−56R compared with 56R mice. (A) Heatmap of differentially activated pathways in the immature and mature B cells from 56R and Laptm5−/−56R mice. C0, immature B; C3, mature B cells. (B) Pie chart representations of clone distribution of immature B and mature B cells expressing 56R heavy chain from 56R (Upper) and Laptm5−/−56R (Lower) mice. Numbers above and below the line in the center of the pie chart indicate unique and total sequences, respectively. (C and D) Percentages of Vκ38C+ (C) and Vκ21D+ (D) cells in the gated MZB population. (E) Left, elevated levels of IgM anti-Sm/RNP antibodies in Laptm5−/− relative to WT mice; Right, Laptm5−/− and Laptm5−/−56R mice produced elevated levels of IgM anti-DNA antibodies compared to WT and 56R mice, respectively. The 70-wk-old age-matched WT, Laptm5−/−, 56R, and Laptm5−/−56R mice (n = 3 or 5) were bled, and serum levels of IgM anti-Sm/RNP and IgM anti-DNA were measured by enzyme-linked immunosorbent assay (ELISA). (F) Serum levels of IgM anti-nuclear antibodies were detected by HEp2 reactivity. Each symbol in C and D represents an individual mouse and means ± SD are shown. *P < 0.05; **P < 0.01; ***P < 0.001.
Fig. 3.
Fig. 3.
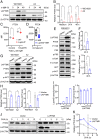
Anti-IgM–induced immature B cell death is in part mediated by LAPTM5. (A) LAPTM5-deficient immature B cells were more resistant to α-IgM–induced death. BM cells isolated from 7-wk-old WT and LAPTM5-deficient mice (n = 4) were cultured in the presence of different concentrations of α-IgM antibodies for 6 h and analyzed for the proportion of 7-AAD+ cells by FACS in gated immature B cells (B220dullIgDIgκ+). (B) LAPTM5 protein expression was up-regulated in WEHI231 cells by α-IgM stimulation (10 μg/mL). (C) BCR cross-linking induced death of WEHI231 cells. WEHI231 cells were cultured in the presence of 10 μg/mL α-IgM and analyzed for cell viability 24 and 48 h after the culture. (D) Reduced apoptosis in LAPTM5-deficient WEHI231 cells (clones A2, A4, and A6) after α-IgM stimulation. Mean ± SD of five experiments is shown. (E) Analysis of BCR signaling events in WEHI231 and A2 cells before and after α-IgM (10 μg/mL) stimulation for 24 and 48 h. (F and G) Mean fluorescence intensity (MFI) of p-SYK (Left) and p-AKT (Right) in immature B cells of WT and Laptm5−/− (F, n = 4) or 56R and Laptm5−/−56R mice (G, n = 6). (H) Ectopic expression of LAPTM5 induced apoptosis of WEHI231 cells. WEHI231 cells were transduced with retrovirus expressing LAPTM5-IRES-GFP or GFP alone (vector) and analyzed for annexin V+ cells at 48 h (Upper) and mitochondrial membrane potential at 72 h (Bottom) in the gated GFP+ population. A summary of three independent experiments is shown. (I) Immunoblot of molecules involved in BCR signaling and apoptosis after ectopic expression of LAPTM5 in WEHI231 cells. *P < 0.05; **P < 0.01; ***P < 0.005; ****P < 0.0001.
Fig. 4.
Fig. 4.
LAPTM5 enhances PTEN protein level. (A and B) PTEN protein levels in WEHI231 and A2 cells before (0 h) or after α-IgM treatment for 24 and 48 h. (A) Representative results of immunoblot. (B) Summary of three independent experiments shown in A. (C) PTEN protein levels in immature B cells of WT and Laptm5−/− mice (n = 4) before and after α-IgM stimulation for 6 h. (D) PTEN protein levels in immature B cells of 56R and Laptm5−/−56R mice (n = 6). (E) Immunoblot for the expression of molecules involved in the PI3K-AKT signaling pathway. (F) Quantitation of PTEN and p-AKT levels from three experiments shown in E. (G and H) LAPTM5 increased PTEN and decreased p-AKT level. WEHI231 and A2 cells were transduced with retrovirus expressing empty vector or LAPTM5 and analyzed for LAPTM5, PTEN, AKT, and p-AKT level by immunoblot. (H) Quantitation of PTEN (Left) and p-AKT (Right) levels from three experiments shown in G. (I) LAPTM5 did not affect Pten transcript levels. Left, WEHI231 cells were transduced with increasing titers of retrovirus expressing LAPTM5 and analyzed for the transcript levels of Laptm5 (Left) and Pten (Right). (J and K) Effect of LAPTM5 on PTEN protein stability. WEHI231 cells transduced with retrovirus expressing LAPTM5 were treated with CHX and analyzed for PTEN and LAPTM5 protein levels by immunoblot. (J) Representative blots. (K) Summary of three experiments shown in J. Each symbol in C and D represents an individual mouse and means ± SD are shown. *P < 0.05; **P < 0.01.
Fig. 5.
Fig. 5.
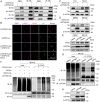
Identification of proteins regulated by LAPTM5. WEHI231 cells were transduced with retrovirus expressing LAPTM5 or vector and subjected to quantitative proteomics analysis. (A) Heatmap and clustering patterns of differentially expressed proteins in the WEHI231 cells ectopically expressing LAPTM5 or vector. (B) PTEN-interacting proteins obtained from STRING online database analysis. (C) Volcano plot depicting proteins up-regulated (shown in pink) or down-regulated (blue) by ectopic LAPTM5 expression compared with the control group. Significance cutoffs were set to P <0.05 and fold changes >1.5. (D) LAPTM5 promoted WWP2 degradation. HEK293 cells transfected with HA-tagged WWP2 and increasing amounts of His-tagged LAPTM5 expression vector were lysed and subjected to immunoblot for HA, WWP2, His, and LAPTM5.
Fig. 6.
Fig. 6.
LAPTM5 interacts with WWP2 and promotes its lysosomal degradation, leading to increased levels of PTEN through the PY motifs. (A) LAPTM5 physically interacted with WWP2. HEK293 cells transfected with HA-tagged WWP2 and/or His-tagged LAPTM5 were lysed and subjected to immunoprecipitation with α-HA Ab (Left) or α-His Ab (Right). Whole-cell lysate was used as input. (B) Colocalization of LAPTM5 and WWP2 in lysosomes. NIH 3T3 cells were transduced with HA-tagged WWP2 and/or FLAG-tagged LAPTM5 and cultured for 48 h. The cells were then treated with NH4Cl or H2O for 9 h and stained with α-FLAG (red), α-HA (green), α-LAMP1 (violet), and DAPI (blue). (C and D) WWP2 degradation was inhibited by NH4Cl, a lysosome inhibitor, but not by MG132, a proteasome inhibitor. HEK293 cells transfected with HA-tagged WWP2 and/or His-tagged LAPTM5 were treated with 20 mM NH4Cl or H2O for 9 h (C), or with MG132 or dimethyl sulfoxide (DMSO) for 6 h (D). Cells were then lysed and analyzed for the expression of WWP2, LAPTM5, and PTEN by immunoblot. (E) WEHI231 cells expressing LAPTM5 or vector (GFP) were treated with DMSO or MG132 for 6 h and then lysed and subjected to immunoblot. (F) WWP2-mediated ubiquitination of PTEN was reduced by LAPTM5. HEK293 cells were transfected with FLAG-tagged PTEN, Myc-tagged Ub, HA-tagged WWP2, and His-tagged LAPTM5 and 24 h later treated with MG132 for 6 h. The levels of PTEN ubiquitination were evaluated by immunoprecipitation of PTEN followed by anti-Ub immunoblotting. Whole-cell lysate was used as input. (G) PY motifs of LAPTM5 are required for the inhibition of PTEN ubiquitination. WEHI231 cells transduced with retrovirus expressing empty vector (GFP), LAPTM5, or mutant LAPTM5 for 48 h were treated with MG132 for 6 h. The levels of PTEN ubiquitination were evaluated by immunoprecipitation of PTEN followed by anti-Ub immunoblotting. (H) LAPTM5 PY motifs are required for the inhibition of PTEN degradation. WEHI231 cells were transduced with retrovirus expressing empty vector, WT LAPTM5, or mutant LAPTM5 with the three PY motifs mutated (mPYs) and 48 h later lysed and subjected to immunoblot. Whole-cell lysate was used as input.
Fig. 7.
Fig. 7.
LAPTM5 mediates immature B cell apoptosis and maintains B cell tolerance. BCR stimulation by autoantigens up-regulates the expression of LAPTM5, which triggers immature B cell apoptosis through two pathways that converge to suppress AKT phosphorylation. (1) LAPTM5 causes BCR internalization, resulting in decreased phosphorylation of SYK, ERK, and possibly PI3K. This pathway is in line with the earlier findings that chronic stimulation of BM immature B cells by autoantigen results in reduced levels of p-ERK and PI3K (12, 50). (2) LAPTM5 interacts with the E3 ubiquitin ligase WWP2 and promotes its lysosomal degradation, resulting in the accumulation of its substrate, PTEN. Elevated PTEN levels inhibit AKT phosphorylation, leading to increased FOXO1 expression and up-regulation of p27Kip1 and BIM.

References

    1. Pelanda R., Torres R. M., Central B-cell tolerance: Where selection begins. Cold Spring Harb. Perspect. Biol. 4, a007146 (2012). - PMC - PubMed
    1. Melchers F., Checkpoints that control B cell development. J. Clin. Invest. 125, 2203–2210 (2015). - PMC - PubMed
    1. Nemazee D., Mechanisms of central tolerance for B cells. Nat. Rev. Immunol. 17, 281–294 (2017). - PMC - PubMed
    1. Wang Y., Liu J., Burrows P. D., Wang J. Y., B cell development and maturation. Adv. Exp. Med. Biol. 1254, 1–22 (2020). - PubMed
    1. Tsubata T., B-cell tolerance and autoimmunity. F1000 Res. 6, 391 (2017). - PMC - PubMed

Publication types

MeSH terms